DOI:
https://doi.org/10.14483/22484728.3742Publicado:
2012-08-13Número:
Vol. 6 Núm. 1 (2012)Sección:
Visión InvestigadoraBlind white denoising of speech signals
Filtrado ciego de ruido blanco en señales de voz
Palabras clave:
Discrete Wavelet transform, denoising, thresholding, white noise, histogram (en).Palabras clave:
Transformada Wavelet Discreta, filtrado, umbralización, ruido blanco, histograma (es).Descargas
Referencias
S. I. Yann. “Transform based Speech Enhancement Techniques”, Ph.D. Thesis, Nanyang echnological University, 2003.
D. L. Donoho, I. M. Johnstone. “Threshold selection for wavelet shrinkage of noisy data”. 16th Annual International Conference of the IEEE, 1994, pp. A24-A25.
D. M. Ballesteros. “Procesamiento digital de señales utilizando Matlab y Simulink. Chapter: Transformada Wavelet Discreta”. Ed. Orcas, 2010, pp. 61-83.
L. Du, R. Xu, F. Xu, D. Wang, H. Chen. “Research on Key Parameters of Speech Denoising Algorithm Based on Wavelet Packet Transform”. Third IEEE International Conference on Computer Science and Information Technology (ICCSIT), 2010, pp. 551-556.
M. T. Johnson, X. Yuan, Y. Ren. “Speech signal enhancement through adaptive wavelet thresholding”. Speech Communication, 49 (2007): 123-133.
Y. Shao, C-H Chang. “A versatile speech enhancement system based on perceptual wavelet denoising”. IEEE International Symposium on Circuits and Systems, 2005, pp. 864-867.
D. M. Ballesteros, A. E. Gaona, L. F. Pedraza. “Discrete Wavelet Transform/Book 2. Chapter: Discrete Wavelet Transform in Compression and Filtering of Biomedical Signal”. Ed. InTech, 2011.
M. S. Chavan, M. N. Chavan, M. S. Gaikwad. “Studies on Implementation of Wavelet for Denoising Speech Signal”. International Journal of Computer Applications, 3(2) (junio 2010): 1-7.
D. L. Donoho. “De-noising by soft-thresholding”. IEEE Transactions of Information Theory, vol. 41, Issue 3, 1995, pp. 613-627.
C. Burrus, R. Gopinath, H. Guo. “Introduction to Wavelets and Wavelet Transforms”. Prentice Hall, 1998, pp. 1-40.
ITU-T. P.835. “Series P: Telephone transmission quality, telephone installations, local line networks: methods for objective and subjective assessment of quality”, 2003.
Mahesh S. Chavan, Manjusha N. Chavan, M. S. “Gaikwad. Studies on implementation of Wavelet for Denoising Speech Signal”. International Journal of Computer Applications (0975 8887), 3(2) (junio 2010).
Cómo citar
APA
ACM
ACS
ABNT
Chicago
Harvard
IEEE
MLA
Turabian
Vancouver
Descargar cita
VISIÓN INVESTIGADORA
Visión Electrónica, 2012-06-01 Volumen:6, Año:1 pág:6-13
BLIND WHITE DENOISING O SPEECH SIGNALS
FILTRADO CIEGO DE RUIDO BLANCO EN SEÑALES DE VOZ
Dora M. Ballesteros
Ingeniera Electrónica, Magister en Ingeniería Electrónica y de Computadores. Docente Universidad Militar Nueva Granada. Correo: dora.ballesteros@unimilitar.edu.co
Andrés E. Gaona
Ingeniero Electrónico, Magister en Ingeniería Área Electrónica. Docente Universidad Distrital Francisco José de Caldas. Correo: aegaona@udistrital.edu.co
Luis F. Pedraza
Ingeniero Electrónico, Magister en Teleinformática. Docente Universidad Distrital Francisco José de Caldas. Correo: lfpedrazam@udistrital.edu.co
ABSTRACT
Discrete Wavelet Transform (DWT) has been used in the recent years in signal processing applications, i.e. filtering and compression. In the case of denoising because the energy of the noise is spread in the entire wavelet coefficients and it has low amplitude, it can be rejected by thresholding. In this paper, we propose a model to evaluate the influence of the denoising parameters in the quality of the speech signals, by a blind process. We examine the residual signal to establish an objective and blind criteria for selecting the following parameters: base, levels of decomposition, rule, and threshold. This model can be applied in any type of speech signal, no matter its behavior in time and frequency.
Key wordsDiscrete Wavelet transform, denoising, thresholding, white noise, histogram.
Resumen
La Transformada Wavelet Discreta se ha utilizado en los últimos años en aplicaciones de procesamiento de señales, como el filtrado y la compresión. En el caso específico de eliminación de ruido, la umbralización permite eliminar el ruido debido a que su energía está esparcida en todos los coeficientes Wavelet y es de baja amplitud. En este trabajo se propone una metodología para evaluar la influencia de los parámetros de filtrado en la calidad de la señal de voz, en un proceso ciego. A partir de la señal residuo se establece un criterio objetivo y ciego para la selección de los parámetros base, niveles de descomposición, regla y umbral. Esta metodología se puede aplicar a cualquier tipo de señal de voz, sin importar su comportamiento en el tiempo y en la frecuencia.
Palabras claveTransformada Wavelet Discreta, filtrado, umbralización, ruido blanco, histograma.
Introduction
In a natural environment, the speech signals are corrupted by external interference as background noise and others speech signals. Because the treatment of any signal depends strongly of its quality, it is desired to include a pre-processing module before any kind of analysis. The denoising module rejects the external signal and it has been studied by methods based on time and frequency domain [1].
One of the most effective methods to reduce white noise in non-stationary signals, like the speech signals, is the Discrete Wavelet Transform, and it can reject a part of the noise from the noisy speech signal. The basic steps in the denoising stage with the DWT are decomposition of the signal, thresholding, and reconstruction [2]. In the decomposition and the reconstruction steps, the base and the level are the parameters of selection; while in the thresholding the parameters are the threshold and the rule of application [3]. Additionally, the DWT can be used by the wavelet tree or the wavelet packet. First, the decomposition process is performed from the output of the low pass filter; second, the decomposition is performed both the lowpass and highpass filter. Because most of the energy of the speech signal is concentrated in the low frequency of the 4 kHz band, we selected the wavelet tree to conserve the coefficients of the lowest band and thresholding the coefficients of the upper bands. Others authors have applied the wavelet packet [4], [5], [6].
To evaluate the performance of the denoising module, the objective and subjective criteria have been proposed. First, the measurement of the signal to noise ratio (SNR), the percentage of r.m.s. (PRD) and the cross correlation between the noisy signal and the filtered signal; second, the mean opinion score (MOS) conforming to ITU-T P.835 standard. In Biomedical signals one of the most used criteria is the PRD because the quality of the filtered signal must to be the best to conserve the clinical report [7], while, in the case of speech signals the criteria should be adapted according to the Human Auditory System (HAS); it means to conserve the most relevant information in the audible zones and to apply the masking property.
Our proposal differ of the others [8] because it is focused on the residual signal instead of the filtered signal, because if you dont have a prior knowledge of the form and the behavior of the speech signal, it is difficult to identify the right filtered signal; but, if you know the behavior of the external signal, the residual signal must to be like similar. In the case of white noise as the external signal, the residual signal will have a histogram like a Gaussian and the spectrum spread in all the frequencies. This is an important difference in relation to denoising in biomedical signals like electrocardiographic signals, because although these are not periodic, its behavior is known in advance
Blind model and the control parameters
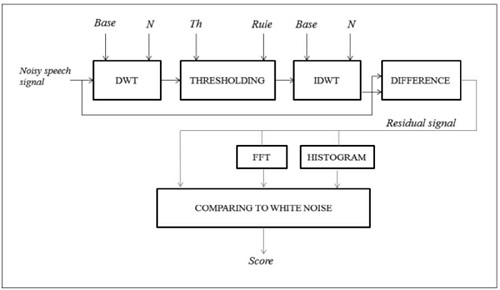
The model presented here is based on applying a thresholding module in the wavelet domain and comparing the residual signal to the reference signal. The overall approach is presented in Figure 1.
Figure 1. rchitecture of the proposed model.
A. Discrete Wavelet Transform (DWT ):
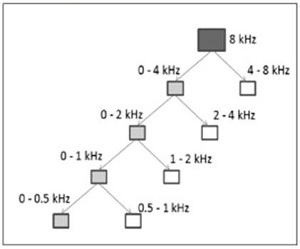
The process of transforming the noisy speech signal to wavelet domain implies two parameters: the base and the level of decomposition (N). The base defines the impulse response of the half band filters, while the level of decomposition defines the resolution in every group of coefficients. In every level, the bandwidth of the signal is divided by two and for the case of N = 4 and fs = 16 kHz the sub-bands correspond to Figure 2.
B. Thresholding:
This step modifies the low coefficients with the purpose of eliminating the non-correlated external signal. It is based on the assumption that the noise and the speech signal are independent and the noise is added to the speech signal, according to [9]:
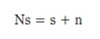 (1)
(1)
In the above equation ns is the noisy speech signal, s is the clean speech signal and n is the additive white noise.
Because the energy of the white noise signal is by definition spread through the bandwidth, its amplitude in every coefficient is less than the amplitude of the speech signal. An adequate threshold (th) can eliminate the low coefficients; it means to reduce the additive white noise.
The rule of application defines the output of the thresholding by a function. The most popular rules are soft and hard thresholding [10].
The soft threshold is defined by:
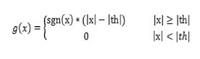 (2)
(2)
Figure 2. Subband DWT decomposition for fs = 16 khz.
Where th is the threshold, x is the wavelet coefficient, sgn(.) is the sign function, and g(x) is the output. And the hard threshold:
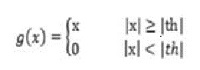 (3)
(3)
The difference between the soft and hard rules is the output when the input exceeds the threshold.
C. Inverse Discrete Wavelet Transform (IDWT):
The modified coefficients are reconstructed according to the parameters selected in the decomposition. The base and level of the decomposition are the same used in the DWT block.
D. Difference:
The filtered signal is subtracted of the noisy signal and the residual signal is obtained. Additionally, the spectrum and the statistics (first to fourth order) of the residual signal are calculated.
E. Comparing To White Noise:
Ideally, the white noise is a random signal which energy is spread in the entire spectrum, but in a real situation the bandwidth is limited. The behavior of the white noise corresponds to a normal distribution, it means mean (m) and skewness (sk) equal to zero, The variance (s) is non-zero value and the kurtosis (k) equal to 3. The statistics are calculated according to Table 1.
Table 1. Statistics.
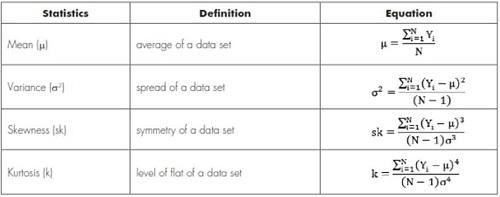
Table 2. score of the residual signal.
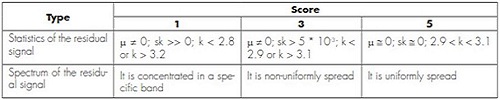
Because the white noise can be characterized by Its statistics, the residual signal in Figure 1 should to match to the above values. Additionally, the spectrum should be a constant. The results are scored according to Table 2.
Experimental
The speech signals used in the current project have been sampled at fs = 16 kHz, encoded using 16 bits, mono-channel and corrupted by additive Gaussian white noise according to the procedure for mixing speech and background noise files contained in the ITU-T P.835 standard [11]. The records correspond to female speaker. Because the proposed methodology is blind, the value of the SNR and the clean signal are unknown in the analysis. The selection of the parameters is related to the statistics of the residual signal and its spectrum. The validation is performed by the mean opinion score (MOS) of the overall quality rating scale.
table 3. Parameters in the denoising stage.
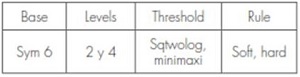
The four parameters of the denoising stage are presented in Table 3. There are 8 combinations, because there are two options by parameter.
Table 4. Score of the statistics.
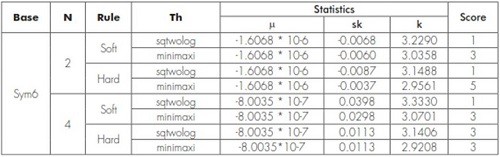
Figure 3. Residual signals of the test in time domain.
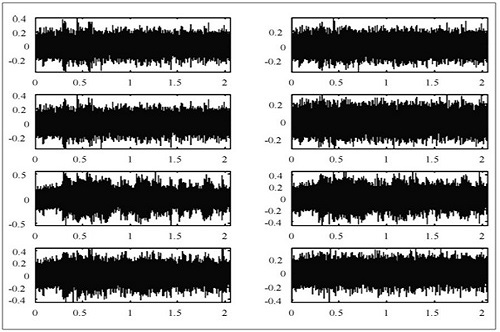
Every combination has been scored in two aspects: statistics of the residual signal and its spectrum. Additionally, the MOS of the filtered signal has been applied. In Figure 3, the residual signals of the eight combinations are presented.
In table 4, the score according the statisticsis assigned to every combination.
Now, the spectrum of every residual signal and its score are presented in Figure 4 and Table 5.
Finally, the average between the score of the statistics and the spectrums are presented in Table 6. Additionally, we have considered the Mean Opinion Score (MOS) of the filtered signals.
According to Table 6, the highest scores in average are the same combinations of the highest scores of MOS; it means the blind model has a good relationship between the statistics and the spectrum with the quality of the filtered speech signal.
Figure 4. Residual signals of the test in frequency domain.
Table 5. Score of the spectrums.
Table 6. Final score.
Conclusions
A blind method for speech signal enhancement using statistics and frequency behavior of the residual signal has been presented. The scores obtained by the mathematical results are strongly related with the scores obtained by the MOS test; it implies that the blind model proposed can be used for removing white additive noise of speech signals. In relation to the statistics, the skewness is the most difficult to satisfy; while the average is the easiest. In the case of the spectrum, four of the eight have a similar behavior, while the best spectrum was only reached by two of them.
References
- S. I. Yann. “Transform based Speech Enhancement Techniques“, Ph.D. Thesis, Nanyang Technological University, 2003.
- D. L. Donoho, I. M. Johnstone. “Threshold selection for wavelet shrinkage of noisy data“. 16th Annual International Conference of the IEEE, 1994, pp. A24-A25.
- D. M. Ballesteros. “Procesamiento digital de señales utilizando Matlab y Simulink. Chapter: Transformada Wavelet Discreta“. Ed. Orcas, 2010, pp. 61-83.
- L. Du, R. Xu, F. Xu, D. Wang, H. Chen. “Research on Key Parameters of Speech Denoising Algorithm Based on Wavelet Packet Transform“. Third IEEE International Conference on Computer Science and Information Technology (ICCSIT), 2010, pp. 551-556.
- M. T. Johnson, X. Yuan, Y. Ren. “Speech signal enhancement through adaptive wavelet thresholding“. Speech Communication, 49 (2007): 123-133.
- Y. Shao, C-H Chang. “A versatile speech enhancement system based on perceptual wavelet denoising“. IEEE International Symposium on Circuits and Systems, 2005, pp. 864-867.
- D. M. Ballesteros, A. E. Gaona, L. F. Pedraza. “Discrete Wavelet Transform/Book2. Chapter: Discrete Wavelet Transform in Compression and Filtering of Biomedical Signal“. Ed. InTech, 2011.
- M. S. Chavan, M. N. Chavan, M. S. Gaikwad. “Studies on Implementation of Wavelet for Denoising Speech Signal“. International Journal of Computer Applications, 3(2) (junio 2010): 1-7.
- D. L. Donoho. “De-noising by soft-thresholding“. IEEE Transactions of Information Theory, vol. 41, Issue 3, 1995, pp.613-627.
- C. Burrus, R. Gopinath, H. Guo. “Introduction to Wavelets and Wavelet Transforms“. Prentice Hall, 1998, pp. 1-40.
- ITU-T. P.835. “Series P: Telephone transmission quality, telephone installations, local line networks: methods for objective and subjective assessment of quality“, 2003.
- Mahesh S. Chavan, Manjusha N. Chavan, M. S. “Gaikwad. Studies on implementation of Wavelet for Denoising Speech Signal“. International Journal of Computer Applications (0975-8887), 3(2) (junio 2010).
Creation date: Junio de 2012
.png)


.jpg)