
DOI:
https://doi.org/10.14483/udistrital.jour.tecnura.2015.2.a05Publicado:
2015-04-01Número:
Vol. 19 Núm. 44 (2015): Abril - JunioSección:
InvestigaciónData driven fault detection and isolation: a wind turbine scenario
Detección y aislamiento de fallas guiadas por datos: escenario turbina de viento
Descargas
Referencias
Alpaydin, E. (2004). Introduction to Machine Learning (Adaptive Computation and Machine Learning). The MIT Press.
Bergantino, C. F., & S, L. (2009). FaultBuster: data driven fault detection and diagnosis for industrial systems.
Bishop, C. M. (2006). Pattern Recognition and Machine Learning. New York: Springer-Verlag New York, Inc.
Chawla, N. (2005). Data Mining for Imbalanced Datasets: An Overview. En O. Maimon, & L. Rokach (eds.), Data Mining and Knowledge Discovery Handbook (pp. 853-867). Springer US.
Chen, W., & Saif, M. (June 2006). Fault detection and isolation based on novel unknown input observer design (6 pp.)
Duda, R.; Hart, P., & Stork, D. (2001). Pattern Classification. Wiley.
GWEC Global Energy Conuncil (2011). Global wind report, Annual market update 2010.
Kusiak, A., & Shah, S. (2006). Data-mining-based system for prediction of water chemistry faults. IEEE Transactions on Industrial Electronics, 53(2), 593-603.
Lipnickas, A. (2006). Two Stage Neural Networks Based Classifier System for Fault Diagnosis. En V. Palade, L.; Jain, & C. D. Bocaniala (eds.), Computational Intelligence in Fault Diagnosis (pp. 209-230). Springer London.
Odgaard, K. M. (2009). Fault Tolerant Control of Wind Turbines a benchmark mode. In Proceedings of Fault Detection, Supervision and Safety of Technical Processes.
Scholkopf, B., & Smola, A. J. (2001). Learning with Kernels: Support Vector Machines, Regularization, Optimization, and Beyond. MIT Press.
Sylvain, T., & Kobi, A. (2010). Fault detection of univariate non-Gaussian data with Bayesian network.
Tan, P.-N.; Steinbach, M., & Kumar, V. (2005). Introduction to Data Mining (1st ed.), Boston, MA, USA: Addison-Wesley Longman Publishing Co., Inc.
Verhaegen, M. (2008). Fault detection of large scale wind turbine systems: A mixed H/H index observer approach. 2008 16th Mediterranean Conference on Control and Automation(M), 1675-1680.
Walford, C. A. (2006). Wind Turbine Reliability: Understanding and Minimizing Wind Turbine Operation and Maintenance Costs. Energy(March), SAND2006-1100.
Zhou, Y. (2004). Data Driven Process Monitoring Based on Neural Networks and Clasification Trees. Master's thesis, Texas A&M University.
Cómo citar
APA
ACM
ACS
ABNT
Chicago
Harvard
IEEE
MLA
Turabian
Vancouver
Descargar cita
DOI: http://dx.doi.org/10.14483/udistrital.jour.tecnura.2015.2.a05
Data driven fault detection and isolation: a wind turbine scenario
Detección y aislamiento de fallas guiadas por datos: escenario turbina de viento
Rubén Francisco Manrique Piramanrique*,
Jorge Sofrony Esmeral*
* Electrical Engineer, M.Sc. in Computer Science, Assistant Professor at Universidad Sergio Arboleda. Bogotá, Colombia. Contacto: ruben.manrique@usa.edu.co
* Electrical Engineer, M.Sc. and Ph.D. in Control Systems, Associate Professor at Universidad Nacional de Colombia, Bogotá, Colombia. Contacto: jsofronye@unal.edu.co
Fecha de recepción: 30 de noviembre de 2013 Fecha de aceptación: 5 de diciembre de 2014
Citation / Para citar este artículo: Manrique Piramanrique, R. F., & Sofrony Esmeral, J. (2015). Data driven fault detection and isolation: a wind turbine scenario. Revista Tecnura, 19(44), 71-82. doi: http://dx.doi.org/10.14483/udistrital.jour.tecnura.2015.2.a05
Abstract
One of the greatest drawbacks in wind energy generation is the high maintenance cost associated to mechanical faults. This problem becomes more evident in utility scale wind turbines, where the increased size and nominal capacity comes with additional problems associated with structural vibrations and aeroelastic effects in the blades. Due to the increased operation capability, it is imperative to detect system degradation and faults in an efficient manner, maintaining system integrity, reliability and reducing operation costs. This paper presents a comprehensive comparison of four different Fault Detection and Isolation (FDI) filters based on “Data Driven” (DD) techniques. In order to enhance FDI performance, a multi-level strategy is used where: (i) the first level detects the occurrence of any given fault (detection), while (ii) the second identifies the source of the fault (isolation). Four different DD classification techniques (namely Support Vector Machines, Artificial Neural Networks, K Nearest Neighbors and Gaussian Mixture Models) were studied and compared for each of the proposed classification levels. The best strategy at each level could be selected to build the final data driven FDI system. The performance of the proposed scheme is evaluated on a benchmark model of a commercial wind turbine.
Keywords: data mining, fault detection, wind energy.
Resumen
Uno de los mayores inconvenientes presentes en la generación de energía eólica son los altos costos de mantenimiento asociados a fallas mecánicas. Este problema se hace más evidente en las turbinas de viento de escala industrial, en donde incrementos en el tamaño y la capacidad nominal traen consigo problemas adicionales asociados a vibraciones estructurales y efectos aeroelásticos en las hojas. Debido al incremento en la capacidad de operación, es imprescindible detectar de manera eficiente fallas y degradaciones en el sistema, garantizando la integridad, su fiabilidad y reduciendo los costos de operación. Este artículo presenta un sistema para la detección y aislamiento de fallas (FDI), basado en técnicas "Guiadas por los datos" (Data driven, abreviado DD). La arquitectura propuesta es una estrategia de varios niveles en donde: (i) el primer nivel detecta la ocurrencia de una falla (detección), mientras que (ii) el segundo identifica su origen (aislamiento). Se estudiaron y compararon cuatro técnicas de clasificación para cada uno de los niveles (Máquinas de Vectores de Soporte, Redes Neuronales Artificiales, K vecinos cercanos y Mezcla de Gaussianas). La mejor estrategia en cada nivel fue seleccionada para construir el sistema FDI. El rendimiento del sistema propuesto se evalúa en un modelo de referencia de una turbina eólica de escala comercial.
Palabras clave: energía eólica, detección de fallas, minería de datos.
Introduction
Energy generation is one of humanities greatest concerns, as most social activity has been built around its consumption. This highlights the fact that we need to introduce new sources of “green” energy that are reliable, accessible, and economically attractive. Within this context, wind energy has become one of the most popular options, observing a market growth of approximately 24% in the last decade (GWEC Global Energy Conuncil, 2011). Wind power and its transformation into electrical energy is a simple idea that comes along with many challenges. The underlying idea is that wind power absorption is proportional to the square of the blade length and to the wind velocity cubed. As the demand of installed capacity increases, so does the need to design generators with higher rated capacity. This may only be achieved either by increasing the wind speed (which is generally unfeasible) or increasing the size of the blades. At these sizes a significant increases in the structural loads and vibrations are introduced. If these increase in load is not properly addressed the system may be more prone to malfunction in its mechanical components, and consequently less cost efficient. Although the efficiency of wind turbines has improved greatly, their reliability has decreased. This leads to an increase in maintenance costs, which translates into longer down times and captured energy losses.
Modern active control techniques can optimize efficiency and increase system reliability. Nonetheless, faults are likely to occur and have a negative impact on system performance, or even result in catastrophic events if not detected on time. In addition, wind turbines are located in remote locations, under extreme environmental conditions, making it difficult to implement preventive maintenance plans. It has been reported (Walford, 2006) that approximately 10%-15% of the total revenues due to wind energy generation has to be reinvested into maintenance. Analytical Fault Detection and Isolation (FDI) may offer a cost efficient solution that allows for early fault detection. It is believed that FDI techniques, and the early detection of faults, can reduce the mean down time of wind turbines and repair costs associated with their operation. Industrial demand for such FDI systems has seen an exponential growth in recent years, and has been accompanied by higher performance and reliability demands. FDI techniques have become an essential component in the development of intelligent autonomous systems where it is necessary to constantly monitor the health state (detect, isolate and estimate severity of the failure mode) of the system.
Model based techniques are the most common approach to building analytic FDI systems, where many techniques have been proposed including Kalman filters (Bergantino & S, 2009) , unknown input observers (Chen & Saif, 2006), and H∞/H2 filters (Verhaegen, 2008), have been used. The underlying idea behind model based FDI is to use a mathematical model of the system as the source of redundant information, and produce estimates of the systems measured outputs, this model is usually developed based on some fundamental understanding of the physics of the process. The disadvantage of this approach is the need for an accurate model of the process; in other words, model based techniques are affected by model uncertainties, plant disturbances and measurement noise. An alternative approach known as “Data Driven” (DD) FDI uses a collection of measured data to unearth patterns of normal and faulty behavior. DD FDI is based on the advances in areas such as data mining, machine learning and computational intelligence. Some of the most popular DD FDI techniques used Artificial Neural Networks (Zhou, 2004), (Kusiak & Shah, 2006) and Bayesian Networks (Sylvain & Kobi, 2010), amongst others.
This article presents the application of data mining techniques to a Fault Detection and Isolation problem setup. The main contribution is the proposition of a multi-level architecture where the first level must evaluate the existence of a fault, while the objective of the second level is to isolate the source of the fault. This strategy, in combination with a FCTW, proved to enhance performance of the FDI filters, hence making them comply with industrial standards and readily available for the practitioner. The paper starts with a brief outline of the classification techniques used; it follows by describing the DD FDI architecture proposed and its application to a benchmark model of a utility scale wind turbine as proposed in (Odgaard, 2009); the DD FDI system is constructed and simulation results are presented to highlight the usefulness of the data driven approach; finally some concluding remarks are given.
Wind turbine configuration
The basic wind turbine configuration is as follows. The nacelle contains main components including the generator and gearbox, and sits on top of the tower structure. The blades are connected to the rotor, which in turn is connected to the generator via the gearbox. The nacelle contains a yaw motor that allows the blades to face the wind. Large utility scale generators are generally variable speed and have mechanisms that change the blade pitch angle and control the lift produced by the wind. Wind turbines have additional actuators and sensors that can be used for control. The generator torque load can be used to dictate the amount of electrical power absorbed from the mechanical system, and act as a breaking system to control the acceleration of the rotor; a breaking system can set the rotor to a full stop. The main measurements are the rotor and generator speeds and blade pitch angles. As one of the main premises is that the system must remain low cost, high cost and redundant sensors are generally avoided, which entail additional challenges to the closed loop control and FDI problems.
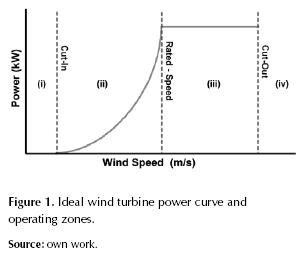
The turbine operates at four distinct regions, figure 1: (i) cut in speed, where winds are insufficient; (ii) the interim region, i.e. the region between the cut in and rated wind speed; (iii) maximum power capture region, which starts at the minimum rated wind speed; (iv) cut out speed, where wind speeds are too high. The general control objective is to maximize power absorption while operating in region (ii) and minimize structural loads when operating in region (iii); regions (i) and (iv) are not contemplated.
The data set was generated from simulation results of a “benchmark” wind turbine model built for the development and analysis of FDI systems (Odgaard, 2009). In figure 2 the components of the model used and the relationship between them are represented. This model is a simplification of a three blade, utility scale (horizontal) wind turbine with a reated power of 4.8 MW. Each blade has independent pitch motion, hence the control system provides three separate pitch command signals, i.e βi,r where i = [1,2,3]; the actual pitch position is measured by sensors that provide signals βi,m. Although the model has (dual) physical redundancy for the pitch sensors, the aim of this paper is to analyze the performance of an analytical DD FDI system so we will eliminate redundant measurements.
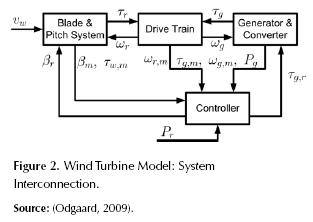
The torque transmitted to the generator and the rotor is denoted τg and τr respectively, while the angular velocity of the generator and the rotor are denoted by ωg (rad/s) and ωr (rad/s) (respectively). The complete set of measurements (in addition to pitch angle measurements) includes the transmitted torques, angular velocities and the wind speed (νw ). The captured power is approximately given by equation (1).
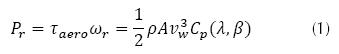
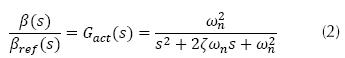
where τaero (N) is the aerodynamic torque, ωr is the rotor speed, ρ (kg/m2) is the air density, A (m2) is the area swept by the rotor, νw (m/s) is the wind speed. Cp is the power coefficient which represents how much power available in wind is captured. Cp is a function of blade pitch angle β (deg) and tip speed ratio  R (m) is the rotor radius. The pitch actuators on the system are represented by a transfer function Gact(s) (ecuation (2) with ς=0.6 and ωn=11.11).
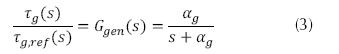
The generator’s dynamics are modeled with a first-order transfer function, equation (3).
The drive train and generator are modeled by a two mass model, equation (4).
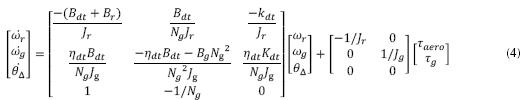
Where θΔ is the drivetrain torsion, Jr and Jg are the rotor and generator inertia, Br and Bg are the viscous damping of the rotor and generator. Bdt and Kdt are the damping and stiffness coefficients of the drivetrain flexibility, Ng is the gearbox ratio and ηdt is the efficiency of the drive train. If the turbine is operating in Region 3, a discrete PI controller generates the pitch commands references to maintain the rated rotor speed. The generator torque is set as 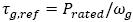 .
.
Application of data mining techniques
The fault diagnosis and isolation problem involves determining the failed component (isolation) once a fault has been detected (detection). The ability to isolate faults can be made “simple” at the expense of additional, physically redundant, sensors and increased costs, thus it is of interest to develop techniques that use analytical (redundant) information. Although the most common approach to analytical FDI is to use model-based techniques, the construction of a high fidelity model is a cumbersome task; data mining techniques allow the detection and isolation of system faults by only using input/output data.
From a data mining perspective, classification is the task of finding (training) an objective function f (x) which assigns one of the predefined class labels y, to each set of the attributes x; the training data is the collection of records (examples), characterized by a tuple (x,y). For the case of an FDI system, y may take values associated with each of the fault modes and x would be the vector of measured signals of the system. Although there is a broad range of classification strategies, this paper will focus on four of them: Support Vector Machines (SVM), Artificial Neural Networks (ANN), Bayesian Classifiers (i.e Naive Bayes with Gaussian Mixture Models) and K Nearest Neighbors (KNN). A brief description of each of these techniques will be provided next.
Support vector machines: Vladimir Vapnik first introduced SVM within the context of binary classification problems. The basic idea behind SVM is to find an optimal hyperplane that maximizes the separation margin between the classes. Finding this hyperplane is equivalent to solving a constrained optimization problem whose solution is a linear combination of training examples that lie on the edge of the margin; these are known as “support vectors”. The mathematical description of the algorithm is extensive and can be found in (Scholkopf & Smola, 2001).
Artificial neural networks: These are inspired by a simplification of the biological neural system, which consists of simple computing elements (called neurons) connected through synaptic weights. The multilayer perceptron (MLP) is the most applied architecture and consists of an input layer, at least one hidden layer, and an output layer. The input to a given neuron is a linear combination of the output of neurons from the previous layer, where each input is weighted by their respective synaptic weight. Associated to each neuron, there exists a nonlinear activation function, which transforms the linear combination of inputs into the neurons output, which in turn is an input to the neurons in the next layer. For the application proposed, the number of hidden layers and neurons was determined experimentally, where sigmoidal activation functions achieved the best results. The ANN is trained using a back propagation with gradient descent algorithm as detailed in (Bishop C. M., 2006).
K nearest neighbors: The K Nearest Neighbors (KNN) approach consists of a supervised classifier based on neighborhoods. The underlying idea is that a new sample belongs to the class to which the largest numbers of (k nearest) neighbors belong. One of the challenges is to choose appropriately the number (i.e. k) of neighbors to be analyzed; if k is too large it may be difficult to discriminate from global tendencies, but if k is small classification may be imprecise because of the lack of data. Note that KNN depends greatly on the way distance is calculated, thus it is possible to have different classifiers by using different distance metrics. The classifier proposed in this paper uses the Euclidean norm, where the Euclidian norm of a vector x is given by 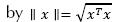 . The distance between tow vectors, xi and xj , is defined as
  as the metric for distance.
Bayesian classifiers: Bayesian classifiers are based on probability theory, where classification is made depending on which class has the greatest probability of occurrence or the lowest risk (Duda, Hart, & Stork, 2001). Assume that the problem considered is the classification of a set of attributes as one of K different classes. The vector of attributes (features) is denoted as  where d is the dimension of the vector and the probability that the vector x belongs to the class yk is
  (known as posterior probability). The attribute set x belongs to the class with the highest posterior probability, where can be calculated according to Bayes’ formula, equation (5).
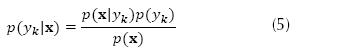
Where  is the probability density function of class yk and p(yk) is the prior probability of the class. If the prior probabilities are not currently known, they can be estimated from the proportions of the class in the training set (Tan, Steinbach, & Kumar, 2005). A feature vector x, belongs to the class yk if
  is has highest posterior probability of all the K classes:
  . The biggest challenge when implementing Bayesian classifiers is to estimate the probability density function (PDF)
  . In practice, this PDF is always unknown and must be calculated from the available information, i.e. the ‘training data’. Two approaches, namely Naive Bayes and the Mixture of Gaussians, will be presented next.
The Naive Bayes (NB) approach estimates  assuming that the attributes are conditionally independent for a given class k. To estimate the conditional probabilities
  , we can assume a certain form of probability distribution and calculate the parameters of the distribution using the training data (Tan, Steinbach, & Kumar, 2005).
In many cases an exact density function can be difficult to obtain or not follow any particular distribution function. If this is the case, it is possible to use a linear combination of Gaussian distributions to represent (i.e. model) the “real” PDF of each class (Gaussian Mixture Models). Each distribution function is the modeled via equation (6).
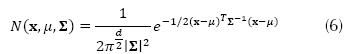
Where x is the vector of features, μ is the mean vector, ∑ is the covariance matrix and  is its determinant. In our particular case, the classifier was constructed under the following premises: i) the probabilities of occurrence of each class, i.e. p(yk) for k = [1,…, K], are known and equal to 1/K; ii) the probability density functions
  for k = [1,…, K], are constructed using a linear combination of n multivariate Gaussian distributions; iii) since there is no optimal way to choose n (Sylvain & Kobi, 2010), its value was chosen experimentally; iv) the GMM parameters are calculated using an Expectation Maximization Algorithm (Alpaydin, 2004).
Methodology
The data set corresponds to a simulation of 3700 seconds with the model specified above and sampling time Ts = 0,01 seg. A total of seven fault modes were studied, originally proposed by (Odgaard, 2009), each of which was triggered at different time intervals. Fault 1: Fixed value in pitch 1 position sensor measurement, Fault 2: Scaling error in pitch 2 position sensor measurement, Fault 3: Fixed value in Pitch 3 position sensor measurement, Fault 4: Fixed value in rotor speed sensor measurement, Fault 5: Scaling error in rotor and generator speed sensor measurements, Fault 6: Degraded hydraulic pitch system response pitch actuator 2 and Fault 7: Air in Oil Failure pitch actuator 3.
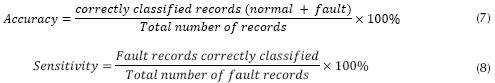
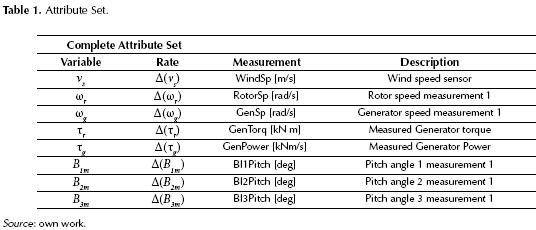
The signals of the monitoring system are wind speed, pitch position, generator speed, rotor speed and generated power (as shown in table 1) and constitute our initial set of attributes. The classifiers were trained according to the algorithms discussed earlier in the paper, and results are analyzed in terms of detection times and false alarm clear out time. To evaluate the models constructed from the perspective of data mining (i.e. prediction levels), the following metrics are defined (equations (7) and (8)).
Data-Driven fault detection and isolation system training
DD FDI systems use measured signals as attributes to build the training set, thus the quality of the classifiers depends greatly on the quality of the training set used. In order to increase the classification model’s accuracy, three actions were performed on the data: data sampling, outlier elimination and attribute (feature) creation.
Data sampling: Sampling is the process of selecting a representative (reduced) set that still allows a thorough examination of the entire data. Sampling is needed in order to allow the abstraction of a complex problem, as well as to acquire a sub set that infers information from a larger data set. It is widely accepted that a fairly modest sized sample can sufficiently characterize a much larger population. The usefulness of the sample is determined by two characteristics: the size and the “quality” of the sample. The sample size should not be too small since it may misrepresent the entire data set, or too large that it overloads the computational algorithms.
In order to generate a suitable training set, it was necessary to reduce the total number of data registers and balance the proportion of “normal” and “faulty” operation events. There exist several procedures that aid in the process of data set sampling. In this paper we followed a simple procedure (random sampling) that allowed a balanced reduction of the class labeled as “normal”. A (simple) random sample of size n consists of n individuals from the population chosen in such a way that every individual has an equal chance of being selected. The total number of data registers used for training was 390,000, where 75% correspond to data representing the normal operation of the system, while the remaining registers correspond to faulty behavior. Through random sampling, this number was reduced to 197,000 registers and a balanced data set was obtained.
Outlier elimination: An outlier is generally considered to be a data point that is far outside the normal behavior of a variable or population. Outliers can have deleterious effects on statistical analyses since they generally serve to increase error variance and reduce the relevance of statistical tests. Additionally they can seriously bias or influence estimates that may be of substantive interest. It is therefore desirable to eliminate data that may deteriorate detection performance, i.e. outlier elimination.
Several formal statistical tests have been devised to determine if a certain value can be considered as an outlier. In its simplest form, box plots present five measurements (the minimum, the lower quartile, the median, the upper quartile and the maximum), all in a visual display. The lower quartile has 25% of the sample values below and 75% above it. The upper quartile has 25% of the sample values above it and 75% below. The middle quartile is the median and the middle half of the sample lies between the upper and lower quartile. The distance between the upper and lower quartile is called the interquartile range. Any observation outside the interquartile range is considered a potential outlier. After analyzing data box plots, it was possible to identify and eliminate a set of outliers associated with the turbine’s start up process and can therefore be ignored. The outlaying data provides no useful information and may correspond to an event that we do not wish to classify.
Creating new attributes: From a viewpoint of data mining, it is possible to increase sensitivity to a particular class and accuracy of a classifier by creating new attributes (Tan, Steinbach, & Kumar, 2005). For example, fixed value sensor faults may be difficult to detect if the faulty measurement is close to steady state, normal operation value. This problem can be solved by creating a new set of attributes that takes into account the “velocity” of the measurements, and not only its value. Although it may be possible to find more robust attributes, we want to avoid the pre-processing of input data as much as possible; hence the rate of change is a suitable choice. By defining 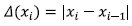 as the rate of change of the measurement x a new set of attributes is constructed.
As an exploratory exercise, and with the objective of determining the quality of the FDI models that could be obtained using the previously mentioned techniques, four classifiers were constructed. The training set consists of a family of attributes (see table 1) and a flag that determines the occurrence of a given fault; the flag will take a zero value when no fault occurs (i.e. normal behavior), and will take a value within the set {1,2,3,4,5,6,7} in the event of fault occurrence (i.e. the flag values is 1 where Fault 1 is present, and so on). At his stage a full FDI systems is constructed for each one of the methods proposed.
To evaluate the performance of each FDI system, a total 50 simulations were performed per technique proposed. Each simulation had duration of 3700 seconds, exhibiting all of the faults at different times. It is important to mention that simulations sequences were different from the training set, and that no preprocessing was performed on the data. The results obtained are presented in table 2.
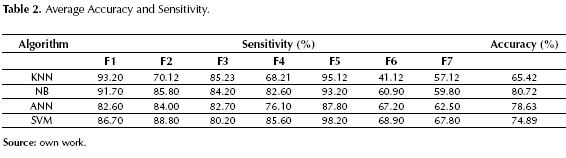
Observing the general results presented in table 2, it is possible to draw the following conclusions. First, it is important to highlight the need to generate suitable training sets by using outlier elimination techniques and appropriate data sampling (an average 10% degradation was observed when no preprocessing was performed). This will reduce the risk of having the model memorize the training set and avoid any unwanted bias caused by abnormal operation states (i.e. turbine startup). Second, Faults 1 through 5 are abrupt in nature and their detection presents acceptable levels of accuracy and sensitivity, and a low number of false alarms. Unfortunately, for Faults 6 and 7, low sensibility is exhibited and a high number of false alarms are present. Because of this the presented strategy is not suitable for the FDI application at hand and it is necessary to investigate new architectures. Third, it was observed that incipient faults were more difficult to detect due to their slow growing nature. In fact, it was observes that ANN and SVM techniques provided better detection properties for incipient faults, thus a reliable DD FDI system may require the application of more than one data mining technique.
In general, probabilistic methods tend to present better classification performance, and this is supported by the fact that the Naive Bayes method presented the best accuracy and sensitivity indicators of the four algorithms tested. Nonetheless, in order to obtain good results it is necessary to have an accurate (or good enough) PDF. Initially, the task of finding a PDF for detection (determining state of Fault/No Fault) may seem to be relatively easy because the problem at hand is that of binary classification. As the requirements scale up to identification, finding an accurate PDF may become rather complex, thus the need for more advance techniques such as Mixed Gaussian Models to determine an approximate, but accurate enough PDF.
Data driven techniques have proved to be a promising approach to fault detection and isolation, but the previous result also stressed the fact that more heuristic architectures are needed in order to reach the performance levels required for industrial applications. Having this in mind, the next section proposes a Multi Level architecture that deals with the problem of detection and the problem of isolation in a sequential manner.
Multi level dd FDI
The FDI system proposed uses a two level detection architecture: the first classification level is responsible for detecting the fault and distinguishing faulty from normal behavior; the second level is responsible of isolating the source of the failure. The FDI architecture is summarized in figure 3. Details on the construction of each classification level are discussed next.
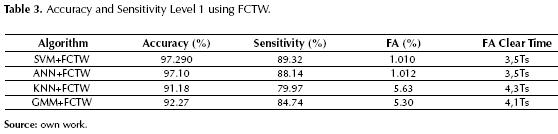
Level 1: This level is posed as a binary problem where the main classes are “Fault” and “Normal”. It is important to note that at this stage it is imperative to recognize states of failure, hence the classifier is trained to have high sensitivity at the expense of partial degradation of the general accuracy. As a consequence, this level has a high number of false alarms, so in order to enhance accuracy a Fault Counter on Time Windows (FCTW), as proposed in (Lipnickas A. , 2006), was implemented. The main objective is to verify the “persistence” of the faulty behavior, so the classifier must identify the “Fault” persistently over a given period of time. The size of the time window was determined experimentally by considering that there is a trade off between accuracy and detection time. It should be noted that this approach is not suitable for intermittent faults with long periods of occurrence.
The average performance over 50 test runs is summarized in table 3. The accuracy is, in general, higher than 80%, with sensitivity above 90% for SVM, ANN and GMM. At this level we are interested in a classification model with high sensitivity, which usually presents a higher number of false alarms. It can be note no model has an accuracy greater than 90%, indicating that there is a low number of undetected faults, but a considerable number of false alarms. The table also shows the percentage of false alarms (FA %) and the recovery time after its occurrence (FA Clear Time).
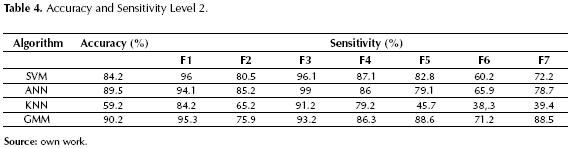
Level 2: This stage consists of a multi class classification problem, where all the possible occurrences of fault are a given class. At this level the training set is constructed with data in a state of “Fault”, and the main goal is to isolate the source of the fault. All the implemented strategies are multi class classifiers, i.e. there are a total of 7 classes that need to be identified. The results of the validation tests are shown in table 4, where the highest accuracy was achieved with the use of ANN and GMM. Additionally, table 4 shows the sensitivity of each algorithm to each of the faults. Notice that SVM and ANN are more sensitive to Faults 1 5, corresponding to faulty sensors, while the GMM algorithm has excellent sensitivity for faults 6, 7 corresponding to faults in the actuators. Moreover, the KNN algorithm exhibited the worst performance.
Simulation tests and results
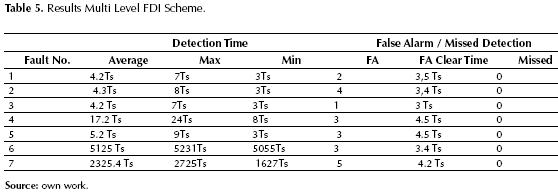
Given the performance results obtained by each model, the FDI system was built for Level 1 using the support vector machines, and for Level 2 GMM. Table 5 lists the average detection time and missed faults over 50 test runs. Fault 6, which represents a pitch actuator, has the longest detection times because this fault is simulated in regions 2 and 3. The problem is that the control scheme uses pitch angle as a control variable only in region 3, hence only in in this region will it be possible to detect this fault. In general, it is very difficult to detect faults associate with pitch movement in region 2 because blade pitch angles are assumed to be constant. Faults 1 to 4 have acceptable detection times. Fault 7 presents long detections times since it is an incipient fault, which can only be detected (in this case) until the movement of pitch 3 is considerably degraded.
Conclusions
This paper presents a multi-level DD FDI system architecture that provides enhanced performance compared to single level DD FDI. In each level, four different classification strategies (SVM, ANN, KNN and GMM) were implemented and tested, where SVM and ANN showed higher accuracy for binary classification (Level 1); for multi class classification (Level 2) GMM based FDI exhibited the best performance, in particular for actuator fault detection. The FDI system built is capable of recognizing all failures selected with acceptable detection times. One of the biggest challenges in FDI is reducing the number of false alarms. Although dividing the problem into two levels and adding a FCTW to the first level of detection achieved an important reduction in false alarms, this is still an open research problem.
Data Driven classification techniques have the advantage of not needing a mathematical model of the system, and rather tries to model data behavior. Although this means that less information about the system is needed, in many cases appropriate attribute sets may only be obtained through an ad hoc process that requires some expert knowledge about the process. This may be particular useful if there is some historical knowledge regarding probability of occurrence of each fault and their cause.
One of the drawbacks in this experimentation is that we had a large data set that allowed us construct the training set in a rather simple manner. In practical applications this may generally not be the case, and the quality of the classifier may be affected. Although there are different techniques that can be used to deal with small or unbalanced data sets (Chawla, 2005), it is still important to have suitable historical data in order to be able to achieve the desired results.
References
Alpaydin, E. (2004). Introduction to Machine Learning (Adaptive Computation and Machine Learning). The MIT Press.
Bergantino, C. F., & S, L. (2009). FaultBuster: data driven fault detection and diagnosis for industrial systems.
Bishop, C. M. (2006). Pattern Recognition and Machine Learning. New York: Springer-Verlag New York, Inc.
Chawla, N. (2005). Data Mining for Imbalanced Datasets: An Overview. En O. Maimon, & L. Rokach (eds.), Data Mining and Knowledge Discovery Handbook (pp. 853-867). Springer US.
Chen, W., & Saif, M. (June 2006). Fault detection and isolation based on novel unknown input observer design (6 pp.)
Duda, R.; Hart, P., & Stork, D. (2001). Pattern Classification. Wiley.
GWEC Global Energy Conuncil (2011). Global wind report, Annual market update 2010.
Kusiak, A., & Shah, S. (2006). Data-mining-based system for prediction of water chemistry faults. IEEE Transactions on Industrial Electronics, 53(2), 593-603.
Lipnickas, A. (2006). Two Stage Neural Networks Based Classifier System for Fault Diagnosis. En V. Palade, L.; Jain, & C. D. Bocaniala (eds.), Computational Intelligence in Fault Diagnosis (pp. 209-230). Springer London.
Odgaard, K. M. (2009). Fault Tolerant Control of Wind Turbines a benchmark mode. In Proceedings of Fault Detection, Supervision and Safety of Technical Processes.
Scholkopf, B., & Smola, A. J. (2001). Learning with Kernels: Support Vector Machines, Regularization, Optimization, and Beyond. MIT Press.
Sylvain, T., & Kobi, A. (2010). Fault detection of univariate non-Gaussian data with Bayesian network.
Tan, P.-N.; Steinbach, M., & Kumar, V. (2005). Introduction to Data Mining (1st ed.), Boston, MA, USA: Addison-Wesley Longman Publishing Co., Inc.
Verhaegen, M. (2008). Fault detection of large scale wind turbine systems: A mixed H/H index observer approach. 2008 16th Mediterranean Conference on Control and Automation(M), 1675-1680.
Walford, C. A. (2006). Wind Turbine Reliability: Understanding and Minimizing Wind Turbine Operation and Maintenance Costs. Energy(March), SAND2006-1100.
Zhou, Y. (2004). Data Driven Process Monitoring Based on Neural Networks and Clasification Trees. Master's thesis, Texas A\&M University.
Licencia
Esta licencia permite a otros remezclar, adaptar y desarrollar su trabajo incluso con fines comerciales, siempre que le den crédito y concedan licencias para sus nuevas creaciones bajo los mismos términos. Esta licencia a menudo se compara con las licencias de software libre y de código abierto “copyleft”. Todos los trabajos nuevos basados en el tuyo tendrán la misma licencia, por lo que cualquier derivado también permitirá el uso comercial. Esta es la licencia utilizada por Wikipedia y se recomienda para materiales que se beneficiarían al incorporar contenido de Wikipedia y proyectos con licencias similares.