
DOI:
https://doi.org/10.14483/udistrital.jour.tecnura.2017.1.a06Publicado:
01-01-2017Número:
Vol. 21 Núm. 51 (2017): Enero - MarzoSección:
InvestigaciónE2CAV, Pavement layer thickness estimation system based on image texture operators
E2CAV, sistema para la estimación del espesor de la capa de pavimento basándose en operadores de textura en imágenes
Palabras clave:
Pavement layer, thickness estimation, Gabor filters, texture operators, Otsu (en).Palabras clave:
capa de pavimento, estimación de espesor, filtros Gabor, operadores de textura, Otsu (es).Descargas
Referencias
Aldana, C., Orozco, N., & Barreto, S. (2014). Identification of multiple sclerosis brain lesions in magnetic resonance imaging using texture analysis. Tecnura, 18, 89–101. doi:http://dx.doi.org/10.14483/udistrital.jour.tecnura.2014.SE1.a07
Bouguet, J.-Y. (2013). Camera Calibration Toolbox for Matlab. California Institute of Technology. Retrieved from http://www.vision.caltech.edu/bouguetj/calib_doc/
Brox, T., Weickert, J., Burgeth, B., & Mrázek, P. (2006). Nonlinear structure tensors. Image and Vision Computing, 24(1), 41–55. doi:10.1016/j.imavis.2005.09.010
Caselles, V., Kimmel, R., & Sapiro, G. (1997). Geodesic Active Contours. International Journal of Computer Vision, 22(1), 61–79.
Charlampidis, D. (2011). Texture Segmentation Using Iterative K-means. New Orleans: Department of Electrical Engineering, University of New Orleans.
Evans, R., Frost, M., Stonecliffe-Jones, M., & Dixon, N. (2008). A Review of Pavement Assessment Using Ground Penetrating Radar ( GPR ). In 12th International Conference on Ground Penetrating Radar (pp. 2–11). Birmingham, UK.
Gonzales, R., & Woods, R. (2007). Digital Image Processing (3rd Ed.). Prentice Hall. Upper Saddle River, NJ, USA.
Greensted, A. (2010). Otsu - Thresholding. The Lab Book Pages. Retrieved from http://www.labbookpages.co.uk/software/imgProc/otsuThreshold.html
GSSI. (2013a). Ground Penetrating Radar Antennas. Retrieved from http://www.geophysical.com/antennas.htm
GSSI. (2013b). GPR Data Acquisition Unit - SIR30. Retrieved from http://www.geophysical.com/sir30.htm
Hugenschmidt, J., & Fürholz, P. (2012). ATRAS – An automated GPR system for data acquisition and storage for roads and bridges. In 14th International Conference on Ground Penetrating Radar (GPR) (pp. 448–453). Shanghai, China. doi:10.1109/ICGPR.2012.6254907
INVIAS. (2014). Estado de la Red Vial. Instituto Nacional de Vías. Retrieved June 9, 2015, from http://www.invias.gov.co/index.php/red-vial-nacional/2-uncategorised/57-estado-de-la-red-vial
Kruchten, P. (2003). The Rational Unified Process: An Introduction (3rd ed.). Addison-Wesley Professional. Boston, MA, USA.
Little, M. A., & Jones, N. S. (2011). Generalized methods and solvers for noise removal from piecewise constant signals. I. Background theory. Proceedings. Mathematical, Physical, and Engineering Sciences / the Royal Society, 467(2135), 3088–3114. doi:10.1098/rspa.2010.0671
MacQueen, J. (1967). Some methods for classification and analysis of multivariate observations. In Proceedings of the Fifth Berkeley Symposium on Mathematical Statistics and Probability, Volume 1: Statistics. The Regents of the University of California.
Malik, J. (2000). Normalized cuts and image segmentation. IEEE Transactions on Pattern Analysis and Machine Intelligence, 22(8), 888–905. doi:10.1109/34.868688
OpenCV. (2014). OpenCV documentation. OpenCV ORG. Retrieved June 1, 2015, from http://docs.opencv.org/
Otsu, N. (1979). A Threshold Selection Method from Gray-Level Histograms. IEEE Transactions on Systems, Man, and Cybernetics, 9(1), 62–66. doi:10.1109/TSMC.1979.4310076
Pajewski, L., Benedetto, A., Derobert, X., Giannopoulos, A., Loizos, A., Manacorda, G., … Trinks, I. (2013). Applications of Ground Penetrating Radar in civil engineering — COST action TU1208. 2013 7th International Workshop on Advanced Ground Penetrating Radar, 1–6. doi:10.1109/IWAGPR.2013.6601528
Salman, M., Mathavan, S., Kamal, K., & Rahman, M. (2013). Pavement crack detection using the Gabor filter. In 16th International IEEE Conference on Intelligent Transportation Systems (ITSC 2013) (pp. 2039–2044). IEEE. doi:10.1109/ITSC.2013.6728529
Sanchez, F., Posso, H., Lederman, P., Fernandez, H., Estrada, F., Leguizamo, P., … Posso, H. (2008). Guía Metodológica para el Diseño de Obras de Rehabilitación de Pavimentos Asfálticos de Carreteras. (M. de Transporte, Ed.) (Segunda.). Bogotá, Colombia: Instituto Nacional de Vías.
Sandler, R., & Lindenbaum, M. (2006). Gabor Filter Analysis for Texture Segmentation. In 2006 Conference on Computer Vision and Pattern Recognition Workshop (CVPRW’06) (pp. 178–178). IEEE. doi:10.1109/CVPRW.2006.86
Senthilkumaran, N., & Rajesh, R. (2009). Edge Detection Techniques for Image Segmentation – A Survey of Soft Computing Approaches. International Journal of Recent Trends in Engineering (IJRTE), 1(2), 250–254.
Sezgin, M., & Sankur, B. (2004). Survey over image thresholding techniques and quantitative performance evaluation. Journal of Electronic Imaging, 13, 146–168. Retrieved from http://www.researchgate.net/publication/202972407_Survey_over_image_thresholding_techniques_and_quantitative_performance_evaluation
Socorras, V., Gomez, E., & Obregon, N. (2014). Calibración de imágenes de radares meteorológicos. Tecnura, 18(41), 12–26. Retrieved from http://revistas.udistrital.edu.co/ojs/index.php/Tecnura/article/view/7019/8691
Zhang, J., Tan, T., & Ma, L. (2002). Invariant texture segmentation via circular Gabor filters. In Object recognition supported by user interaction for service robots (Vol. 2, pp. 901–904). IEEE Comput. Soc. doi:10.1109/ICPR.2002.1048450
Cómo citar
APA
ACM
ACS
ABNT
Chicago
Harvard
IEEE
MLA
Turabian
Vancouver
Descargar cita
DOI: http://dx.doi.org/10.14483/udistrital.jour.tecnura.2017.1.a06
E2CAV, Pavement layer thickness estimation system based on image texture operators
E2CAV, sistema para la estimación del espesor de la capa de pavimento basándose en operadores de textura en imágenes
Brayan Barrios Arcila1, Bladimir Bacca Cortes2, Sandra Nope Rodríguez3
1 Electronic Engineer, graduate Student, Universidad del Valle. Cali, Colombia. Contact: brayanbarrios3744@gmail.com
2 Electronic Engineer, master of Science on Automation, doctor in Technology. Associated Professor at the Universidad del Valle. Cali, Colombia. Contact: bladimir.bacca@correounivalle.edu.co
3 Electronic Engineer, management Project Specialist, doctor in Engineering. Assistant Professor at the Universidad del Valle. Cali, Colombia. Contact: sandra.nope@correounivalle.edu.co
Fecha de recepción: 10 de febrero de 2016 Fecha de aceptación: 23 de noviembre de 2016
Cómo citar: Barrios A., B.; Bacca C., B. y Nope R., S. (2017). E2CAV, sistema para la estimación del espesor de la capa de pavimento basándose en operadores de textura en imágenes. Revista Tecnura, 21(51), 81-95.
Resumen
Contexto: Las carreteras públicas son esenciales para el progreso económico de cualquier país, ya que son fundamentales para el incremento en la eficiencia del transporte de bienes, y son una excelente fuente de empleo. Sin embargo, Colombia tiene pocas estadísticas sobre la condición de sus carreteras. e acuerdo con Invías, el estado de las vías pavimentadas colombianas puede resumirse así: 21,1 % son clasificadas como “Muy buenas”; 34,7 %, como “Buenas”, y 43,46 %, como “Regulares” o “Malas”. Entonces, desde el punto de vista de rehabilitación de pavimentos, vale la pena asegurar la calidad de aquellas carreteras clasificadas como “Regulares” o “Malas”.
Objetivo: En este trabajo se propone un sistema para estimar el espesor de la capa de pavimento usando métodos de segmentación de texturas en imágenes. Actualmente, el espesor del pavimento es estimado usando radares de penetración terrestre, extracción de núcleos o realizando apiques; además, éste forma parte de los parámetros estructurales de los sistemas de evaluación de pavimentos.
Método: El sistema propuesto está compuesto por una unidad de control de movimiento vertical, la cual introduce un videoscopio en un pequeño agujero en el pavimento, entonces las imágenes son obtenidas y unificadas en un computador portátil. Finalmente este mosaico es procesado a través de operadores de textura para estimar el espesor del pavimento. Los usuarios pueden seleccionar entre el método de Otsu y los filtros de Gabor para procesar los datos de imagen.
Resultado: Los resultados reportados en este trabajo incluyen pruebas en laboratorio y en campo; estas pruebas muestran errores de 5,03 % y 11,3 %, respectivamente, en la medida del espesor del pavimento.
Conclusión: El sistema propuesto es una opción atractiva para la estimación local del espesor del pavimento, con mínimos daños estructurales y menor impacto en la movilidad y la cantidad de operarios.
Palabras clave: capa de pavimento, estimación de espesor, filtros Gabor, operadores de textura, Otsu.
Abstract
Context: Public roads are an essential part of economic progress in any country; they are fundamental for increasing the efficiency on transportation of goods and are a remarkable source of employment. For its part, Colombia has few statistics on the condition of its roads; according with INVIAS the state of the roads in Colombia can be classified as “Very Good” (21.1%), “Good” (34.7%), and “Regular” or “Bad” (43.46%). Thus, from the point of view of pavement rehabilitation, it is worth securing the quality of those roads classified as “Regular” or “Bad”.
Objective: In this paper we propose a system to estimate the thickness of the pavement layer using image segmentation methods. The pavement thickness is currently estimated using radars of terrestrial penetration, extraction of cores or making pips; and it is part of structural parameters in the systems of evaluation of pavement.
Method: The proposed system is composed of a vertical movement control unit, which introduces a video scope into a small hole in the pavement, then the images are obtained and unified in a laptop. Finally, this mosaic is processed through texture operators to estimate the thickness of the pavement. Users can select between the Otsu method and Gabor filters to process the image data.
Results: The results include laboratory and field tests; these tests show errors of 5.03% and 11.3%, respectively, in the thickness of the pavement.
Conclusion: The proposed system is an attractive option for local estimation of pavement thickness, with minimal structural damage and less impact on mobility and number of operators.
Keywords: Pavement layer, thickness estimation, Gabor filters, texture operators, Otsu
INTRODUCTION
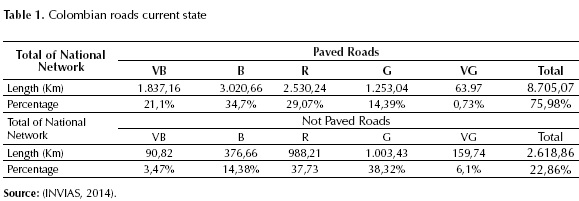
Countries development relies most on transport infrastructure; and public roads are an essential part of economic progress in any country, not only for increasing the efficiency of transportation of goods, but the employments generated by building and maintaining them (Sanchez et al., 2008) (Salman, Mathavan, Kamal, & Rahman, 2013). Additionally, the improvement and maintenance of transport infrastructure requires a proper diagnosis of the roads. On its part, Colombia has few statistics on road conditions, and the existing statistics are considered unreliable and inconsistent. Table 1 shows the current state of Colombian roads in accordance with a technical study performed in 2014. It can be observed that 21.1% of Colombian paved roads are classified as “Very Good”, 34.7% are classified as “Good” and 43.46% are classified as “Regular” or “Bad”.
As observed in Table 1, subjective classifications such as “Good”, “Regular” or “Bad” says little about the real state of roads, and this classification method cannot offer a reference for pavement quality. According to (Sanchez et al., 2008) quality assurance and rehabilitation of paved roads are performed through integral pavement evaluation, which includes studies such as quantification and classification of surface distress, computing the IFI (International Friction Index), the IRI (International Roughness Index), and performing geotechnical and deflectometrical studies.
This work focuses on computing the thickness of the pavement, which is a structural requirement of pavement evaluation. According to the Colombian Transport Ministry, there are two kind of techniques used to estimate pavement thickness:
Invasive methods: core extraction (Figure 1a) and pavement holes (Figure 1b). The implementation of these methods is easy; according to (Sanchez et al., 2008), it is normal to do the core extraction and digging holes before and after of pavement rehabilitation, the first to evaluate the pavement state, and the second for quality assurance purposes. However, the structural pavement integrity is affected, and they do not show a continuous profile of pavement thickness.
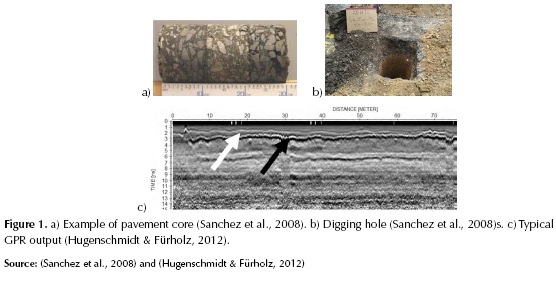
Non-invasive methods: using a GPR (Geo Penetrating Radar) involves some advantages since it is a non-invasive technique and offers a continuous thickness profile of the road and real-time access to data as it can be observed in Figure1c (Evans, Frost, Stonecliffe-Jones, & Dixon, 2008) (Pajewski et al., 2013). However, GPR equipment is expensive (approximately US$ 60.000 each (GSSI, 2013b)), and it requires trained Engineers to interpret data (Pajewski et al., 2013). Additionally, a GPR system requires different type of antennas at different bandwidth in order to reach diverse depths (GSSI, 2013a), which increases the costs.
Non-invasive methods as GPR are not economically feasible options in most road rehabilitation projects in Colombia. For this reason, this work proposes an alternative for local estimation of the thickness of pavement and base layers by image-processing techniques. The proposed method improves the core extraction method in the following aspects: In first place, it requires a small hole of 1 inch diameter, and up 90 cm in length to insert a video-scope, reducing the damage of the asphalt layers; second, the road mobility is barely affected, since machinery involved has small dimensions; and it does not require an specialized engineer to interpret the information acquired.
The remainder of this paper consist of: Section 1 makes a brief description of the related works on image-processing methods for texture segmentation. The section 2 presents the system E2CAV to estimate the thickness of the pavement; and it includes the texture-segmentation image-processing algorithm, the movement control unit, and the software tool developed to consolidate data. Section 3 shows the tests and results. And Section 4 shows the conclusions of the research.
RELATED WORKS
Textured region in an image shows constant, periodically changing, or gradually changing image properties. Figure 1a shows an example of pavement core, and it can be observed that different textures are involved in each layer. The human eye can easily identify these textures and their interfaces, but it is difficult to define an accurate mathematical model to implement a texture-segmentation task. Texture-segmentation is a challenging problem because textures can consist of complex patterns or sub-patterns where brightness, color, shape, and size properties change simultaneously. Another challenging aspect of our approach is the poor illumination; since the video-scope inserted in the hole has power limitations, it increases the complexity in the process.
Table 2 shows different methods for texture-segmentation and some of their properties (number of kernels used, signal-to-noise ratio, need of classifier, and if the method is able to describe the full image). The following five approaches of texture segmentation methods can be found in literature: statistical- or transform-based, edges or contour methods, threshold-based methods, clustering- and graph-based methods.
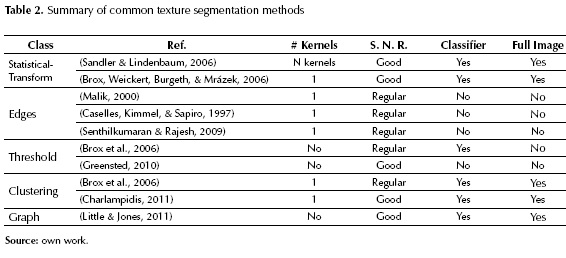
Computing edges or contours is the most straightforward approach to segment images with textures, and the most common methods are derivative filter, Kirsch filters (Senthilkumaran & Rajesh, 2009), and geodesic active contours (Caselles et al., 1997). However, these methods have moderate behaviour of signal-to-noise ratio due to illumination sensitivity.
Threshold-based approach is another example. It is usually computed with histograms, pixel clustering, object properties or attributes, morphological operators, or local methods (Sezgin & Sankur, 2004). In particular, the Otsu method (Otsu, 1979) shows good signal-to-noise ratio despite the fact this method do not use kernels nor describe the full image. In fact, the Otsu approach is useful when global operators are required (Socorras, Gomez, & Obregon, 2014) due to the iterative process to find the threshold value (Otsu, 1979). On the other hand, using methods based on transformations or statistics works for detecting textures on images. For instance, a popular and accurate technique is Gabor filters (Sandler & Lindenbaum, 2006). These filters use different kernels tuned by specific parameters, corresponding to specific applications (Aldana, Orozco, & Barreto, 2014). Gabor filters or structure tensor (Brox et al., 2006) are designed to give high response at edges or regions where there is a change of texture.
Texture-segmentation methods focus on finding or modelling patterns on images without considering color properties. Clustering methods such as (Charlampidis, 2011) and (Little & Jones, 2011) use modified k-means and mean-shift algorithms to segment images. Normally these methods search nodes or local maximums in feature space (color, gradients, moments, etc.); therefore, the entire image can be segmented and classified. However, the results of these methods vary depending on the window size selected, and they depend on feature space size. Another implementation is modelling the images as graphs (Malik, 2000), where nodes are pixels related by affinity weights as edges. In this case, affinity weights define a relationship of similarity. This implementation groups the pixels according to similarity or dissimilarity measures, so they do not require a data model, and time complexity is usually high.
Texture-segmentation techniques perform tests on artificial images, and some have complex patterns; additionally, these images show good illumination conditions and are noise-free. However, in this work, the proposed pipeline process can deal with real world images acquired in non-structured environments, in presence of regular illumination conditions and noise, so this work considers different methods in stages such as image acquisition, pre-processing and thickness estimation.
METHODOLOGY
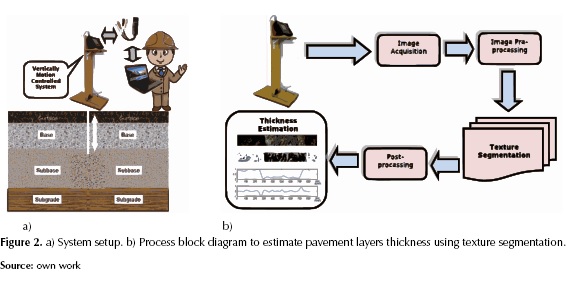
Figure 2a shows the setup of the system, and describes the main components of the E2CAV system. A hole of 1 inch diameter and up 90 cm length is drilled; a vertical movement control unit introduces the video-scope probe into the hole at configured steps of depth; the software tool runs in a laptop and is in charge of handling the vertical movement control unit and obtaining the images through the EasyCap USB video capture device. Once these images are obtained (with a size 640x480 pixels), the software tool starts the image-analysis process. The video-scope is an Extech HDV620 that has a PAL/NTSC analogue video output; and the vertical motion control unit is a custom design that uses an Arduino™ UNO development board and an electronically interface to handle the descending and ascending movement of the video-scope probe. All the process is detailed in the following sub-sections.
Estimation of the thickness of the pavement using image texture operators
Figure 2b shows the block diagram of the proposed system E2CAV to estimate the thickness of the pavement. The first stage is responsible for the image acquisition using a video-scope and a custom control movement unit, so K sequential images are obtained. The second stage, image pre-processing, sets up a mosaic using these K images and improves the mosaic for further processing. The third stage is responsible of the texture-segmentation using either Otsu (1979) or Gabor filters (Sandler & Lindenbaum, 2006). The fourth stage processes the results of the third stage and computes the thickness of the pavement.
Data Acquisition and Pre-processing
There are three important parts involved in the data acquisition process: the laptop, the vertical movement control system, and the Extech HDV620 video-scope. The laptop runs the software responsible of managing the vertical movement control system and capturing the images from the Extech HDV620 video-scope through an EasyCap USB video capture device. In the next sections of this paper there are more details on the software. The vertical movement control system is programmed to perform discrete motions into a hole of 1’’. Each motion step was computed considering equation (1).
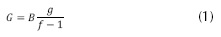
Where g is the distance to the object (25mm), f stands for the calibrated focal length (15mm) and B denotes the sensor size (1/3’’), so G is the current object size (15.11mm). At each G-step one image of 640 by 480 pixels is obtained from the HDV620 video-scope. In order to correct the camera distortion, the video-scope camera was previously calibrated using (Bouguet, 2013). Another calibration parameter worth considering is the pixel to distance ratio (Gonzales & Woods, 2007).
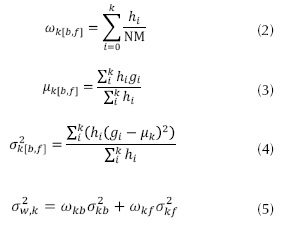
Each image is joined with the next one to build a mosaic of 1321x160 pixels, and it is converted to gray scale (an example of this kind of image is shown in Figure 3). Most pavement-layers images are very noisy with high frequency components present, so a mean filter (with a slip window 5x20 pixels) is used on the mosaic image to smooth its appearance.
Texture Segmentation
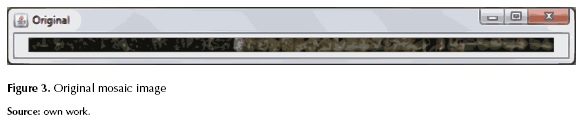
In this work, the segmentation of textures was developed with the Otsu threshold method and Gabor filters. The following are the basic steps for the implemented Otsu algorithm: the mosaic image histogram is computed using L gray levels; for each gray level, the equations (2) to (5) help to compute the weight, mean and variance of the background and foreground, and the within class.
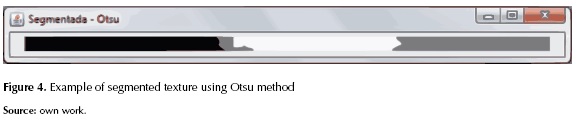
Where hi is the histogram bin value, N denotes the image number of rows, M stands for the image number of columns, gi denotes the gray level and [b, f] stands for background and foreground. The threshold with the lowest sum of weighted inter-class variances is selected. In case of being interested in more than one threshold, they are selected in turn according to the computed inter-class variances. In this particular case, the number of thresholds to compute is 2. Figure 4 shows the result of applying the Otsu method in the mosaic of Figure 3 to obtain a segmented texture.
The second method available in the software tool for texture segmentation is Gabor filters. These filters are special cases of band pass filters, so they are commonly used in edge detection, stereo images disparity estimation and feature extraction (Zhang, Tan, & Ma, 2002). In this work, the Gabor filter used is defined in equation (6).

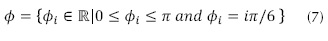
Where x and y stand for the pixel coordinates, g denotes the spatial aspect ratio, s denotes the standard deviation of the Gaussian function, l stands for the wavelength of the sinusoidal factor and f denotes the phase offset. Gabor filters are parameterized using 4 variables namely g, s, l and f. According with (Salman et al., 2013) and (Zhang et al., 2002) the phase offset f is divided in six different angles between 0 and p as depicted in equation (7).
The wavelength of the sinusoidal factor l depends on the image number of columns (Zhang et al., 2002) since it has a direct relationship with the frequency domain. Then, different cut-off frequencies are selected according to equation (8).
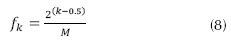
Where M is the image number of columns and  .
.
The frequencies described in equation (8) are used to define a range of frequencies described in equation (9).
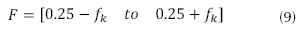
With the range of frequencies, the wavelength values are defined as the inverse of each frequency value of equation (9). That is,  . In (Sandler & Lindenbaum, 2006) and (Zhang et al., 2002), the authors propose a relationship between s and l which is described in equation (10).
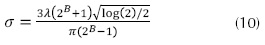
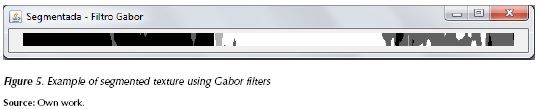
Where B denotes the spatial-frequency bandwidth and is specified in octaves and its current value is 1. Therefore, considering all the plausible values of g s, l and f, and the image specifications at the end, the resulting number of Gabor filters is 96. The kernel size depends on the s parameter (Gonzalez & Woods, 2007); in this work it varies between 9x9 and 3x3. Figure 5 shows an example of the segmented texture obtained by applying the Gabor filter in the mosaic shown in Figure 3.
Post-processing and Thickness Estimation
Once the texture segmentation stage ends, the results using Gabor filters require one further processing step. The K-means clustering (MacQueen, 1967) is applied to all resulting pixels of the segmented textures. A well-known disadvantage of k-means clustering is related to the number of clusters, which must be known in advance. However, in this application the number of clusters is known: all tests were performed using 2 clusters (pavement layer and base layer) because those are the only layers available when working at 90cm depth. The clustered pixels are painted using different gray levels in order to start the process of estimating the thickness.
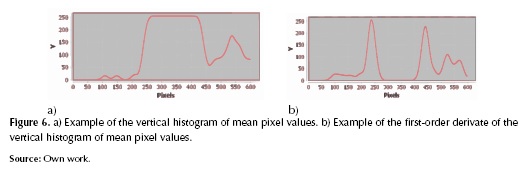
Henceforth, the vertical histogram of mean pixel values is computed to obtain the resulting images from both segmentation methods (Otsu and Gabor filter). It results in a 1D signal where peaks or inflection points are putative locations of pavement layers interfaces (Figure 6a). In order to identify the location of these interfaces of pavement layers, a first-order derivate is taken of the vertical histogram of mean pixel values. Afterwards, the peak values of this signal show the position of the interfaces (shown in Figure 6b). The position of the interfaces of pavement layer is given in pixels. Finally, to transform this information to metric values, the motion step given in equation (1) and the pixel to distance ratio were used to finally estimate the thickness of the pavement layers.
Vertical movement control unit
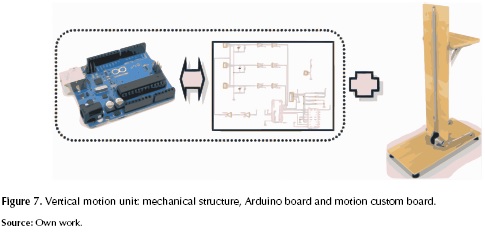
Figure 7 shows the vertical movement unit, which is used in the E2CAV system to descend the video-scope probe through a hole of 1-inch diameter. This unit is composed of the mechanical structure, the Arduino™ board, and a custom motion board to drive the DC motor. The mechanical structure was designed to facilitate transport, and it was built to support a descending/ascending tube, the video-scope, and the control electronic elements. A geared DC motor with torque of 18Kg cm, and 80 RPMs performs the descending/ascending motion. This DC motor supports 2 incremental encoders in quadrature of 520 ticks per revolution. Finally, the Arduino and the motion boards control the descending/ascending movement considering the following requirements: setting the descending/ascending distance and speed, moving the video-scope probe to its initial position (top), starting the descending motion, pausing the descending motion, resuming the descending motion, and handshaking any motion/configuration command sent by the laptop GUI.
Software tool
The texture-based estimation process of the thickness of pavement layers proposed in this work was automated using a graphical user interface. The Rational Unified Process (RUP) methodology (Kruchten, 2003) was used to develop this software. This methodology involves 4 stages for software development: inception, elaboration, construction and transition. The results of these 4 stages include functional and non-functional requirements, a diagram of concept, real use cases, sequential diagrams, design-class diagrams, source code, and functional/integration tests. However, due to space requirements, in this work only the functional and non-functional requirements, the diagram of concept and the GUI description were included.
Design Requirements and Diagram of Concept
The proposed system is composed of two main parts: a software tool to manage and perform the digital image processing, and a vertical movement control system. The first implements the block diagram shown in Figure 2b and runs into a Laptop. The second manage the structure shown in Figure 2a. The following are the functional and non-functional requirements of the E2CAV system software proposed in this work:
Functional Requirements-Calibration module: To allow the video-scope camera calibration; to allow the video-scope camera pixel/distance ratio calibration; to save and restore the calibration results. Configuration Module: to allow the configuration of the number of images at each step of the video-scope probe desclining; to allow the configuration of the desclining distance; to allow the configuration of the image parameters; to allow the configuration of the Otsu and Gabor filter parameters; to send the configuration parameters to the vertical movement control system. Image Acquisition and Processing: to control the vertically motion controlled system hardware; to perform the image acquisition process; to build the image mosaic and perform the pre-processing tasks; to apply the texture methods and estimate the thickness of the pavement layers. Report Module: to generate a report in PDF format including the calibration parameters, the configuration parameters, the image mosaic, and the results of the estimation of the thickness of pavement layers.
Non-functional Requirements: Java 1.7, serial port access, minimum memory available of 90Mbytes.
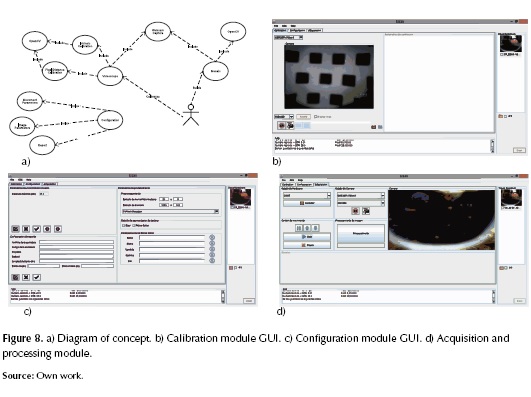
The Figure 8a shows the concept diagram of the E2CAV system. Two main actors are identified: the user and the vertical movement control system hardware. Users are able to calibrates/configure the video-scope for image acquisition; to control the vertical motion controlled system; to build the image mosaic, which implicitly implies the acquisition of various frames from the video-scope camera; and the estimation of the thickness of pavement layers using the Otsu and Gabor filter methods. The vertical movement control system was designed to operate using configuration, commands and feedback responses. The calibration/configuration of video-scope camera was implemented using standard OpenCV (OpenCV, 2014) libraries.
Graphical User Interface Description
Figures 8b, 8c and 8d show the user interface of the E2CAV system software, which satisfies the requirements described above. These figures correspond to the calibration, configuration and image acquisition/processing modules, respectively. The order in which these modules are presented is the order in which a normal operation of the E2CAV system software must be operated.
The calibration module shown in Figure 8b includes the following user tools: a visualization panel where the video-scope camera projects its image. A control panel placed at the bottom-left part of the GUI in order to take individual pictures, starting the calibration process, and to rectify the pictures taken using the calibration parameters. These calibration parameters are shown in the text panel at right of the visualization panel. The right side of this interface shows the image workspace, where users can store all images taken up to date.
Figure 8c shows the configuration panel. Four panels can be observed: The motion control parameters are in the upper-left panel, where users can define the descending distance of the vertical motion system, as well as the control buttons to edit, send and clear this parameter from the vertical motion system hardware. The image processing parameters are in the right panel, where the user can select the window size for median filter, the image mosaic size, and the texture methods parameters. The report configuration panel is in the bottom-left part, where there are parameters for inspecting data such as road name, road code, project name, user name, and road length. At the bottom, the user interface uses a text panel to show the E2CAV system software state.
Finally, the Figure 8d shows the acquisition module, which is accessed once the previous modules have been configured. This module of the interface shows seven panels. At the left, two panels are responsible of handling the vertical movement control system; the upper-left panel deals with the hardware connection through a serial port; and the middle-left panel controls functions such as start, stop and pause motion. At the right, three panels cope with the image acquisition, implementing functions such as selecting the video source, configuring the image size, controlling the image trigger, starting the image processing, and observing the current data image. Finally, under these panels, the image mosaic is shown, as well as the resulting thickness of the pavement layers in the log panel.
RESULTS
The developed E2CAV software supports two texture segmentation methods: the Otsu threshold and the Gabor filter. Users can select which one they want to use to process the data. For this reason, the tests performed are divided in two groups: the lab tests, which are oriented to find the level of precision of both texture segmentation methods; and the field tests that focus on testing the E2CAV system software tool in real conditions. The experimental setup is shown in Figure 2a, it was employed in both tests using the following experimental process: first, the E2CAV software tool is connected with the vertical movement control unit, and the Extech video-scope; second, if the camera video-scope or the pixel/distance ratio are not calibrated, users can do so using the E2CAV software; third, the vertical motion unit is programmed, then the image acquisition process starts and all images are sent to the laptop using the EasyCap video converter; fourth, the E2CAV software processes all the images and it gives the resulting thickness of the layer.
Lab tests
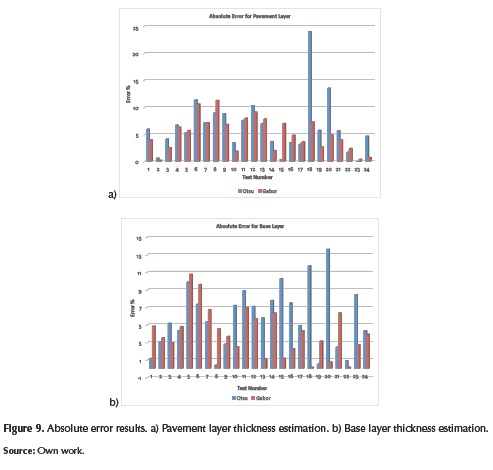
The experimental process was repeated twenty four times using cores extracted from pavements. It is worth noting that both calibration procedures are required once, and the results of them are stored for further use. In order to compute the measurement error of the estimated thickness of the pavement layers, the assumed ground truth was the metric measure of those layers performed on the pavement cores.
Figures 9a and 9b show the absolute errors for the pavement and base layers. Both figures consider the Otsu (sloping lines) and Gabor filter (horizontal lines) methods. In average, the results show an error of pavement layer thickness estimation of 6.405% ±5.03, and 5.07% ±3 for the Otsu and Gabor filter, respectively; an error of base layer thickness estimation of 5.88% ±3.5, and 4.13% ±2.7 for the Otsu and Gabor filter, respectively. The less the better, so Gabor filters outperforms the Otsu method. However, both methods are prone to errors when illumination changes; even though, Gabor filters were found more robust since they are able to be tuned using different orientations, time and space wavelengths. The Otsu method performed surprisingly well; an explanation of this behaviour could be that it resolves the segmentation problem globally. Another reason why the Gabor filter outperforms the Otsu method is that the latter uses brute force to compute the best threshold, without considering the local relationship in the image textures. On the contrary, the Gabor filter considers not only the local morphology in the image texture, but also their relationship in the frequency domain.
Field tests
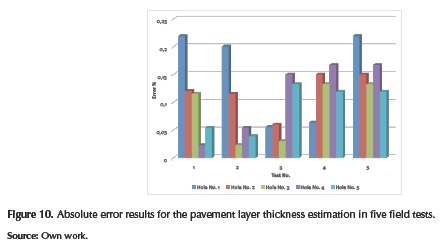
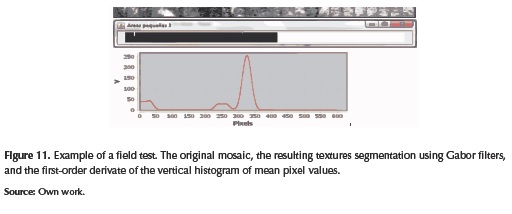
Field tests were performed using 5 holes drilled on a 7.5m segment of paved way into the Universidad del Valle. In order to obtain good results from these tests there were need for three additional considerations: first, the drilled hole must be cleaned before the inspection; second, most of the earth and dust were extracted using pressurized air; third, the drill only could achieved the first paved layer. Figure 10 shows the absolute error results for the thickness of the pavement for the 5 holes drilled; at each hole there were 5 different measures. In average the percentage of thickness error estimation was of 11.3% using Gabor filters. Figure 11 shows images of the intermediate steps of thickness estimation, which were very challenging, that is part of the reason why the Otsu method did not give any successful result in these tests.
CONCLUSIONS
This work presented the E2CAV system to estimate the thickness of the pavement layers using texture-segmentation in images. The proposed method employs the Otsu threshold and Gabor filter approaches. Both approaches were integrated into the E2CAV software, and it was implemented with four main modules: calibration, configuration, image-processing, and report-generation. The aim of the calibration module is computing the intrinsic camera parameters and the pixel/distance ratio; the configuration module sets up the image processing, and the vertical movement unit parameters; the image-processing module is in charge of performing the data acquisition process as well as the estimation of the thickness of the pavement layers; and the report-generation module consolidates the information for documentation purposes. In the E2CAV software, the estimation of the pavement layers can be performed using both the Otsu and the Gabor filters. The Otsu method requires knowing the number of layers present in the image mosaic prior to compute the right thresholds. The Gabor filters were parameterized considering the requirements of this application and the insights proposed in (Salman et al., 2013) and (Zhang et al., 2002). Laboratory and field tests were performed and gave errors of 5.07%, and 11.3% in the estimation of thickness, respectively. Finally, future works focus on improving the mosaic image computation and including pre-processing tools such as bilateral or homomorphic filter.
ACKNOWLEGEMENTS
E2CAV research project (Estimación Local del Espesor de las Capas Asfáltica y Base usando Visión Artificial, Ref: 2796) of the Universidad del Valle was the founding resource for this work.
REFERENCES
Aldana, C., Orozco, N., & Barreto, S. (2014). Identification of multiple sclerosis brain lesions in magnetic resonance imaging using texture analysis. Tecnura, 18, 89-101. doi: http://dx.doi.org/10.14483/udistrital.jour.tecnura.2014.SE1.a07
Bouguet, J.-Y. (2013). Camera Calibration Toolbox for Matlab. California Institute of Technology. Retrieved from http://www.vision.caltech.edu/bouguetj/calib_doc/
Brox, T., Weickert, J., Burgeth, B., & Mrázek, P. (2006). Nonlinear structure tensors. Image and Vision Computing, 24(1), 41-55. doi: 10.1016/j.imavis.2005.09.010
Caselles, V., Kimmel, R., & Sapiro, G. (1997). Geodesic Active Contours. International Journal of Computer Vision, 22(1), 61-79.
Charlampidis, D. (2011). Texture Segmentation Using Iterative K-means. New Orleans: Department of Electrical Engineering, University of New Orleans.
Evans, R., Frost, M., Stonecliffe-Jones, M., & Dixon, N. (2008). A Review of Pavement Assessment Using Ground Penetrating Radar ( GPR ). In 12th International Conference on Ground Penetrating Radar (pp. 2-11). Birmingham, UK.
Gonzales, R., & Woods, R. (2007). Digital Image Processing (3rd Ed.). Prentice Hall. Upper Saddle River, NJ, USA.
Greensted, A. (2010). Otsu-Thresholding. The Lab Book Pages. Retrieved from http://www.labbookpages.co.uk/software/imgProc/otsuThreshold.html
GSSI. (2013a). Ground Penetrating Radar Antennas. Retrieved from http://www.geophysical.com/antennas.htm
GSSI. (2013b). GPR Data Acquisition Unit-SIR30. Retrieved from http://www.geophysical.com/sir30.htm
Hugenschmidt, J., & Fürholz, P. (2012). ATRAS - An automated GPR system for data acquisition and storage for roads and bridges. In 14th International Conference on Ground Penetrating Radar (GPR) (pp. 448-453). Shanghai, China. doi: 10.1109/ICGPR.2012.6254907
INVIAS. (2014). Estado de la Red Vial. Instituto Nacional de Vías. Retrieved June 9, 2015, from http://www.invias.gov.co/index.php/red-vial-nacional/2-uncategorised/57-estado-de-la-red-vial
Kruchten, P. (2003). The Rational Unified Process: An Introduction (3rd ed.). Addison-Wesley Professional. Boston, MA, USA.
Little, M. A., & Jones, N. S. (2011). Generalized methods and solvers for noise removal from piecewise constant signals. I. Background theory. Proceedings. Mathematical, Physical, and Engineering Sciences / the Royal Society, 467(2135), 3088-3114. doi: 10.1098/rspa.2010.0671
MacQueen, J. (1967). Some methods for classification and analysis of multivariate observations. In Proceedings of the Fifth Berkeley Symposium on Mathematical Statistics and Probability, Volume 1: Statistics. The Regents of the University of California.
Malik, J. (2000). Normalized cuts and image segmentation. IEEE Transactions on Pattern Analysis and Machine Intelligence, 22(8), 888-905. doi: 10.1109/34.868688
OpenCV. (2014). OpenCV documentation. OpenCV ORG. Retrieved June 1, 2015, from http://docs.opencv.org/
Otsu, N. (1979). A Threshold Selection Method from Gray-Level Histograms. IEEE Transactions on Systems, Man, and Cybernetics, 9(1), 62-66. doi: 10.1109/TSMC.1979.4310076
Pajewski, L., Benedetto, A., Derobert, X., Giannopoulos, A., Loizos, A., Manacorda, G., ... Trinks, I. (2013). Applications of Ground Penetrating Radar in civil engineering - COST action TU1208. 2013 7th International Workshop on Advanced Ground Penetrating Radar, 1-6. doi: 10.1109/IWAGPR.2013.6601528
Salman, M., Mathavan, S., Kamal, K., & Rahman, M. (2013). Pavement crack detection using the Gabor filter. In 16th International IEEE Conference on Intelligent Transportation Systems (ITSC 2013) (pp. 2039-2044). IEEE. doi: 10.1109/ITSC.2013.6728529
Sanchez, F., Posso, H., Lederman, P., Fernandez, H., Estrada, F., Leguizamo, P., ... Posso, H. (2008). Guía Metodológica para el Diseño de Obras de Rehabilitación de Pavimentos Asfálticos de Carreteras. (M. de Transporte, Ed.) (Segunda.). Bogotá, Colombia: Instituto Nacional de Vías.
Sandler, R., & Lindenbaum, M. (2006). Gabor Filter Analysis for Texture Segmentation. In 2006 Conference on Computer Vision and Pattern Recognition Workshop (CVPRW'06) (pp. 178-178). IEEE. doi: 10.1109/CVPRW.2006.86
Senthilkumaran, N., & Rajesh, R. (2009). Edge Detection Techniques for Image Segmentation - A Survey of Soft Computing Approaches. International Journal of Recent Trends in Engineering (IJRTE), 1(2), 250-254.
Sezgin, M., & Sankur, B. (2004). Survey over image thresholding techniques and quantitative performance evaluation. Journal of Electronic Imaging, 13, 146-168. Retrieved from http://www.researchgate.net/publication/202972407_Survey_over_image_thresholding_techniques_and_quantitative_performance_evaluation
Socorras, V., Gomez, E., & Obregon, N. (2014). Calibración de imágenes de radares meteorológicos. Tecnura, 18(41), 12-26. Retrieved from http://revistas.udistrital.edu.co/ojs/index.php/Tecnura/article/view/7019/8691
Zhang, J., Tan, T., & Ma, L. (2002). Invariant texture segmentation via circular Gabor filters. In Object recognition supported by user interaction for service robots (Vol. 2, pp. 901-904). IEEE Comput. Soc. doi:10.1109/ICPR.2002.1048450
Licencia
Esta licencia permite a otros remezclar, adaptar y desarrollar su trabajo incluso con fines comerciales, siempre que le den crédito y concedan licencias para sus nuevas creaciones bajo los mismos términos. Esta licencia a menudo se compara con las licencias de software libre y de código abierto “copyleft”. Todos los trabajos nuevos basados en el tuyo tendrán la misma licencia, por lo que cualquier derivado también permitirá el uso comercial. Esta es la licencia utilizada por Wikipedia y se recomienda para materiales que se beneficiarían al incorporar contenido de Wikipedia y proyectos con licencias similares.