
DOI:
https://doi.org/10.14483/22487638.17595Publicado:
01-10-2021Número:
Vol. 25 Núm. 70 (2021): Octubre - DiciembreSección:
InvestigaciónAnálisis estadístico de la radiación solar global en Cúcuta utilizando el modelo ANOVA
Statistical Analysis of the Global Solar Radiation in Cúcuta using the ANOVA Model
Palabras clave:
ANOVA, global solar radiation, R Studio, Bonferroni test (en).Palabras clave:
ANOVA, radiación solar global, R Studio, test de Bonferroni (es).Descargas
Referencias
Basha, E., Jurdak, R., & Rus, D. (2015). In-network distributed solar current prediction. ACM Transactions on Sensor Networks, 11(2), 1-28. https://doi.org/10.1145/2629593 DOI: https://doi.org/10.1145/2629593
Chiteka, K., & Enweremadu, C. C. (2016). Prediction of global horizontal solar irradiance in Zimbabwe using artificial neural networks. Journal of Cleaner Production, 135, 701-711. https://doi.org/10.1016/j.jclepro.2016.06.128 DOI: https://doi.org/10.1016/j.jclepro.2016.06.128
Contreras-Sepúlveda, W., Galban-Pineda, M. G., Bustos-Márquez, L. F., Sepúlveda-Mora, S. B., & Ramírez-Mateus, J. J. (2021). Angström-Prescott empirical model to estimate solar radiation in Norte de Santander, Colombia. Revista De Investigación, Desarrollo e Innovación, 11(2), 413–427. https://doi.org/10.19053/20278306.v11.n2.2021.12765 DOI: https://doi.org/10.19053/20278306.v11.n2.2021.12765
Contreras-Sepúlveda, W., Galbán-Pineda, M. G., & Sepúlveda-Mora, S. B. (2018). Análisis estadístico de la radiación solar en la ciudad de Cúcuta. Entre Ciencia e Ingeniería, 12(23), 16. https://doi.org/10.31908/19098367.3698 DOI: https://doi.org/10.31908/19098367.3698
Diagne, M., David, M., Lauret, P., Boland, J., & Schmutz, N. (2013). Review of solar irradiance forecasting methods and a proposition for small-scale insular grids. Renewable and Sustainable Energy Reviews, 27, 65-76. https://doi.org/10.1016/j.rser.2013.06.042 DOI: https://doi.org/10.1016/j.rser.2013.06.042
Eraso-Checa, F., & Escobar-Rosero, E. (2018). Metodología para la determinación de características del viento y evaluación del potencial de energía eólica en Túquerres-Nariño. Revista Científica, 1(31), 19-31. https://doi.org/10.14483/23448350.12304 DOI: https://doi.org/10.14483/23448350.12304
Gallegos, H. G., Aristegui, R., & Righini, R. (2009). Análisis de la radiación solar global en San Carlos, Salta. Avances en Energías Renovables y Medio Ambiente, 13, 1-6. http://sedici.unlp.edu.ar/handle/10915/98369
Hernández-Mora, J. A., Trujillo-Rodríguez, C. L., & Vallejo-Lozada, W. A. (2013). Modelamiento de la irradiancia y la temperatura ambiente utilizando funciones de probabilidad. Revista Tecnura, 18(39), 128-137. https://doi.org/10.14483/udistrital.jour.tecnura.2014.1.a09 DOI: https://doi.org/10.14483/udistrital.jour.tecnura.2014.1.a09
Hossain, M. S., Rahim, N. A., Aman, M. M., & Selvaraj, J. (2019). Application of ANOVA method to study solar energy for hydrogen production. International Journal of Hydrogen Energy, 44(29), 14571-14579. https://doi.org/10.1016/j.ijhydene.2019.04.028 DOI: https://doi.org/10.1016/j.ijhydene.2019.04.028
Hurtado-Moreno, G., & González, O. C. (2011). Evaluación de la afectación territorial de los fenómenos El Niño/La Niña y análisis de la confiabilidad de la predicción climática basada en la presencia de un evento. http://www.ideam.gov.co/documents/21021/440517/Evaluación+de+la+Afectación+Territorial.pdf
Instituto de Hidrología Meteorología y Estudios Ambientales (IDEAM) (2015). Aspectos teóricos del Atlas. Atlas de Radiación Solar, Ultravioleta y Ozono de Colombia - Iteractivo. http://atlas.ideam.gov.co/visorAtlasRadiacion.html
Leal-González, F. A., & Hernández Cely, M. M. (2013). Estudio del potencial eólico y solar de Cúcuta, Norte De Santander. Revista Colombiana de Tecnologías de Avanzada, 2(22), 27-33. https://doi.org/10.24054/16927257.v22.n22.2013.407
Markvart, T. (2000). Solar Electricity. John Wiley & Sons.
Mejía-Calderón, L. A., Mosquera-Ramírez, J., & Betancourth-Rojas, J. S. (2017). Síntesis dimensional de un mecanismo esférico para la orientación de paneles solares. Entre Ciencia e Ingeniería, 11(22), 43-50. https://doi.org/10.31908/19098367.3548 DOI: https://doi.org/10.31908/19098367.3548
Mihailov, N., & Stoyanov, I. (2009, July 1-3). Statistical evaluation of the daily, monthly and yearly solar radiation [Conference presentation]. 8th International Symposium on Advanced Electromechanical Motion Systems and Electric Drives Joint Symposium, ELECTROMOTION, Lille, France. https://doi.org/10.1109/ELECTROMOTION.2009.5259149 DOI: https://doi.org/10.1109/ELECTROMOTION.2009.5259149
Navidi, W. (2006). Estadística para ingenieros y científicos. Mc-Graw Hill.
Perpiñán-Lamigueiro, O. (2020). Energía Solar Fotovoltaica. Creative Commons. https://oscarperpinan.github.io/esf/ESF.pdf
Rodríguez-Patarroyo, D. J., Hernández, J., & Simbaqueva, O. (2015). Análisis estadístico del Índice de Claridad atmosférica para la ciudad de Bogotá. Revista Científica, 1(21), 65-70. https://doi.org/10.14483/udistrital.jour.rc.2015.21.a6 DOI: https://doi.org/10.14483/udistrital.jour.RC.2015.21.a6
Ruiz-Cárdenas, L. C., Amaya-Hurtado, D., & Jiménez-Moreno, R. (2016). Predicción de radiación solar mediante deep belief network. Revista Tecnura, 20(47), 39-48. https://doi.org/10.14483/udistrital.jour.tecnura.2016.1.a03 DOI: https://doi.org/10.14483/udistrital.jour.tecnura.2016.1.a03
Cómo citar
APA
ACM
ACS
ABNT
Chicago
Harvard
IEEE
MLA
Turabian
Vancouver
Descargar cita
Recibido: 13 de febrero de 2021; Aceptado: 6 de julio de 2021
ABSTRACT
Objective:
This paper presents a statistical analysis of solar radiation in the city of Cúcuta, aiming to provide a detailed description of its variability between 2005 and 2015. This information represents an assessment tool to study the solar potential of the region for photovoltaic system design, motivated by the need to improve the cost-effectiveness of this technology, and thus increase its penetration in the Colombian electric grid.
Methodology:
Three weather databases with hourly data were studied, from which the one with the largest amount of data available was selected. By means of the R Studio software, two types of statistical methods were executed: single factor variance analysis (ANOVA) and Bonferroni test. From this, graphs representing the statistical summary of solar radiation values in the last decade were obtained.
Results:
The ANOVA showed a p-value of 6,28x10⁻⁷, indicating that there is a statistically significant difference in the sample mean between the different years of study. Likewise, the years and months with the greatest deviation and the possible causes for the variability of this parameter were identified.
Conclusions:
Despite showing a stable behavior, the radiation of the city of Cúcuta requires a very specific analysis for its use in applications that need a high sensitivity in the handling of this information, since there are statistically significant variations that can occur for its use.
Funding:
Universidad Francisco de Paula Santander
Keywords:
ANOVA, global solar radiation, R Studio, Bonferroni test.RESUMEN
Objetivo:
Esta investigación presenta un análisis estadístico de la radiación solar en la ciudad de Cúcuta, con el objetivo de brindar una descripción detallada de su variabilidad entre los años 2005 y 2015. Esta información representa una herramienta evaluativa en el estudio del potencial solar de la región para el diseño de sistemas fotovoltaicos, partiendo de la necesidad de mejorar la relación costo/beneficio de esta tecnología, y así incrementar su penetración en la matriz eléctrica colombiana.
Metodología:
Se realizó un estudio de tres bases de datos climatológicas con información horaria, seleccionando aquella con la mayor cantidad de datos disponibles. Por medio del software R Studio, se ejecutaron dos tipos de métodos estadísticos: análisis de la varianza de un solo factor (ANOVA) y test de Bonferroni. A partir de esto, se obtuvieron gráficas que representan el resumen estadístico de los valores de radiación solar en la última década.
Resultados:
El análisis ANOVA arrojó un valor p de 6,28x10⁻⁷, indicando que existe una diferencia estadísticamente significativa de la media muestral entre los diferentes años de estudio. Asimismo, se identificaron los años y meses con mayor desviación y las posibles causas de la variabilidad de este parámetro.
Conclusiones:
A pesar de tener un comportamiento estable, la radiación de la ciudad de Cúcuta requiere de un análisis muy específico para su uso en aplicaciones que necesiten una alta sensibilidad en el manejo de esta información, ya que hay variaciones estadísticamente significativas que se pueden presentar para su uso.
Financiamiento:
Universidad Francisco de Paula Santander.
Palabras clave:
ANOVA, radiación solar global, R Studio, test de Bonferroni.INTRODUCTION
The sun is the main source of light and heat for planet Earth. This celestial body generates a constant flow of energy known as solar radiation, which is defined as the radiant energy coming from the sun as electromagnetic waves that propagate in all directions and determine the dynamics of atmospheric processes, as well as the climate on Earth. The incident power of solar radiation per unit area is the solar irradiance with SI unit of Wh/m2 (IDEAM, 2015; Markvart, 2000).
Solar energy is one of the mainstream sources of renewable energy in the world due to its great abundance and its positive impact on the environment. Thanks to its simplicity, it has become the most attractive alternative to provide electricity in areas of difficult access where large conventional grids do not have coverage (Mejía-Calderón et al., 2017). Thus, quantifying the potential of renewable resources, in this case solar energy, is essential to properly size photovoltaic systems that transform irradiance into electricity or for thermal applications that convert irradiance into useful heat (Perpiñán-Lamigueiro, 2020).
An increasing number of studies have tried to identify the importance of accurately characterizing solar information for photovoltaic system design. For instance, Diagne et al. (2013) present a review of forecasting techniques for solar irradiance including statistical approaches based on cloud images and numerical weather prediction models. Basha et al., (2015) proposed an algorithmic model to predict solar radiation using multiple linear regression. The input parameters of their model were local weather conditions, and the output was solar irradiance.
In another study, Ruiz-Cárdenas et al. (2016) used a Deep Belief Network (DBN) to predict solar radiation. This type of machine learning model improves computation time and requires less training epochs; with it, the authors achieved error values near 2%.
Mihailov and Stoyanov (2009) performed a statistical analysis of solar radiation levels based on a stochastic process, in order to determine whether the city of Rousse, Bulgaria, has optimal conditions for the deployment of hybrid photovoltaic systems. They found that the solar potential is significant and concluded that the maximum levels of irradiance occur between May and June.
Some authors have developed statistical models to assess and identify the variable inputs relevant for predicting the energy output of photovoltaic systems. For instance, Hernández-Mora et al. (2013) used statistical functions of probability densities to characterize irradiance and ambient temperature through real on-field measurements. Likewise, Rodríguez-Patarroyo et al. (2015) installed a pyranometer to conduct a detailed analysis of the behavior of solar radiation based on in situ measurements of Bogotá. Then, they performed a statistical analysis of the atmospheric clearness index.
In Túquerres, Nariño, Colombia, Eraso-Checa and Escobar-Rosero (2018) conducted a statistical analysis to find out the wind energy potential by measuring wind speed. They modeled the electric generation curve in that region. This case is similar to our work, but with another kind of renewable energy technology.
Finally, in the study conducted by Gallegos et al. (2009), an analysis of solar radiation was performed to estimate the solar resource in different zones of Argentina through the use of charts with the spatial-temporal distribution of irradiance. The authors identified the San Carlos region as the most appropriate for the use of photovoltaic solar systems.
In this sense, worldwide research on this issue has begun to arouse interest in applying this type of studies in the city of Cúcuta, Colombia, which, according to historical records seems to have very high levels of solar radiation throughout the year, thus making it suitable for the deployment of small-, medium-, and large-scale photovoltaic projects.
A descriptive statistical study of the solar radiation in the city of Cúcuta was carried out to analyze the behavior of this variable. Monthly and annual irradiance plots, together with statistical diagrams, helped the authors to calculate an average of 5,335 sun peak hours (Contreras-Sepúlveda et al., 2018). In a subsequent work, the authors proposed an empirical model to estimate solar radiation in the same region using an empirical model with sunshine duration as input (Contreras-Sepúlveda et al., 2021). Similarly, Leal-González and Hernández-Cely (2013) studied the solar potential for power generation in the city of Cúcuta. They determined the months of the year with higher and lower potential and suggested installation methods for photovoltaic systems.
Consequently, the adequate characterization of solar resources aids in the proper sizing of photovoltaic systems that use irradiance as energy input. In turn, this allows more accurate designs, better system performance, and an improved bankability of this type of systems. For these reasons, an inferential statistical analysis of solar radiation historic data can provide insightful information on the behavior of this variable in the future. Additionally, it aids in identifying the factors that influence the fluctuation, and it serves as a tool to define the criteria for using solar radiation data on photovoltaic or thermal solar systems for a specific region. This research aims not only to determine the solar potential and spatial-temporal characteristics of irradiance, but also to analyze their variability over the years in the city of Cúcuta (Norte de Santander, Colombia) in order to evaluate its applicability in the design of photovoltaic systems. The data set used in this work corresponds to available measured data between 2005 and 2015 of global solar radiation for Cúcuta.
This paper is organized as follows: after the introduction, section 2 describes the methodology we used in the statistical analysis, which includes a one-way ANOVA to identify whether there are any significant differences between the mean value of irradiance across different years. This type of analysis allows us to determine if there is a difference between the average values among a categorical factor or a treatment (Hossain et al., 2019). Additionally, we conducted a Bonferroni test to pinpoint which years had the largest difference, as well as to complement the ANOVA analysis. Then, in section 3, the results are presented in tables and charts, along with insights about each finding. Finally, in section 4, we draw conclusions from the results and deduct possible reasons to explain the observed variability.
METHODOLOGY
Cúcuta is one of the 32 capital cities in Colombia. Due to its proximity to the equator, it is not subject to climatological seasons throughout the year. Thus, the environmental conditions are very stable all the time. Based on that, climatological variables, such as solar radiation, which has a high intensity in this region, are considered to be relatively constant on average year after year. For this reason, in the design of solar energy systems for this region, average values of solar radiation are typically used, without the need of long or complex preliminary studies about this variable.
The main motivation of this work, similar to other studies around the world, is to obtain an accurate characterization of solar radiation, specifically for the city of Cúcuta, to determine whether assuming a constant value for system designs is reasonable or not and then have a better criterion to design and deploy solar energy systems in the region.
Regarding the above, we seek to accept or reject the hypothesis that the mean value of global solar radiation is constant throughout the years in Cúcuta. Thereupon, we define the null hypothesis (Ho) as the assumption that all years from 2005 to 2015 have the same average value of solar radiation. To that end, this work is structured in two stages: firstly, we carefully analyze three databases containing solar radiation available data of solar radiation for Cúcuta. Secondly, we conduct a one-way Analysis of Variance (ANOVA) and Bonferroni test using R Studio software, where the variable under consideration is solar radiation.
In the first part of this analysis, we identified three databases with historic records of global solar radiation for Cúcuta. One of them comes from the Colombian Institute of Hydrology, Meteorology, and Environmental Studies (IDEAM). The other two are freely available international databases, provided by the National Aeronautics and Space Administration (NASA) from the United States and the Joint Research Centre (JCR) of the European Commission through their Photovoltaic Geographical Information System (PVGIS).
The IDEAM and PVGIS databases provide solar radiation information in watts per square meter (W/m2) per hour. However, the data from NASA contain the cumulative sum of solar radiation given in watt per square meter (W/m2) per day. Considering that IDEAM is a Colombian government institution and the data from that database comes from on-site sensors, this information is prioritized in this study. Nevertheless, as it will be described in the results section, a large fraction of data from IDEAM is missing, and there are data points outside the solar radiation normal range. Hence, the data from IDEAM are not reliable enough to conduct the proposed analysis.
Accordingly, the purpose of this part of the analysis is to find out how accurate the data from NASA and PVGIS are with respect to the IDEAM data. To that end, after cleaning and organizing all the data, we synchronized all databases with the goal of having them within the same time periods.
Once the database was selected, we proceeded to perform the ANOVA statistical analysis. This is an inferential statistical model that consists of evaluating the behavior of a variable through hypothesis testing by means of the data variance across different categorical groups or treatments. The goal is to find out whether there is a difference between the mean values according to a categorical factor (Hossain et al., 2019). In this study, the variable under consideration is global solar radiation in Cúcuta (7°53'38,08"N latitude and 72°30'28,15"W longitude) for a time span of 10 years (from 2005 to 2015).
Finally, as mentioned before, in order to perform a detailed analysis of the ANOVA results, we used the Bonferroni test. To this effect, we adjusted a new alpha value (a’), where the new alpha is calculated by dividing the initial one (0,05) by the number of possible pairs that could be made among the treatments, which are the years in our case (Navidi, 2006). Using R Studio, we performed multiple t-tests on all possible pairs of treatments, aiming to find the most significant difference among the years under study.
In the first step of the preliminary database analysis, we used two software packages: first, Microsoft Excel (2016) to do some data manipulation and plot some statistical metrics; and second, Matlab (version 8.6.0.267246 - R2015b) for data cleaning and the calculation of coefficients and statistical errors. For the second step involving the ANOVA and Bonferroni test, we used R Studio (version 1.1.463 © 2009-2018 RStudio, Inc.).
RESULTS
Similarity analysis
Solar radiation data were selected for a period of 10 years. Once we had the information from the three databases, we compared them to verify the quantity of datapoints available. The results are shown in Figure 1, where the three sources of information are compared according to the number of days per year when data is available. In this Figure, 365 days of data are equivalent to 100%.
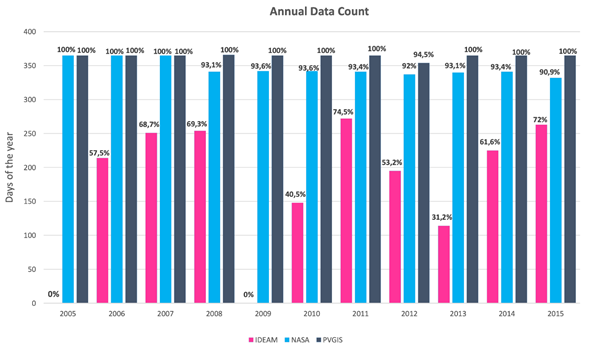
Figure 1: Data count per year in all databases
As seen in Figure 1, the amount of information from the IDEAM database is scarce in comparison with NASA and PVGIS. In 2005 and 2009, there is a complete absence of data from IDEAM. Therefore, using these years would negatively affect the accuracy of the statistical analysis.
Based on the above, the purpose of the first analysis is to identify how accurate the data from NASA and PVGIS are compared to the available IDEAM data. The idea is to validate which external database (NASA or PVGIS) is more reliable for further analysis. Since the data from PVGIS is 100% complete for all years except 2012, we will exclude that year from subsequent analyses.
The similarity analysis among databases consists of calculating statistical coefficients and errors to validate the information. The results of this analysis are listed in Table 1.
Source: Authors
Table 1: Coefficients and statistical errors
Statistical error
IDEAM-NASA
IDEAM-PVGIS
Correlation Coefficient
0,64315719
0,846947483
R2
0,4486
0,7299
RMSE
1425,3 W/m2
770,64 W/m2
MAPE
23,12%
12,63%
MBE
13,45%
1,31%
The correlation coefficient indicates the linear association level between two quantitative variables. From Table 1, the correlation coefficient between IDEAM and NASA is moderate, while the correlation coefficient between IDEAM and PVGIS shows a strong linear relationship. R2 can be interpreted as the percentage of variability in the dependent variable that is explained by the independent variable, which is about 45% for NASA and 73% for PVGIS. The Root Mean Square Error (RMSE) indicates the spread level between the predicted and the actual values. The lower the RMSE, the better the model for predicting the variable of interest. The RMSE for PVGIS is almost half the NASA value. The Mean Absolute Percentage Error (MAPE) measures the accuracy of the model as a percentage using the average difference between the true (IDEAM) and the predicted (NASA and PVGIS) values (Chiteka & Enweremadu, 2016). PVGIS has a MAPE that is more than 10 percentage points lower than that of NASA. Finally, the Mean Bias Error (MBE) represents a systematic error where negative errors cancel out with positive error, so it is typically lower than other error metrics. Remarkably, the MBE for PVGIS is more than 10 times lower than that of NASA.
The results presented in Table 1 indicate that the PVGIS database is significantly closer to the data from IDEAM, with R2 = 0,73. Compared to NASA, PVGIS yields better results not only in the correlation coefficients, but also in all the statistical errors. Based on this, we selected PVGIS as the database to conduct the subsequent inferential statistical analysis.
One-way Analysis of Variance (ANOVA)
As mentioned before, solar radiation is one of the key parameters to design photovoltaic systems; by having a clear understanding of how this variable behaves, we can avoid over- or under-sizing a solar energy system.
Knowing the variability of global solar radiation for a specific location helps validate whether it is suitable for the generation of photovoltaic solar energy. For this reason, we chose to conduct an ANOVA to evaluate if there is any significant variability of solar radiation in Cúcuta, with the purpose of establishing whether there are behavior patterns for future radiation projections or whether a large amount of data should be grouped together to assess the solar potential that can be harnessed in the following years. Table 2 displays the ANOVA results for all years in general.
Source: Authors
Table 2: Analysis of variance of global solar radiation for all years
ANOVA
df
Sum of Sq
Mean Sq
F value
p value
Factor (YEAR)
9
7,19x10⁷
7,99x10³
5,13
6,28x10⁻⁷
Residuals
3641
5,58x10⁹
1,56x10³
-
-
The parameters listed in Table 2 summarize the results for the ANOVA analysis and are discussed below.
√ Factor (YEAR): These are the results of different analysis performed to each year with respect to all other years in the data set.
√ Residuals: This refers to the results of the possible analysis between each year with respect to the means of each one.
√ df: These are degrees of freedom of the model, defined in Equations (1) and (2), where I are the treatments (years) under analysis, and N is the total number of data points.
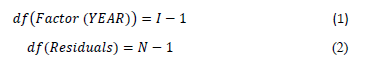
√ Sum of Sq: The total sum of squares refers to the variation of the sample means around the total sample mean, and the sum of the squared error is the difference between the individual sample points around their sample mean according to each treatment.
√ Mean Sq: The mean square of the treatment and the mean square of the error are defined by the coefficient between the total sum of squares of the treatment and Equation (1) and the coefficient between the sum of squared error and Equation (2).
√ F value: It is the quotient between the quadratic mean of the treatment and the square mean of the error. This value indicates whether the null hypothesis can be accepted or rejected. When Ho is true, the numerator and denominator of F are, on average, of the same size, so that F tends to be close to 1 (Navidi, 2006).
√ p-value: It is the probability that defines whether Ho will be accepted or rejected. If p is lower or equal to alpha (0,05), Ho is rejected. Therefore, a p value of 6,28x10⁻⁷ means that the global solar radiation has changed during the time span under consideration. An F value greater than one and a p value much lower than 0,05 demonstrates that at least one of the means of the treatments is different than the others, which means that the null hypothesis is rejected.
Considering that the first conclusion from the ANOVA analysis was that there is a statistically significant difference in the average solar radiation for at least one of the ten years under study, we proceeded to evaluate the effect on individual years. The individual differences can be observed in the boxplots presented in Figure 2. Other than the distribution, outliers, and quartiles, the boxplots in Figure 2 also include the mean for each year as red diamonds. To quantify solar radiation over a day, it needs to be integrated over time, thus resulting in the solar irradiation, which is given in watt-hours per square meter (Wh/m2) as shown in the y-axis of Figure 2.
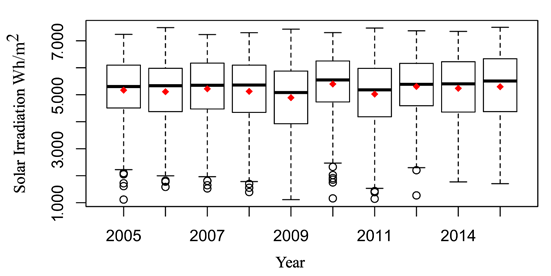
Figure 2: Summary of solar irradiation in Cúcuta from 2005 to 2015
In Figure 2, we can see that solar irradiation remains relatively constant except for three years. The lowest mean values correspond to years 2009 and 2011 while the highest mean value occurred in 2010. The inter-quartile range (boxes containing 50% of data points) is also relatively constant throughout the decade under consideration. For all years, the mean is slightly below the median, thus indicating that the data is left-skewed.
Moreover, Figure 3 shows the average sun peak hours (equivalent to solar irradiation per day) for each year under consideration.
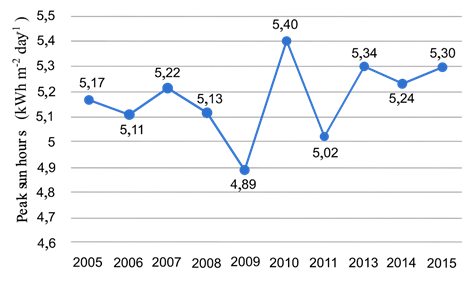
Figure 3: Average annual sun peak hours in Cúcuta from 2005 to 2015
The differences in solar radiation (as well as sun peak hours) are much clearer and evident in Figure 3. The lowest solar irradiation corresponds to 2009, and the largest one to 2010. No other year has an abrupt change with respect to the others.
Bonferroni test
Although Figures 3 and 4 show clear, significant differences between the mean values of solar irradiation and sun peak hours of some years for the city of Cúcuta (thus supporting the findings from the ANOVA), we conducted the Bonferroni test to find out what years had a statistically significant p-value using the adjusted alpha (α’) in Equation (3).
Where α’ is the quotient between the nominal alpha (pre-established at 0,05) and the number of possible pairs among the treatments m (Navidi, 2006). With the new adjusted alpha, a hypothesis test was conducted to identify if there were probability values less than the adjusted alpha and, if so, to reject Ho.
The shadowed cells in Table 3 are the p-values that are significant (p < α’). Unsurprisingly, most of them correspond to 2009. The lowest p-value (greatest significance) is for the pair 2009-2010 with p = 2x10⁻⁶. This means that the largest difference of means is reported for those years, which is consistent with the boxplots shown in Figure 2.
Source: Authors
Table 3: Bonferroni test results
Bonferroni test
2005
2006
2007
2008
2009
2010
2011
2013
2014
2015
2006
1,000
x
x
x
x
x
x
x
x
x
2007
1,000
1,000
x
x
x
x
x
x
x
x
2008
1,000
1,000
1,000
x
x
x
x
x
x
x
2009
0,117
0,713
0,017
0,500
x
x
x
x
x
x
2010
0,609
0,097
1,000
0,146
2 x10⁻⁶
x
x
x
x
x
2011
1,000
1,000
1,000
1,000
1,000
0,002
x
x
x
x
2013
1,000
1,000
1,000
1,000
0,36 x10⁻³
1,000
0,106
x
x
x
2014
1,000
1,000
1,000
1,000
0,008
1,000
0,918
1,000
1,000
x
2015
1,000
1,000
1,000
1,000
1,000
1,000
1,000
1,000
1,000
1,000
ENSO phenomenon in Colombia
The El Niño-Southern Oscillation (ENSO) is a recurring climate pattern that involves temperature changes in the waters of the Pacific Ocean. El Niño and la Niña are the extreme stages of ENSO.
In 2009, 2010, and 2011 El Niño and La Niña affected most of Colombian territory. The lowest mean value of solar irradiation occurred in 2009, likely due to the fact that, during the first three months of the year, La Niña struck the Andean region (Colombian region where Cúcuta is located), as shown in Table 4.
Table 4: Rainfall percentage in Colombia during 2009
Months
01
02
03
04
05
06
07
08
09
10
11
12
Below normal (<90%)
1
2
1
76
74
25
78
39
97
67
61
69
Normal (90-100)
5
5
8
21
19
24
14
30
2
23
25
17
Above normal (>90%)
93
93
91
4
7
51
7
30
1
9
3
13
Table 4 classifies the months with significant rainfall anomalies as ‘above normal’ or ‘below normal’. The criterion to define if a month is significant or not, is that the affected area was greater or equal to 50% of the total territory of the corresponding region. A cell with a red shadow in Table 4 identifies a month with ‘below normal’ precipitation, whereas a blue shadow represents a month with ‘above normal’ precipitation (Hurtado-Moreno & González, 2011).
The first three months of 2009 show a precipitation greater than 90%. This could have caused a decrease in the average value of solar irradiation, thus yielding values below 3.000 Wh/m2 per day. These very low values are the main factor that influenced 2009 to have the lowest mean value of solar irradiation compared to all other years.
El Niño phenomenon intensified during the first 6 months of 2010, which could have caused a lack of precipitation, which, in turn, could have caused an increase in the sun peak hours. During that period, there are months with median values above 6.000 Wh/m2 per day as seen in Figure 4.
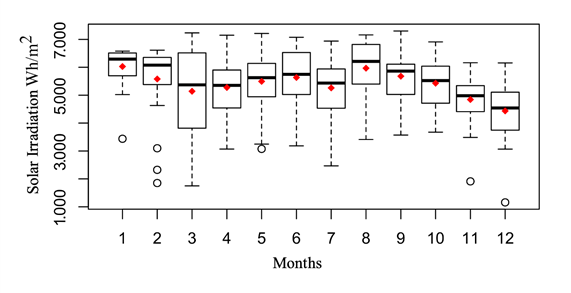
Figure 4: Monthly variability of solar irradiation in Cúcuta for 2010
In the second half of 2010 (Figure 4), there is a decrease in the median and the mean of solar irradiation, likely due to the Niña phenomenon, which affected the mean values of irradiation in 2011 (as seen in Figure 3).
Monthly analysis of solar radiation in Cúcuta
Using the data from PVGIS, we conducted a study of the monthly solar radiation, where each month was subject to an ANOVA analysis, and the F- and p- values were calculated in order to identify which months have significantly different mean solar irradiation values.
The months with the largest differences were January, February, and March. The month with the largest spread was March, denoted by the long inter-quartile range in Figure 4, with a minimum value around 2.000 Wh/m2 and a maximum value above 7.000 Wh/m2. Additionally, September showed the highest single value of irradiation beyond 7.000 Wh/m2 and an average value of 5.917 Wh/m2, and December has the record below 1.200 Wh/m2 and a mean value of 4.653 Wh/m2 per day.
CONCLUSIONS
Solar radiation in the city of Cúcuta, Norte de Santander, Colombia, remains relatively constant on average, and its mean value does not fluctuate significantly over the years. However, significant fluctuations above and below are expected when the region is affected by a natural phenomenon such as El Niño or La Niña. In other words, the mean value of solar radiation in Cúcuta is roughly constant unless there is a high-impact natural phenomenon.
From our results, we conclude that a large amount of historical data of solar radiation is not strictly necessary to design and size solar photovoltaic and thermal systems in Cúcuta because solar radiation has proven to be fairly constant over the years. However, given the anomalies in 2009 and 2010 caused by El Niño and La Niña phenomena, we believe that accounting for these abnormal variations allows a more robust design and a better techno-economic analysis of renewable energy systems.
Aiming to make a statistical projection of the analyzed data, we expect a low variation on the mean solar radiation value for the next few years. This represents a strategic basis to justify the performance of a solar system in the long run, which makes sense because the current lifetime of solar panels is 25 years or more. This could require establishing a monthly energy assessment framework, which can consider solar radiation by month and create a table of electric generation showing the behavior of the investment return over time. These monthly average values can elucidate the times of the year with the best and the worst efficiency and profit margins, which in turn allow increasing or reducing the capacity of solar panels to be installed, mainly for off-grid applications with the continuous use of a battery bank.
REFERENCES
FUNDING
This study is a product of the project: “Analysis and estimation of solar radiation in Cúcuta using inferential statistics and artificial intelligence techniques” funded by Universidad Francisco de Paula Santander.
Licencia
Esta licencia permite a otros remezclar, adaptar y desarrollar su trabajo incluso con fines comerciales, siempre que le den crédito y concedan licencias para sus nuevas creaciones bajo los mismos términos. Esta licencia a menudo se compara con las licencias de software libre y de código abierto “copyleft”. Todos los trabajos nuevos basados en el tuyo tendrán la misma licencia, por lo que cualquier derivado también permitirá el uso comercial. Esta es la licencia utilizada por Wikipedia y se recomienda para materiales que se beneficiarían al incorporar contenido de Wikipedia y proyectos con licencias similares.