DOI:
https://doi.org/10.14483/22487638.18806Published:
2022-10-01Issue:
Vol. 26 No. 74 (2022): October - DecemberSection:
ResearchParameter Determination of Coupled and Decoupled Admittance Matrix Methods of the Norton Equivalent Model for an Air Extractor
Determinación de parámetros de métodos de matriz de admitancia acoplada y desacoplada del modelo Equivalente Norton para extractor de aire
Keywords:
harmonic distortion, load modeling, Norton model, single-phase motor, NRMSE (en).Keywords:
distorsión armónica, modelado de cargas, modelo de Norton, motor monofásico, NRMSE (es).Downloads
References
Arif, A., Wang, Z., Wang, J., Mather, B., Bashualdo, H., & Zhao, D. (2018). Load Modeling- A Review. IEEE Transactions on Smart Grid, 9(6), 5986-5999. https://doi.org/10.1109/TSG.2017.2700436 DOI: https://doi.org/10.1109/TSG.2017.2700436
Blanco, A. M., Stiegler, R., & Meyer, J. (2013, June 16-20). Power quality disturbances caused by modern lighting equipment (CFL and LED) [Conference presentation]. 2013 IEEE Grenoble Conference, Grenoble, France. https://doi.org/10.1109/PTC.2013.6652431 DOI: https://doi.org/10.1109/PTC.2013.6652431
Blanco, A. M., Yanchenko, S., Meyer, J., & Schegner, P. (2015). Impact of supply voltage distortion on the current harmonic emission of non-linear loads. Dyna, 82(192), 150-159. https://doi.org/10.15446/dyna.v82n192.48591 DOI: https://doi.org/10.15446/dyna.v82n192.48591
Bosovic, A., Renner, H., Abart, A., Traxler, E., Meyer, J., Domagk, M., & Music, M. (2016). Validation of aggregated harmonic current source models based on different customer type configurations. In IEEE (Eds.), 2016 Electric Power Quality and Supply Reliability, PQ 2016 (pp. 77-84). IEEE. https://doi.org/10.1109/PQ.2016.7724093 DOI: https://doi.org/10.1109/PQ.2016.7724093
Brunoro, M., Encarnação, L. F., & Fardin, J. F. (2017). Modeling of loads dependent on harmonic voltages. Electric Power Systems Research, 152, 367-376. https://doi.org/10.1016/j.epsr.2017.07.030 DOI: https://doi.org/10.1016/j.epsr.2017.07.030
Busatto, T., Ravidran, V., Larsson, A., Ronnberg, S. K., Bollen, M. H. J., & Meyer, J. (2019, June 12-15). Experimental harmonic analysis of the impact of LED lamps on PV inverters performance [Conference presentation]. 2019 Electric Power Quality and Supply Reliability Conference and 2019 Symposium on Electrical Engineering and Mechatronics, Kärdla, Estonia. https://doi.org/10.1109/PQ.2019.8818231 DOI: https://doi.org/10.1109/PQ.2019.8818231
Caicedo, J. E., Romero, A. A., & Zini, H. C. (2017a). Frequency domain modeling of nonlinear loads, considering harmonic interaction [Conference presentation]. 2017 3rd IEEE Workshop on Power Electronics and Power Quality Applications, Bogotá, Colombia. https://doi.org/10.1109/PEPQA.2017.7981641 DOI: https://doi.org/10.1109/PEPQA.2017.7981641
Caicedo, J. E., Romero, A. A., & Zini, H. C. (2017b). Assessment of the harmonic distortion in residential distribution networks: literature review. Ingeniería e Investigación, 37(3), 72-84. https://doi.org/10.15446/ing.investig.v37n3.64913 DOI: https://doi.org/10.15446/ing.investig.v37n3.64913
Cale, J., Lute, C., Ross, G., & Othee, A. (2020). Characterization procedure for unsymmetrical single-phase capacitor-start induction machines. IEEE Open Access Journal of Power and Energy, 8, 2-10. https://doi.org/10.1109/OAJPE.2020.3034210 DOI: https://doi.org/10.1109/OAJPE.2020.3034210
Chang, G., Hatziadoniu, C., Xu, W., Ribeiro, P., Burch, R., Grady, W. M., Halpin, M., Liu, Y., Ranade, S., Ruthman, D., Watson, N., Ortmeyer, T., Wikston, J., Medina, A., Testa, A., Gardinier, R., Dinavahi, V., Acram, F., & Lehn, P. (2004). Modeling devices with nonlinear voltage-current characteristics for harmonic studies. IEEE Transactions on Power Delivery, 19(4), 1802-1811. https://doi.org/10.1109/TPWRD.2004.835429 DOI: https://doi.org/10.1109/TPWRD.2004.835429
Chasiotis, I. D., & Karnavas, Y. L. (2020). On the design and manufacturing of small single phase induction motors toward super premium efficiency standards. In IEEE (Eds.), Proceedings - 2020 International Conference on Electrical Machines, ICEM 2020 (pp. 2321-2327). IEEE. https://doi.org/10.1109/ICEM49940.2020.9270791 DOI: https://doi.org/10.1109/ICEM49940.2020.9270791
Dghim, H., El-Naggar, A., & Erlich, I. (2018, May 13-16). Harmonic distortion in low voltage grid with grid-connected photovoltaic [Conference presentation]. 2018 18th International Conference on Harmonics and Quality of Power, Ljubljana, Slovenia. https://doi.org/10.1109/ICHQP.2018.8378851 DOI: https://doi.org/10.1109/ICHQP.2018.8378851
Fölting, A. S., Myrzik, J. M. A., Wiesner, T., & Jendernalik, L. (2014, August 18-22). Practical implementation of the coupled norton approach for nonlinear harmonic models [Conference presentation]. 2014 Power Systems Computation Conference, Wroclaw, Poland. https://doi.org/10.1109/PSCC.2014.7038372 DOI: https://doi.org/10.1109/PSCC.2014.7038372
Ge, X., & Liu, Y. (2020). A dynamic parameter model of harmonic source networks. IEEE Transactions on Power Delivery, 35(3), 1093-1101. https://doi.org/10.1109/TPWRD.2019.2932433 DOI: https://doi.org/10.1109/TPWRD.2019.2932433
Guo, Z., Al-Shibli, N., Xiao, X., Djokic, S., Collin, A., Langella, R., Testa, A., Papic, I., Blanco, A., & Meyer, J. (2019). Aggregate harmonic load models of residential customers. Part 2: Frequency-domain models [Conference presentation]. 2019 IEEE PES Innovative Smart Grid Technologies Europe Bucharest, Romania. https://doi.org/10.1109/ISGTEurope.2019.8905746 DOI: https://doi.org/10.1109/ISGTEurope.2019.8905746
Hasan, M. A., & Parida, S. K. (2018). Modeling and analysis of single phase induction motor as a dynamic load in inverter dominated microgrid system [Conference presentation]. 2017 7th International Conference on Power Systems, ICPS 2017, Pune, India. https://doi.org/10.1109/ICPES.2017.8387367 DOI: https://doi.org/10.1109/ICPES.2017.8387367
Marulanda, J. J., Escobar, A., & Alzate, A. (2017). Estudio comparativo de cinco estrategias de compensación de armónicos en filtros activos de potencia. Revista Tecnura, 21(52), 15-31. http://dx.doi.org/10.14483/udistrital.jour.tecnura.2017.2.a01 https://doi.org/10.14483/udistrital.jour.tecnura.2017.2.a01 DOI: https://doi.org/10.14483/udistrital.jour.tecnura.2017.2.a01
Meyer, J., Müller, S., Schegner, P., Djokic, S. Z., Collin, A. J., & Xu, X. (2016, June 20-24). Comparison of methods for modelling electric vehicle chargers for harmonic studies [Conference presentation]. 19th Power Systems Computation Conference, Genoa, Italy. https://doi.org/10.1109/PSCC.2016.7540993 https://doi.org/10.1109/PSCC.2016.7540993 DOI: https://doi.org/10.1109/PSCC.2016.7540993
Moreno-Cañón, J. C., Aguirre-Buitrago, C., & Noguera-Vega, L. A. (2014). Modelo para identificación de cargas perturbadoras de la calidad de potencia eléctrica en cuanto al fenómeno armónico en una s/e. Revista Tecnura, SE1, 65-79. https://doi.org/10.14483/udistrital.jour.tecnura.2014.SE1.a05 DOI: https://doi.org/10.14483/udistrital.jour.tecnura.2014.SE1.a05
Nassif, A. B., Yong, J., & Xu, W. (2010). Measurement-based approach for constructing harmonic models of electronic home appliances. IET Generation, Transmission & Distribution, 4(3), 363. https://doi.org/10.1049/iet-gtd.2009.0240 DOI: https://doi.org/10.1049/iet-gtd.2009.0240
Pérez-Londoño, S. M., Rodríguez-García, L. F., & Mora-Flórez, J. J. (2015). Obtención de modelos de carga compuestos en sistemas de potencia para análisis dinámico: revisión y aplicación. Revista Tecnura, 19(44), 171. https://doi.org/10.14483/udistrital.jour.tecnura.2015.2.a13 DOI: https://doi.org/10.14483/udistrital.jour.tecnura.2015.2.a13
Roy, J., Jain, A. K., & Mather, B. (2020, February, 6-7). Impacts of experimentally obtained harmonic spectrums of residential appliances on distribution feeder [Conference presentation]. 2020 IEEE Texas Power and Energy Conference, College Station, TX, USA. https://doi.org/10.1109/TPEC48276.2020.9042573 DOI: https://doi.org/10.1109/TPEC48276.2020.9042573
Senra, R., Boaventura, W. C., & Mendes, E. M. A. M. (2017). Assessment of the harmonic currents generated by single-phase nonlinear loads. Electric Power Systems Research, 147, 272-279. https://doi.org/10.1016/j.epsr.2017.02.028 DOI: https://doi.org/10.1016/j.epsr.2017.02.028
Sharma, U., & Singh, B. (2021). Design and development of energy efficient single phase induction motor for ceiling fan using Taguchi’s orthogonal arrays. IEEE Transactions on Industry Applications, 57(4), 3562-3572. https://doi.org/10.1109/TIA.2021.3072020 DOI: https://doi.org/10.1109/TIA.2021.3072020
Soni, M. K., & Soni, N. (2014). Review of causes and effect of harmonics on power system. International Journal of Science, Engineering and Technology Research, 3(2), 214-220.
Tavukcu, E., Müller, S., & Meyer, J. (2019). Assessment of the performance of frequency domain models based on different reference points for linearization. Renewable Energy and Power Quality Journal, 17(17), 435-440. https://doi.org/10.24084/repqj17.337 DOI: https://doi.org/10.24084/repqj17.337
Xiao, X., Collin, A. J., Djokic, S. Z., Yanchenko, S., Möller, F., Meyer, J., Langella, R., & Testa, A. (2017). Analysis and modelling of power-dependent harmonic characteristics of modern PE devices in LV networks. IEEE Transactions on Power Delivery, 32(2), 1014-1023. https://doi.org/10.1109/TPWRD.2016.2574566 DOI: https://doi.org/10.1109/TPWRD.2016.2574566
Yao, K., & Xiao, H. (2020, November 1-4). Analysis of frequency control system in single-phase asynchronous motor [Conference presentation]. 2020 IEEE 1st China International Youth Conference on Electrical Engineering, Wuhan, China. https://doi.org/10.1109/CIYCEE49808.2020.9332777 DOI: https://doi.org/10.1109/CIYCEE49808.2020.9332777
How to Cite
APA
ACM
ACS
ABNT
Chicago
Harvard
IEEE
MLA
Turabian
Vancouver
Download Citation
Recibido: 19 de enero de 2022; Aceptado: 4 de julio de 2022
RESUMEN
Contexto:
Estudios realizados en redes de baja tensión han explorado el modelado de cargas monofásicas lineales (como motores) y no lineales (como dispositivos basados en electrónica de potencia). No obstante, los motores de inducción presentan características no lineales entre tensión y corriente debido a la saturación de sus partes magnéticas. Por ello es necesario estudiar el motor de inducción en el dominio de la frecuencia con un modelo que permita revisar la no linealidad característica de su interacción tensión-corriente.
Metodología:
Este artículo presenta el modelado en el dominio de la frecuencia de un motor de inducción monofásico usado como extractor de aire silencioso (127 V, 60 Hz, 66 W), el cual presenta un comportamiento capacitivo (fp = 0,93 en adelanto) y distorsión armónica debido a una componente del tercer orden (7,0 %) al ser alimentado con una tensión sinusoidal pura de 127 V.
Resultados:
Este trabajo establece los parámetros de dos enfoques del modelo equivalente de Norton (matriz de admitancias acoplada y desacoplada) usados para estimar la señal de corriente distorsionada y los valores de potencia activa y no activa consumidas. Los resultados muestran errores de comparación de P, Q, índices THDi y NRMSE menores al 7, 4, 14 y 3% respectivamente.
Conclusiones:
Los parámetros del modelo equivalente de Norton estimados para el motor de inducción monofásico permiten calcular con un alto grado de precisión la señal de corriente, la cual presenta características no lineales y un comportamiento capacitivo por la presencia permanente de un capacitor que ayuda al arranque y funcionamiento del motor.
Financiamiento:
MINCIENCIAS
Palabras clave:
distorsión armónica, modelado de cargas, modelo de Norton, motor monofásico, NRMSE.ABSTRACT
Context:
Studies carried out in low voltage networks have explored the modeling of linear single-phase loads (such as motors) and non-linear ones (such as those based on power electronics). However, induction motors exhibit non-linear characteristics between voltage and current due to the saturation of their magnetic parts. Therefore, it is necessary to study induction motors in the frequency domain with a model that allows reviewing the characteristic nonlinearity of their voltage-current interaction.
Methodology:
This article presents the frequency domain modeling of a single-phase induction motor used as a silent air extractor (127 V, 60 Hz, 66 W), which presents a capacitive behavior (fp = 0,93 in leading) and harmonic distortion due to a third-order component (7,0%) when fed with a pure sinusoidal voltage of 127 V.
Results:
This work establishes the parameters of two approaches to the Norton equivalent model (coupled and decoupled admittance matrix) which are used to estimate the distorted current signal and the values of consumed active and non-active power. The results show comparisons errors of P, Q, THDi, and NRMSE indices of less than 7, 4, 14, and 3%, respectively.
Conclusions:
The parameters of the Norton equivalent model estimated for the single-phase induction motor allow calculating the current signal with a high degree of precision. This signal exhibits nonlinear characteristics and a capacitive behavior due to the permanent presence of a capacitor aiding the start and operation of the engine.
Funding:
MINCIENCIAS
Keywords:
harmonic distortion, load modeling, Norton model, single-phase motor, NRMSE.INTRODUCTION
In recent years, the massive use of devices that affect the quality of the supply voltage waveform by introducing harmonic distortion in distribution networks has increased. Some single-phase loads that cause such distortion are fluorescent and LED lights, battery chargers, variable speed drives, PV inverters, computers, and TVs, among other devices that use wave rectifiers (Bosovic et al., 2016; Busatto et al., 2019; Dghim et al., 2018; Roy et al., 2020; Soni & Soni, 2014).
Moreover, there are devices which are regarded as harmonic sources for their non-linear voltage-current characteristics, such as saturated transformers, arc furnaces, and over-excited induction motors (Chang et al., 2004). The intensive use of these non-linear devices in the network produces negative effects on it and in devices connected to it, such as the heating of conductors and components, equipment malfunction, and interference in communication equipment, among others (Blanco et al., 2015; Brunoro et al., 2017; Marulanda et al., 2017; Moreno-Cañón et al., 2014; Roy et al., 2020; Soni & Soni, 2014).
Therefore, researchers have focused their efforts on understanding and modeling the behavior of non-linear loads, particularly single-phase induction motors (SPIM) since they are most used in industrial and household applications, as is the case of compressors, air conditioners, heating-circulating pumps, fans, centrifugal, sewing and washing machines, etc. (Chasiotis & Karnavas, 2020; Sharma & Singh, 2021).
Arif et al. (2018) presented a state of the art of load modeling, which relates that an induction motor can be studied with a dynamic load model (IM), a complex load model (CLOD), or a circuit model based on wave rectifiers. Pérez-Londoño et al. (2015) compiled methodologies to obtain composite load models and proposed one based on measurements which allows reproducing the dynamic nature of a load against a disturbance.
However, the inherent nonlinearities in the electromagnetic construction of these motors make their modeling and design difficult. Models in the frequency domain are used to represent the behavior of the non-linear voltage-current characteristics of the load. The most commonly used models are the current source model and the harmonic impedance model (Chang et al., 2004). These help estimate the impact of voltage and current signals on the waveform and have proven be effective in modeling non-linear loads, regardless of the characteristics of the distribution network (Caicedo et al., 2017b; Fölting et al., 2014; Ge & Liu, 2020; Guo et al., 2019; Meyer et al., 2016; Xiao et al., 2017b).
Although there are single-phase induction motors with a current waveform showing significant percentages of the third harmonic component due to the saturation of their magnetic elements (Soni & Soni, 2014), the application of frequency-domain models to study their nonlinear characteristics is rather scarce. Hasan and Parida (2018) presented the modeling and analysis of a single-phase induction motor to study the effects of this kind of loads on a microgrid by using a two-axis model. Cale et al. (2020) described an experiment to optimally obtain the parameters of a single-phase induction motor with a starter capacitor. Yao and Xiao (2020) used the two-axis modeling of a single-phase motor to propose a speed control method with the purpose of improving its performance and efficiency.
For this reason, the objective of this work was to use the Norton equivalent model in order to model the behavior of a single-phase induction motor used as an air extractor with non-linear voltage-current characteristics. To this effect, two approaches were applied, i.e., the Norton model with both coupled and decoupled admittance matrix (Caicedo et al., 2017a; Fölting et al., 2014; Senra et al., 2017; Tavukcu et al., 2019).
Likewise, the model parameters found were evaluated via the Training approach, and the models were validated from the estimation errors in the active and non-active power parameters, as well as by calculating the NRMSE error and THDi index, considering four specific stress signals.
METHODOLOGY
This section presents the Norton equivalent model approaches used, the methodology for acquiring data from an experimental setup in a laboratory, the characteristics of the selected load, the test scenarios used to validate the load model, and the mathematical approach used to estimate the power parameters and current harmonic distortion indices (THDi).
Norton equivalent model
Nassif et al. (2010) proposed the solution of the Norton equivalent model from two approaches that consider the dependence between the harmonic distortions in voltage and current. The general expression of the model is
 , where
 is the current vector,
 is the reference current vector,
 are the variations of the voltage signal, and
 is the admittance matrix, whose dimensions are H for the highest odd harmonic components of the current signals and K for the highest odd harmonic components of the voltage signals.
Equation (1) describes the coupled admittance matrix model approach and Equation (2) the decoupled admittance matrix one.

To obtain the parameters of the model, the matrix approach of the general equation

 must be carried out as follows:
 . Now, clearing the concatenated matrix
 from the general equation yields Equation (3), which can be applied to obtain the parameters with m measurements performed in the laboratory.

Characteristics of the selected load
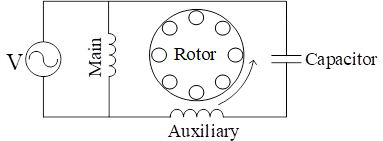
The studied motor is a permanent split capacitor single-phase induction motor (PSCM), in which the main and auxiliary windings are connected to the power supply. Moreover, a capacitor in series is connected to the auxiliary winding for starting and running the motor. Figure 1 shows the basic circuit diagram of a PSC single-phase induction motor.
Figure 1: Circuit diagram of a PSC single-phase induction motor
Moreover, the studied motor is a TD-SILENT 500/150-160 silent centrifugal air extractor, (127 V, 66 W, and 2.466 RPM). This extractor is used as a forced ventilation instrument in the intelligent air conditioning system installed in the interior spaces of a building located in the central campus of Universidad Industrial de Santander (Bucaramanga, Colombia).
Experimental assembly
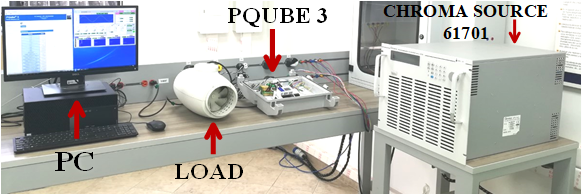
Figure 2 shows the experimental setup for the study of the selected load. A Chroma programmable source, a PQube3 network analyzer, and a computer were used. The 1.500 VA Chroma 61701 source (3P-N-G) allows distorted signals to be generated. The PQube3 Class 0,2 s network analyzer is a monitoring instrument with features to identify power quality problems, which was configured to acquire 128 samples per cycle at a fundamental frequency of 60 Hz for the measured voltage and current signals.
Figure 2: Laboratory equipment assembly
Test scenarios
Experimentation was carried out in two stages: a frequency sweep with 144 measurements in order to obtain the Norton models and the application of four special signals used for validation.
Frequency sweep: First, the load was supplied with voltage signals at the fundamental frequency (60 Hz) with magnitude values between 115 and 150 V (ΔV = 1 V), as well as with phase angle equal to 0 °. A total of 36 measurements were made. Second, the load was supplied with voltage signals made up only of a third, fifth, or seventh harmonic component, with magnitude values of 1, 3, 5, 10, 15, or 20 V, with variations in phase angles between 0 and 300° with a 60° step, considering an RMS value for the voltage of 127 V at 60 Hz, for a total of 108 measurements.
Special voltage signals: In order to validate the models obtained, four representative signals were selected: two voltage signals, typical of the university building where the load is installed (Signals 1 and 2), and two typical voltage signals for low-voltage networks: a flat-top waveform signal present in residential networks (Signal 3) and a pointed-top waveform signal present in industrial networks (Signal 4) (Blanco et al., 2013).
Power parameters and total harmonic distortion indices (THD) estimation
The RMS values of the voltage and current signals were determined via Equations (4) and (5), where v n and i n represent the sample vectors of the voltage and current signals and N is the length of each sample vector. The values of the single-phase active power are calculated as P=ΣN i=1(𝑣𝑛[𝑖] ∗𝑖𝑛[𝑖])/N, and the values of the single-phase apparent power are calculated as S=V RMS *I RMS .

Likewise, the non-active power can be calculated from two approaches: the Fryze model as QF=(S2-P2)1/2 and the Budeanu model as QB= ΣN i=1 (𝑣𝑛[𝑖] ∗𝑖𝐵𝑛[𝑖])/N, where i Bn is the sample vector of the Budeanu current signal. Furthermore, the total harmonic distortion indices of voltage ( THD v ) and current ( THD i ) are calculated via Equations (6) and (7), where h is the harmonic component order number, I 0 and V 0 are the DC components value of the voltage and current signals, I 1 and V 1 are the fundamental frequency components RMS value of the voltage and current signals, and I h and V h are the harmonic components RMS value of the current and voltage signals.

Training and validation of the model
The application of the Training approach allowed adapting or adjusting the estimated model parameters. This technique evaluates the level of unreliability or errors that a model could have from the measured data in order to verify its level of confidence. To this effect, current signals are estimated by applying the general equation of the Norton model. The input variables are the admittance matrix and the voltage signals of the frequency sweep used to estimate the Norton model parameters. The difference between the calculated and measured current signals is analyzed with the percentage error for the magnitude values and the absolute error for the phase angle. Boxplot diagrams were the tool used to show the results of the technique.
The validation of the models considered the four special voltage signals. For this quality verification process, results were obtained from calculating the percentage error for the measured and estimated active and non-active power values. Additionally, the NRMSE error index and the THDi values were calculated for the measurements, as well as estimated by the models.
RESULTS
This section presents an analysis of the power parameters for the special signals selected, the results of estimating the admittance matrix of each method of the Norton equivalent model, and the validation process of each model.
Figure 3 presents the voltage signal at the fundamental frequency and the current signal demanded by the air extractor. Figure 3a shows a voltage signal with a magnitude of 127 V and a 0° phase angle (blue line), as well as a current signal (orange line) that is slightly distorted and ahead the voltage signal by approximately 20°. Figure 3b describes the distortion of the current signal from the harmonic spectrum. Specifically, there is a presence of the third and fifth harmonic components of 7,0 and 0,8%, respectively. These harmonic components of the current signal when the load is connected to a sinusoidal power supply signal could be the result of the saturation of the motor’s magnetic core. Furthermore, it should be noted that the active power value at nominal voltage is less than the nominal power value, and that a capacitive behavior is observed when obtaining a non-active power value of -22 VAR.
Figure 3: Characteristics of the voltage and current signal of the air extractor
Analysis of power parameters
Tables 1 and 2 present information on the special signals used in the selected load, the power parameters, and the total harmonic distortion indices. They also show characteristic values of the selected load operation before the special voltage signals. The voltage values (V1, V3, V5, V7) and the alpha values (α1, α3, α5, α7) in Table 1 specify the magnitude values and the phase angle of each harmonic component. The results of the non-active power values presented in Table 2 indicate a capacitive behavior of the air extractor, which is due to the capacitor in series of the auxiliary winding that allows the motor to start and run. The values calculated for the reactive power at the fundamental frequency component (Q1) and the values of the harmonic component of the non-active power calculated with the Budeanu approach (DB) confirm that the negative values of the non-active power are the result of the compensation of the capacitor while starting and running the motor.
Source: Authors
Table 1: Characteristics values of the voltage special signals
Signal
VRMS
V1
α1
V3
α3
V5
α5
V7
α7
IRMS
[V]
[V]
[°]
[V]
[°]
[V]
[°]
[V]
[°]
[A]
1
129,3
129,1
0
0,17
23,8
2,45
176,4
0,42
34,0
0,51
2
128,7
128,5
0
0,33
84,9
1,82
186,4
0,95
64,0
0,51
3
116,7
116,6
0
2,37
0,0
1,66
180,0
0,89
0,0
0,49
4
120,2
120,0
0
3,05
180
1,66
0,00
0,05
0,0
0,50
Source: Authors
Table 2: Power parameters and total harmonic distortion indices of the voltage special signals
Signal
P
QF
QB
Q1
DB
S
fp
THDv
THDi
[W]
[VAR]
[VAR]
[VAR]
[VAR]
[VA]
[%]
[%]
1
61,4
23,9
-22,7
-22,9
7,33
65,9
0,93
2,5
11,5
2
60,7
23,5
-22,6
-22,7
6,22
65,1
0,93
2,1
9,4
3
54,3
19,4
-18,8
-18,8
4,72
57,6
0,94
3,0
10,4
4
56,2
20,8
-20,1
-20,2
5,38
59,9
0,94
3,5
10,7
Figure 4 presents the waveforms of the four special voltage signals selected for the validation of the models. Signals 1 and 2 show some similarities because they are voltage signals from the same network, albeit measured at different times of the day. The third signal is a flat-top waveform, where the third and fifth harmonic components are higher than the seventh harmonic component. Finally, the fourth signal is a pointed-top waveform, where the third harmonic component is higher than the others.
Figure 4: Waveforms of the voltage special signals
Norton equivalent model parameters
Figure 5 presents the coupled admittance matrix and decoupled admittance matrix of the Norton model for the air extractor.
Figure 5: Air extractor matrices
The admittance values obtained to form the Y matrix represent the interaction between the odd harmonics of current H and the odd harmonics of voltage K from the measurements carried out in the frequency sweep, considering that these experiments were performed using a single harmonic component at a time. It should be noted that the predominance of the relationship of the third-order harmonic component of voltage and current in the models describes the characteristic nature of the air extractor.
Figure 6 presents the boxplot diagrams that analyze the behavior of the coupled and decoupled admittance matrix model parameters against the data measured for their estimation. Deviations in the percentage errors can be observed for the magnitude of the fundamental frequency component and the harmonic components, as well as deviations in the absolute errors in the phase angles.
Figure 6: Boxplot diagram of the Norton model
The position of the blue boxes in the diagrams indicate that the distribution error is skewed positively, which happens when the red line (the mean value of all the data) is close to the bottom whisker in the diagram, which represents the minimum value.
Likewise, it can be pointed out that 75% of the magnitude errors of the fundamental frequency component of the coupled admittance matrix Norton model are below 12% and 75% of the errors of the harmonic components are below 5%, while the errors of the decoupled admittance matrix Norton model are less than 6%. On the other hand, 75% of the absolute errors of the phase angles of the two models were between 0 and 4°.
Model validation
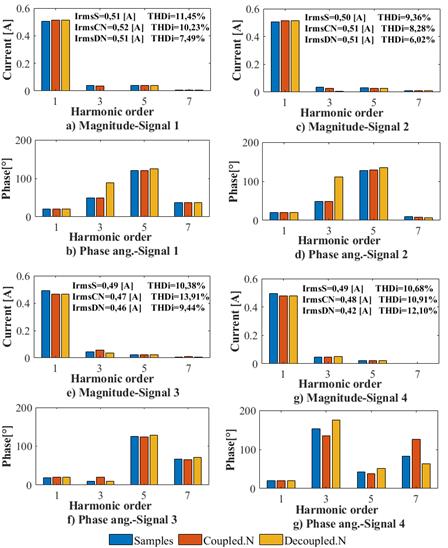
The coupled and decoupled admittance matrix models were validated by measuring the estimation quality with the four special voltage signals. Figure 7 presents a comparison of the magnitude values and phase angles of the fundamental frequency and the harmonic components of the measured signals, as well as the signals estimated by each model.
Figure 7: Current demanded spectrum for Signals 1, 2, 3, and 4
The results indicate that the errors of the magnitude values of the coupled admittance matrix Norton model are less than 3%, in contrast to those of the decoupled admittance matrix Norton model, which were less than 4%. In general, it could be said that the studied models successfully estimate the behavior of the air extractor current.
Power errors, NRMSE, and THDi indices analysis
Figure 8 presents the parameter estimation errors for the four specific signals. In Figures 8a and 8b, it is noted that the errors in the active power estimated by the coupled and decoupled admittance matrix Norton models are less than 6%. On the other hand, the errors regarding non-active power obtained by the coupled admittance model are less than 2%, unlike those of the decoupled admittance matrix model (less than 3%).
Figure 8: Active and non-active power errors for the four specific signals
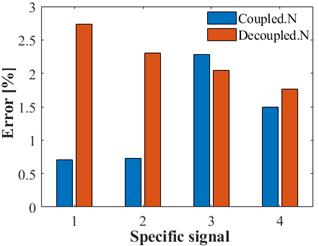
Likewise, Figure 9 presents the NRMSE index for the current signal, which, for the coupled admittance matrix model, ranged between 0,7 and 2,3%, whereas the decoupled matrix model errors were among 2 and 2,8%.
Figure 9: NRMSE current signal index for the four specific signals
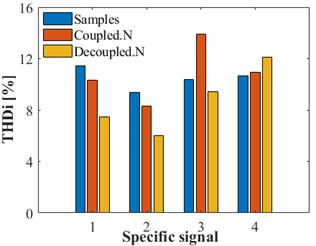
Figure 10 shows the THDi indices. In general, for the coupled admittance matrix model, better estimates of the index were obtained, as compared to the decoupled admittance matrix model. It was possible to observe an index close to 14% as estimated by the model.
Figure 10: Total harmonic distortion indices (THDi) for the four specific signals
In general, the results obtained indicate that the models can estimate the current measured in the laboratory with a certain degree of accuracy, just as the power errors estimated by the two models do not show any considerable differences.
CONCLUSIONS
This paper presents the parameter estimation of the Norton equivalent model under the coupled and decoupled admittance matrix approaches for a single-phase air extractor whose nature is non-linear due to the constant presence of harmonic components in the demanded current signal.
The results obtained indicate that the two approaches can estimate the current demanded by the air extractor with a certain degree of accuracy, with the estimation of the coupled matrix approach being more successful (NRMSE < 2%). Likewise, the results showed the estimation quality of the approaches, obtaining errors of the order of 6% regarding the active power and 3% for the non-active power, as well as values of less than 14% for the THDi index.
The increased use of devices based on power electronics has made it possible to explore the modeling of nonlinear loads in the frequency domain, as it does not require the circuit information of the load and exhibits ease of estimation when compared to time-domain modeling.
Frequency-domain modeling for motors is relatively unexplored in the literature. However, single-phase induction motors are essential loads present in any electrical system, so the results obtained in this work may allow the use of single-phase induction motor frequency-domain models in the power flow analysis of transmission or distribution networks.
Acknowledgements
ACKNOWLEDGEMENTS
The authors wish to thank the Department of Electrical, Electronics, and Telecommunications Engineering [Escuela de Ingenierías Eléctrica, Electrónica y de Telecomunicaciones] and the Vice-Principalship for Research and Extension [Vicerrectoría de Investigación y Extensión] of Universidad Industrial de Santander.
REFERENCES
License
Esta licencia permite a otros remezclar, adaptar y desarrollar su trabajo incluso con fines comerciales, siempre que le den crédito y concedan licencias para sus nuevas creaciones bajo los mismos términos. Esta licencia a menudo se compara con las licencias de software libre y de código abierto “copyleft”. Todos los trabajos nuevos basados en el tuyo tendrán la misma licencia, por lo que cualquier derivado también permitirá el uso comercial. Esta es la licencia utilizada por Wikipedia y se recomienda para materiales que se beneficiarían al incorporar contenido de Wikipedia y proyectos con licencias similares.

