DOI:
https://doi.org/10.14483/22487638.14826Published:
2019-01-01Issue:
Vol. 23 No. 59 (2019): January - MarchSection:
ResearchComparison of maximum likelihood, support vector machines, and random forest techniques in satellite images classification
Comparación de las técnicas máxima verosimilitud, máquinas de soporte vectorial y bosques aleatorios en clasificación de imágenes satelitales
Keywords:
confidence test, confusion matrix, decision tree, random forest, software R, support vector machine (en).Keywords:
árboles de decisión, bosques aleatorios, máquinas de soporte vectorial, matriz de confusión, pruebas de confianza, software R (es).Downloads
References
Alzate, B. E. (2012). Prueba piloto de verificación de área sembrada con utilización de sensores remotos en el departamento de Córdoba. Informe de monitoreo. Bogotá: Corporación Colombiana Internacional CCI.
Blackbridge Group. (2014). Blackbridge Delivering the World. Retrieved from http://www.blackbridge.com/rapideye.
Boser, B. E., Guyon, I. M., & Vapnik, V. N. (1992). A training algorithm for optimal margin classifiers. Theory, Proceedings of the 5th Annual Workshop on Computational Learning (pp. 144-152). Pittsburgh: PA: ACM Press. DOI: https://doi.org/10.1145/130385.130401
Breiman, L. (1996). Bagging predictors. Machine Learning, 26, 123–140.
Breiman, L. (2001). Random forests. Machine Learning, 45, 5-32.
Breiman, L., Friedman, J. H., Olsen, R. A., & Stone, C. J. (1984). Classification and Regression Trees. Belmont, CA: Wadsworth.
Camacho Velasco, A., Vargas García, C., & Arguello Fuentes, H. (2016). Un estudio comparativo de algoritmos de detección de objetivos en imágenes hiperespectrales aplicados a cultivos agrícolas en Colombia. Tecnura, 20(49), 86-99. DOI: https://doi.org/10.14483/udistrital.jour.tecnura.2016.3.a06
Castro, F. M., García, R. D., & Jiménez, L. A. (2017). Comparación de técnicas de interpolación espacial de propiedades del suelo en el piedemonte llanero colombiano. Tecnura, 21(53), 78-95. DOI: https://doi.org/10.14483/22487638.11658
Coronado, C. (2009). Algodón transgénico en 2008 en el Tolima, fracaso para los indígenas. El Universal. Montería.
Halmos, P. R. (1967). A Hilbert space problem book. Princeton, NJ: D. Van Nostrand Company, Inc.
Kolmogorov, A. N., & Fomin, S. V. (1970). Introductory real analysis. Englewood Cliffs: NJ: Prentice-Hall, Inc.
Lizarazo, I. (2008). SVM‐based segmentation and classification of remotely sensed data. International Journal of Remote Sensing, 29(24), 7277-7283. DOI: https://doi.org/10.1080/01431160802326081
Negrete , F., Morales, J. G., & Martínez, L. F. (2009). Buenas prácticas agrícolas para el Cultivo del Algodón en el Departamento de Córdoba. Boletín técnico. Cereté, Córdoba: Corpoica C.I. Turipaná. DOI: https://doi.org/10.4995/thesis/10251/3790
Neira, N., & Rocha, A. D. (2013). Métodos de segmentación de nubes en imágenes satelitales. Tecnura, 17(36), 96-110. DOI: https://doi.org/10.14483/udistrital.jour.tecnura.2013.2.a08
Quinlan, J. R. (1979). Discovering rules by induction from large collections of examples. In Expert systems in the micro-electronic age. (D. Michie, Ed.). Edinburgh, Scotland: Edinburgh University Press.
Quinlan, J. R. (1993). C4.5: Algorithm for machine learning. San Mateo: Morgan Kaufmann. Retrieved from Revolution Analytics: http://www.revolution-computing.com/revolution-r-enterprise
Statnikov, A., Hardin, D., Guyon, I., & Aliferis, C. F. (2009). A Gentle Introduction to Support Vector Machinesin Biomedicine. New York: New York University. DOI: https://doi.org/10.1142/7922
Tan, P., Steinbach, M., & Kumar, V. (2004). Introduction to Data Mining. Hoboken, NJ: Addison-Wesley Companion Book Site.
Tso, B., & Mather, P. (2009). Classification Methods for Remotely Sensed Data. Boca Raton, FL: CRC Press, Taylor & Francis Group.
Vapnik, V. (1979). Estimation of dependences based on empirical data [in Russian]. New York: Springer-Verlag.
Vapnik, V. (1995). The nature of statistical learning theory. New York: Springer-Verlag.
Vapnik, V. (1998). Statistical learning theory. New York: John Wiley.
How to Cite
APA
ACM
ACS
ABNT
Chicago
Harvard
IEEE
MLA
Turabian
Vancouver
Download Citation
Recibido: 14 de julio de 2018; Aceptado: 12 de noviembre de 2018
ABSTRACT
Context:
Nowadays, the images of the Earth surface and the algorithms for their classification are widely available. In particular, the algorithms are promising in the differentiating of cotton crops stages, but it is necessary to establish the capabilities of the different algorithms in order to identify their advantages, and disadvantages.
Method:
This paper describes the assessment process in which the Support Vector Machines (SVM) and random-forest technique (decision trees) are compared with the maximum likelihood estimation when differentiating the stages of cotton crops. A RapidEye satellite image of a geographic area in the municipality of San Pelayo, Cordoba (Colombia), is used for the study. Using a set of sampling polygons, a random sample of 6000 pixels was taken (2000 training and 4000 for validating the classifications.) Confusion matrices, and R (data processing and analysis software) were used during the validation process
Results:
The maximun likelihood estimation presented a correct classification percentage of 68.95%. SVM correctly classified 81.325% of the cases and the decision trees correctly classified 78.925%. The confidence test for the classifications showed non-overlapping intervals, and SVM obtained the highest values.
Conclusions:
It was possible to confirm the superiority of the technique based on support vector machines for the proposed verification zones. However, this technique requires a number of classes that comprehensively represent the variations of the image (in order to guarantee a minimum number of support vectors) to avoid confusion in the classification of non-sampled areas. This was less evident in the other two classification techniques analysed.
Keywords:
confidence test, confusion matrix, decision tree, random forest, software R, support vector machine.RESUMEN
Contexto:
Hoy en día las imágenes de la superficie de la Tierra están ampliamente disponibles, así como la evolución de los algoritmos para su clasificación. Estos son prometedores para la diferenciación de los diversos estadios del cultivo de algodón. Por esta razón es necesario establecer sus capacidades, ventajas y desventajas.
Métodos:
En este artículo se describe el proceso de valoración de las bondades de la clasificación basada en las técnicas de máquinas de soporte vectorial (SVM, por su sigla en inglés) y bosques aleatorios (árboles de decisión) en comparación con la técnica de máxima verosimilitud, empleando una imagen del satélite RapidEye, de un área geográfica ubicada en el municipio de San Pelayo, en el departamento de Córdoba (Colombia), con el propósito de diferenciar varios estadios de cultivos de algodón. A partir de un conjunto de polígonos de muestreo, se tomó de manera aleatoria un total de 6000 pixeles, 2000 de ellos para entrenamiento y 4000 para realizar la validación de las clasificaciones. La comparación de los resultados obtenidos de cada técnica fue realizada a partir de las matrices de confusión del proceso de validación, mediante el software de procesamiento y análisis de datos R.
Resultados:
El porcentaje de clasificación correcta (PCC) para la clasificación de máxima probabilidad correspondió a 68,95 %, para la clasificación SVM fue 81,325 %, y para bosques aleatórios fue 78,925 %. La prueba de confianza para las clasificaciones demostró intervalos no solapados, obteniendo los valores más altos para SVM.
Conclusiones:
Para las zonas de verificación planteadas, se pudo constatar la superioridad de la técnica basada en máquinas de soporte vectorial; sin embargo, se concluyó que para esta técnica se requiere un número de clases que representen de forma exhaustiva las variaciones de la imagen, garantizando así un mínimo de vectores de soporte, para evitar en la clasificación resultante las confusiones en las áreas restantes no muestreadas, lo cual fue menos evidente en las otras dos técnicas de clasificación analizadas.
Palabras clave:
árboles de decisión, bosques aleatorios, máquinas de soporte vectorial, matriz de confusión, pruebas de confianza, software R.INTRODUCTION
Currently there is no doubt there is a large amount of images available of the Earth surface; and digital image processing techniques and the algorithms to carry out pixel classification have also become accessible (Camacho Velasco, Vargas García, & Arguello Fuentes, 2016; Neira & Rocha, 2013). Efforts have been made around the supervised and unsupervised approaches based on support vector machines (SVM) (Lizarazo, 2008) and random forests (Tso & Mather, 2009) and have concluded that these two are the most promising techniques.
In particular, the availability of these multispectral images and recent classification algorithms turn out very promising in differentiating stages of cotton crops. However, it is necessary to establish the capabilities of these algorithms (their advantages and disadvantages.)
The company Germany Blackbridge (Blackbridge Group, 2014) owns and operates a commercial system of Earth observation, which consists of a constellation of RapidEye satellites with characteristics called 5 - 5 - 5 - 5: 5 satellites, 5 spectral bands, 5 m spatial resolution and 5 million Km2 of daily collection capacity. Additionally, it has a radiometric discrimination capacity of 4096 levels (12-bit) that represents an attractive feature for achieving required discrimination.
A RapidEye image window with five electromagnetic spectrum bands was used for this study: blue (440-510nm), green (520-590nm), red (630-690nm), Red- Edge (690-730nm) and near infrared (760-880nm). The RapidEye images include the Red-Edge band, which is particularly sensitive to changes in chlorophyll content, hence the importance of its use in this research.
The purpose of this study was to demonstrate empirically the benefits of random forest and SVM classification techniques, using the facilities provided by the software R for data analysis and processing (Quinlan, 1993), and to compare them with the maximum likelihood estimation, which is the conventional classification technique for discriminating cotton’s crops stages.
Data and methods
This section describes the data and methods used to carry out the study. A differentiation of types of cotton crops in the selected geographical area was performed in a previous study and used in this one (Alzate, 2012). Processing methods were implemented using the facilities of the software R such as dismo, e1071, MASS, mda, raster, rgdal, sp, vcd, rpart and randomForest libraries.
Study area
In the Colombian Caribbean, cotton is one of the most traditional crops with better performance and greater capacity to generate employment. Despite facing an international market that is highly variable, cotton crops in Colombia have a significant level of competitiveness (Negrete, Moreales, & Martínez, 2009).
However, Córdoba has suffered several problems regarding cotton production (Coronado, 2009). For this reason, the Colombian Confederation of cotton-Conalgodon and the Department of Agriculture proposed a census of producers in the country during 2011 in order to provide subsidies that allow production to stay afloat. International Colombia corporation (CCI in Spanish) was hired to carry out a pilot study in the area of Córdoba with RapidEye multispectral imagery that allowed the company to an overview of the cultivated areas of cotton through supervised classification of maximum likelihood, using samples of cotton raised in the field.
For the current study of comparing different techniques of supervised classification, a smaller area was selected within the existing pilot area in the municipality of San Pelayo in Córdoba (8.9594° N, 75.8369° W). Figure 1 shows the location of the area.
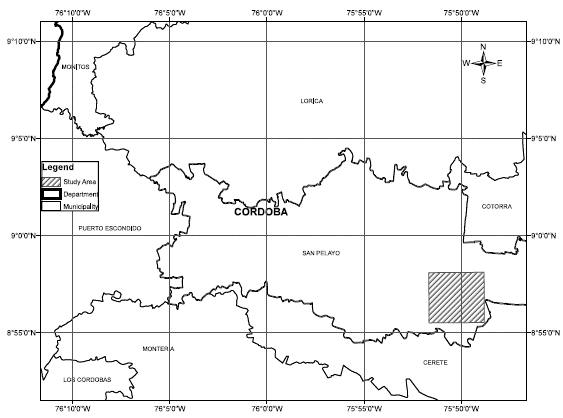
Figure 1: Location of area of study
Data
The RapidEye 2012 image window used in this work was provided for CCI and already has geometric, radiometric, and sensor corrections. It is a 12-bit radiometric level (16-bit store) and its positional accuracy corresponds with the standard 1: 25,000 United States National Map Accuracy Standards (NMAS).
The process was performed on software Revolution R Enterprise 7.0 (64-bit) using a laptop Acer ASPAIR ONE quad core with 2 GB of RAM. The main statistical parameters by bands for the selected window are presented in Table 1. Figure 2 shows the histogram obtained by the function pairs in R software with relationships between bands. The samples for the classification covered a 10,11% of the total image window.
Source: own work.
Table 1: Radiometric statistics for the image window used
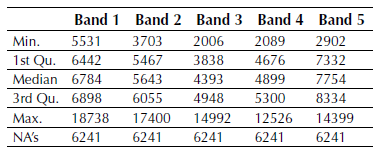
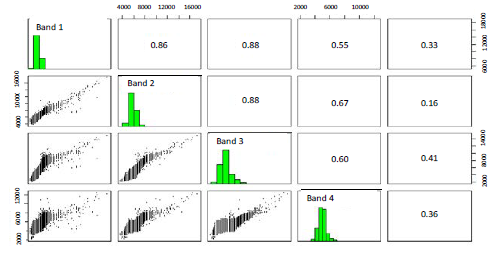
Figure 2: Histograms and relationships between bands
For the multispectral image, the matrices of covariance and correlation were calculated using cov andcor R functions, and the auxiliary function na.omit to ignore unknown values in the image. This allowed analysing redundant information in the set of bands.
The delimitation of sampling areas was carried out for the image window during ten stages of cotton growth and three kinds of differentiated features: River, urban area (infrastructure), and dry soil. On-screen digitalization was performed using the software ArcGIS (ArcMap module) based on a color composition 4, 2, 1 that yielded greater discrimination coverages.
It was possible to define a considerable number of classes given the high radiometric and spectral resolution of the image; however, they were limited to 13 during this study. The infrastructure class was added from the beginning in order to assess the quality each technique has to differentiate "infrastructure" from "bare soil" and "soil with few vegetation" in presence of the usual confusion between them; but it could have been ignored during the first stages and added in the final step of classification.
METHODS
A supervised technique that used previous knowledge already acquired on the study area was used to classify the image (Alzate, 2012). Based on this, the most representative sampling areas considered were created first. Then, the classification algorithms were trained using a subset of those sampling areas to obtain a model to be applied. Afterwards, the recognition of different categories was carried out by applying each model to the whole image window. Finally, the validation phase of the obtained results was performed.
The classification process was developed using the maximum likelihood estimation, random forests, and the SVM supervised classification, which are described below.
Maximum likelihood classifier
The Maximum likelihood classifier considers that the radiometric values in each class fit a normal distribution. This allows each class to be described by a probability function from its mean vector and variance/covariance matrix. This function is similar to the distribution of the radiometric values of each category; hence, the probability that a radiometric value is a member of a given class can be calculated (Figure 3). The calculation was performed for each involved class, assigning the pixel to that which maximizes the probability function (Alzate, 2011).
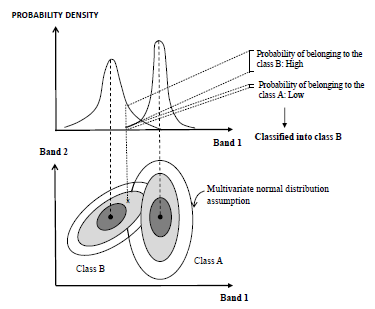
Figure 3: Assignment of pixels by maximum likelihood classifier
Support vector machines (SVM)
According with Tso & Mather (2009), structural risk minimization adopted by the SVM method consists of minimizing the probability of misclassification of a randomly extracted data set from a fixed but unknown probability distribution (Vapnik, 1995, 1998). The SVM training phase always finds a global minimum. The basic operation of SVM involves building a separation hyperplane (i.e. a limit of decision) based on the training sample distribution in feature spaces, looking for the margin of separation between pairs of classes maximized (Vapnik, 1979). Not all samples of training contribute to the construction of the hyperplane, so normally only a subset is chosen as support vector.
As shown in Figure 4, only the darkest samples have enough support vectors to define the separation hyperplane of the two classes with maximum distance. Information Classes are derived from remote sensing data so do not always present the linear separation showed in the Figure 4 (a). Therefore, it is necessary to make the criterion of complete separation between classes more flexible, allowing their overlap by introducing a measure of overlapping cost. This should be minimized by supervising it as shown in the Figure 4 (b).
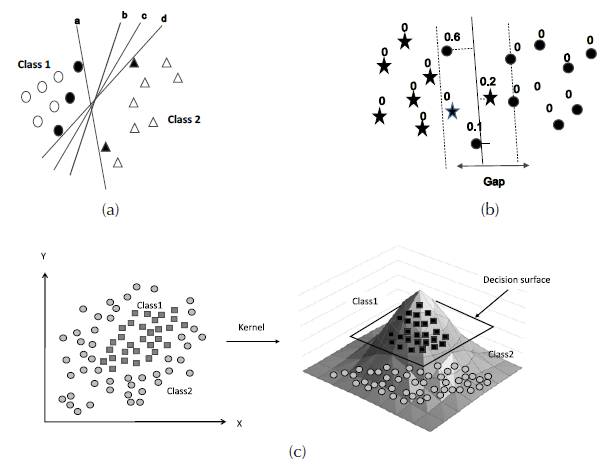
Figure 4: Maximum separation of classes by hyperplanes. (a) Separable samples without overlap. (b) Separable samples with measure of the overlay cost. (c) Samples separation in a space of higher dimension.
In the case of non-linear decision surfaces, it is proposed that a vector of attributes be transformed to a Euclidean space with a higher dimension than the original Euclidean space [i.e. a generalization of Euclidean space called Hilbert space (Halmos, 1967; Kolmogorov & Fomin, 1970)]. Thereby, the distribution of training samples is separated making it possible to define a linear separation hyperplane (Boser, Guyon, & Vapnik, 1992) as is shown in Figure 4 (c).
Random forest
The Random forest approach for classification builds decision trees and then it randomly combines them (Castro, García, & Jiménez, 2017). The hierarchical approach of random forest classifier is a technique that uses a sequence of decision criteria on an unknown pattern for labelling it (Tso & Mather, 2009). A root node, a set of internal nodes, and leaf nodes (end nodes) make up the decision tree. The root and middle nodes represent decision stages, while end nodes represent the final classification. To implement the classification process, a set of rules establish the path that needs to be followed. It starts at the root node and ends when the item to be classified reach the leaf node. This last node assigns the corresponding label to the classified object.
The way in which it goes to the next node is decided in each intermediate node. Figure 5 displays the use of the reflectance values as an input to find its respective hypothetical class (i.e. between “1” and “7”) in order to produce a hierarchical decision tree. For the example, the decisions’ nature taken as a base and the sequence in which the spectral bands are chosen will affect the results of the classification. Therefore, finding the optimum configuration of the tree to be used for the classification is highly necessary.
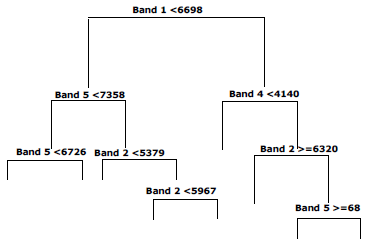
Figure 5: Example of a decision tree
The indexes most used in decision trees induction are the information gain index (Quinlan, 1979, 1993) and the impurity Gini index (Breiman et al., 1984). The R software functions uses both.
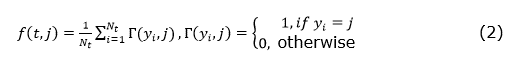
The gain index is based on the measurement of entropy used in information theory. A set of training data has a probability of being part of a given class, which corresponds to the relative frequency of the observed pixels (for example, if the total size of the training sample is 20 and that of class i contains 6 pixels, the probability of class i is 0.3). The test that produces the greatest information gain is selected. In order to calculate the information gain, there must first obtain the respective entropy in the given node as shown in equation (1).
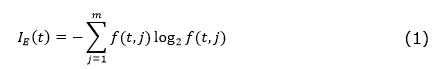
Where f(t,j) is the proportion of training samples belonging to j class, j є {1,2,…,m}, in the node t, and m is the number of classes. If the node t contains Nt samples, then f(t,j) is calculated by equation (2).
Finally, for a partition on the attribute X, the respective information gain is calculated according to the equation (3).

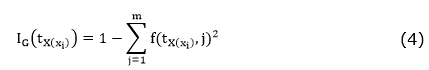
The Gini impurity index measures an input function impurity with respect to the classes reaching its minimum (zero) when all the attributes in the node fall into a single class of information. The IG(tx(xi)) Gini index associated with the X є {X1,X2,…,Xr} attribute for the node t is expressed in the equation (4).
As mentioned, the classification approach based on random forest combines classifier trees generated using a random training sample dataset for either one. Each tree provides a vote to the class in which should be located an input vector (Breiman, 2001). The approach to produce a random forest combines bagging methods and random subspaces. The Bagging Technique (Breiman, 1996), consist in generate randomly training subsets of n size from a training size N (n<N) set, if M spectral bands are available, m (m < M) subsets are chosen randomly to calculate the best partition on each node (using GINI).
Classification procedure and comparative assessment of classifications
Figure 6 shows an overview of the general steps of image classifications and their comparative assessment, which are described next.
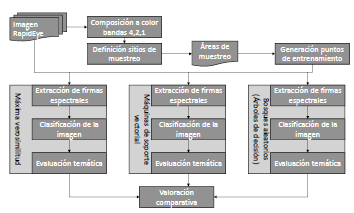
Figure 6: Process of classification and comparative assessment of used techniques
-
Training spots definition: sample polygons were drawn for each type of coverage to be discriminated. A set of points was extracted from these sample areas based on a random process by using R software randomPoints function. A set of 6000 points were extracted, 2000 of them were used for the training step, and the other as a set of checkpoints for the validation stage (see Figure 7).
-
Extracting spectral signatures: the next step computed statistics from radiometric values for each class based on training sample multispectral pixels (5 bands). Then, the model with the characteristic patterns of each class was created for the three considered classification algorithms.
-
The function lda of the software R was used to generate the maximum likelihood model; the svm function was used for the SVM model, but in this case the parameters cost, gamma, epsilon and NumberOfSupportVectors were previously tuned running the tune.svm function (using 16, 1, 0.1, and 365 respectively). The function rpart in the software R was used for modeling the decision tree.
-
Image classification: the image classification was carried out by all the techniques using the function predict of the software R. In each case, each model generated in the previous step was used.
-
Thematic accuracy evaluation: this step used 4000 validation pixels that were extracted from sampling polygons and their corresponding classified pixels obtained through the classification process in the previous step. These data were used as input to run the confusion function for each of the classification techniques in order to generate the corresponding confusion matrixes. From the confusion matrix the percentage of correct classification (PCC) and the Kappa index (Tso & Mather, 2009) were calculated. The PCC is the percentage of pixels in the image correctly classified. The global Kappa index measures the agreement between pixels classified and class sample pixels for all the covered categories. In weighted kappa, weights were assigned to quantify the relative importance among the disagreements.
-
Comparative assessment: Using the results of the thematic accuracy evaluation, a comparative assessment was performed based on the number of pixels correctly classified and the confidence intervals associated with the classifications.
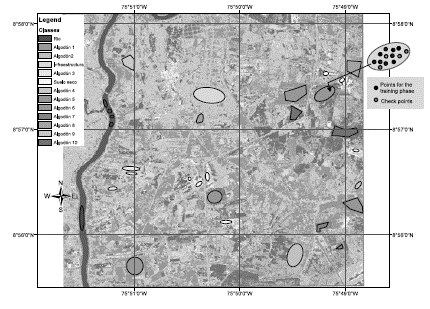
Figure 7: Definition of training sites for discriminated coverages
RESULTS
The obtained classification images are shown in Figure 8, and the results are described in the following sections.
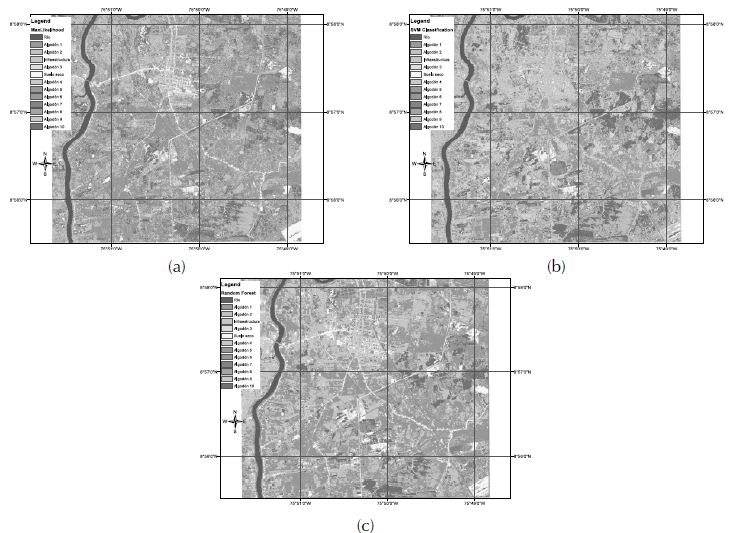
Figure 8: Resulting images from each technique used. (a) Maximum likelihood classification, (b) SVM classification (c) Random forest classification.
Maximum likelihood classification
The confusion matrix for the maximum likelihood classification can be seen in Table 2. The labels between 1 and 13 correspond to the order of named classes in resulting classifications (Figure 8). The PCC from matrix corresponds to 68.95%.
Source: own work.
Table 2: Maximum likelihood classification confusion matrix
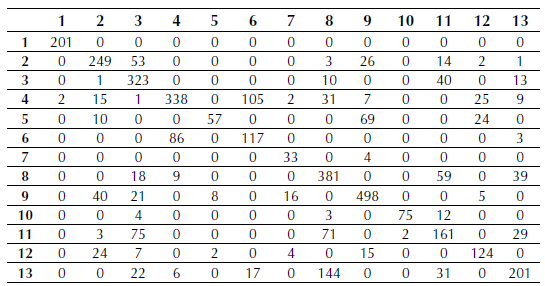
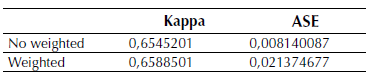
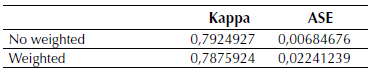
Table 3 shows the kappa values and the approximate standard error (ASE) obtained by R software.
Source: own work.
Table 3: Kappa index for maximum likelihood classification
SVM classification
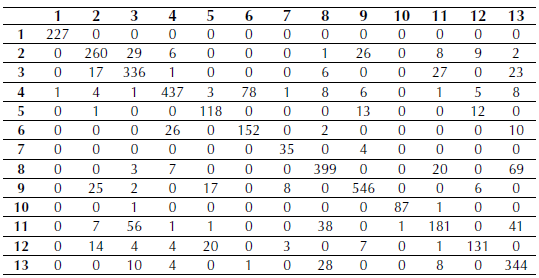
Confusion matrix for this classification is shown in Table 4 from this confusion matrix, the PCC was 81,325%, Kappa index and ASE is shown in Table 5.
Source: own work.
Table 4: SVM classification confusion matrix
Source: Own work.
Table 5: Kappa index for SVM classification
Random forests classification
The function varImpPlot in the software R was used to generate the band rank graph shown in Figure 9 for the random forest. The mean decreased accuracy was calculated based on the classification error for each band on the outside of the bag (OOB) portion; then, the band was permuted with the others and the error recalculated. The difference between the two values was averaged over all trees and normalized by the standard deviation of differences. The other measure is Gini index total reduction regarding the tree partition from a given band averaged over all the trees.
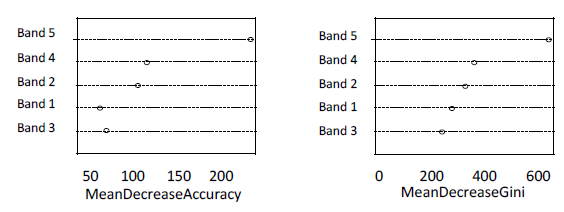
Figure 9: Decision tree induced by software R
Using R software randomForest function, a random forest model with 500 trees was generated using the five bands of the RapidEye image; then the obtained model was applied to the window image. See confusion matrix for this classification in Table 6.
Source: own work.
Table 6: Confusion matrix for random forests classification
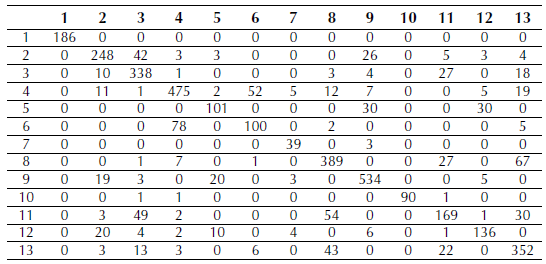
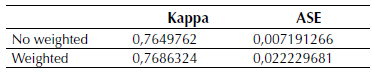
The PCC and the Kappa indexes were calculated from the confusion matrix. The PCC was 78.925%, and Kappa index and ASE are shown in Table 7.
Source: own work.
Table 7: Kappa index for random forests classification
Confidence intervals
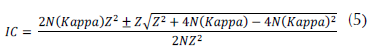
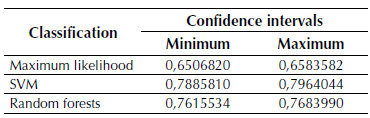
Table 5 shows the confidence interval for each classification calculated by using equation (5).
Source: own work.
Table 8: Confidence intervals
Where, N is the number of samples, Kappa is the value of the Kappa index without weight, and Z corresponds to 1.96 for a confidence level of 95%.
DISCUSSION
From a visual inspection of classifications (Figure 8) it can be noted that the number of classes (13) defined is low since the discrimination provided by the RapidEye image with five spectral bands, 4096 levels of radiometric resolution (12 bits), and a five meters spatial resolution was underused. The variability of the coverage is directly proportional to the sensor’s resolution, i.e. to greater spatial detail in the image greater sensitivity to detect internal variations in a category. Therefore, the size of both the training and the validation samples should be larger to take advantage of the RapidEye image. However, since the purpose of this study was to perform a comparative analysis of the maximum likelihood estimation against SVM and random forests, it is permissible to overlook this situation.
The visual examination also allowed us to observe that the maximum likelihood classification achieved a better differentiation of coverages in non-sampled areas of the image window whereas the other two techniques (SVM and random forest) categorized confusedly infrastructure, thus wrongly overestimated this class. It is worth highlighting, however, that a good classification needs a more exhaustive sampling in the cases of SVM and random forests. This is important so to have representative vectors for each category in SVM, and to have enough samples of different classes in random forest; otherwise, the classifiers will not have appropriate differentiation criteria. On the other hand, the SVM classification seemed to preserve the geometric details in a faithful way.
The results obtained from the classifications and validation samples indicate that the SVM technique has the fewer errors. It has a higher number of correctly classified pixels (PCC), which can be seen in the confusion matrix and in the results of the Kappa index (clearly superior for this technique). In the case of random forests, discernment power was higher because a RapidEye image was used (the excellent radiometric resolution enables radiometric values of the same spectral band to be used many times as separation criterion).
Taking into consideration the analysis of confidence intervals showed in Table 5, the superiority of the SVM classification is evident.
CONCLUSIONS
It can be concluded from this study that SVM was the method that better classified the validation areas because of the advantages of vector samples, which allowed a clearer separation of the established classes and thus avoiding confusions. This capability may be exploited to the fullest with a more extensive sampling of cover changes. If there were not enough training samples for a given class, it would be better not to use it but mask it. The results obtained in areas where the density of sampling was higher for different classes, showed the possibility of discriminating mixed classes in the feature space taking them to spaces of higher dimension provided by SVM, becoming a very powerful tool and improving the quality of the obtained classification.
The maximum likelihood estimation correctly classified more of the infrastructure clases than the other two techniques and this could be verified visually. It is possible that SMV did not achieved this aspect of the evaluation due to lack of support vectors. However, the confusion matrices showed that SMV is superior to the other two in terms of the ability to separate similar classes such as infrastructure and dry soil, but it is restricted to the areas enough data sampling.
The classification confidence intervals shown in Table 5 show complete separation but without high extreme values, which could be explained by the difficulty all the three techniques had to perform the distinction between dry soil and infrastructure, as seen in the confusion matrixes.
Additionally, the best result provided by SMV technique could be related with the strategy of validation, which was based on selecting validation data from the same training sample polygons. Therefore, it could generate overvaluation, while the other two techniques were measured on equal conditions. It would be advisable to carry out works for getting control ground points to validate the classification obtained.
Acknowledgements
ACKNOWLEDGEMENTS
We thank the company CCI, who facilitated the RapidEye image window that was used for this study and authorized its use for scientific purposes of knowledge production in digital Earth observation satellite images processing techniques.
REFERENCES
License
Esta licencia permite a otros remezclar, adaptar y desarrollar su trabajo incluso con fines comerciales, siempre que le den crédito y concedan licencias para sus nuevas creaciones bajo los mismos términos. Esta licencia a menudo se compara con las licencias de software libre y de código abierto “copyleft”. Todos los trabajos nuevos basados en el tuyo tendrán la misma licencia, por lo que cualquier derivado también permitirá el uso comercial. Esta es la licencia utilizada por Wikipedia y se recomienda para materiales que se beneficiarían al incorporar contenido de Wikipedia y proyectos con licencias similares.