DOI:
https://doi.org/10.14483/22487638.19385Published:
2022-07-01Issue:
Vol. 26 No. 73 (2022): July - SeptemberSection:
ResearchMultitemporal Analysis of Urban Expansion in the Municipality of Madrid, Cundinamarca, between 1977 and 2020
Análisis multitemporal de la expansión urbana en el municipio de Madrid, Cundinamarca, entre 1977 y 2020
Keywords:
land cover and use, geographic information systems, urban expansion, multitemporal analysis (en).Keywords:
cobertura y uso del suelo, sistemas de información geográfica, expansión urbana, análisis multitemporal (es).Downloads
References
Alcaldía de Bogotá (2018). Análisis demográfico y proyecciones poblacionales de Bogotá. Secretaría Distrital de Planeación.
Alcaldía de Madrid (2019). Documento técnico del plan básico de ordenamiento territorial. https://madridcundinamarca.micolombiadigital.gov.co/sites/madridcundinamarca/content/files/000697/34831_documento-resumen-de-la-formulacion-del-pbot_compressed.pdf
Alonso, F. (2006). Sistemas de información geográfica. https://www.um.es/geograf/sigmur/temariohtml/index.html
Agencia Nacional de Infraestructura (ANI) (2017). Inician socializaciones del nuevo aeropuerto para la sabana de Bogotá. https://www.ani.gov.co/inician-socializaciones-del-nuevo-aeropuerto-para-la-sabana-de-bogota
Aponte-Rodríguez, W. A. (2011). Morfología urbana de Madrid, Cundinamarca. Perspectiva Geográfica, 16(1), 211-232. https://doi.org/10.19053/01233769.1756 DOI: https://doi.org/10.19053/01233769.1756
Ávila, L., & Molina, J. (2018). Análisis multitemporal del crecimiento urbano de Ibagué y su relación con el deterioro de las microcuencas urbanas: quebrada Las Panelas-La Balsa y quebrada Hato de la Virgen [Specialization thesis, Universidad Santo Tomás]. https://repository.usta.edu.co/handle/11634/15982.
Ariza, A., Roa-Melgarejo, O., Serrato, P., & León-Rincón, H. (2018). Uso de índices espectrales derivados de sensores remotos para la caracterización geomorfológica en zonas insulares del Caribe colombiano. Perspectiva Geográfica, 23(1), 105-122. https://doi.org/10.19053/01233769.5863 DOI: https://doi.org/10.19053/01233769.5863
Cabrera, E., Galindo, G., & Vargas, D. (2011). Protocolo de procesamiento digital de imágenes para la cuantificación de la deforestación en Colombia, nivel nacional escala gruesa y fina. Instituto de Hidrología, Meteorología y Estudios Ambientales, IDEAM.
Cámara de Comercio de Bogotá (CCB) (2016). Caracterización económica y empresarial de diecinueve municipios de Cundinamarca. CCB.
Contraloría de Cundinamarca (2018). Diagnóstico minero. Contraloría de Cundinamarca.
Concejo Municipal Madrid-Cundinamarca (2012). Acuerdo 007. Modificación excepcional del Plan Básico de Ordenamiento Territorial del Municipio de Madrid Cundinamarca. Concejo Municipal.
Cruz-Flores, D., Curbelo-Benítez, E., Ferrer-Sánchez, & Ávila, D. (2020). Variaciones espaciales y temporales en el Índice de Vegetación de Diferencia Normalizada en Cuba. Revista Ecosistemas, 29(1), 1-12. https://doi.org/10.7818/ECOS.1885 DOI: https://doi.org/10.7818/ECOS.1885
National Planning Department (DNP) (2020). Fichas y tableros. Madrid, Cundinamarca. https://terridata.dnp.gov.co/index-app.html#/perfiles/25430
Gobernación de Cundinamarca (2015). Plan de desarrollo de Cundinamarca "Unidos podemos más”, Anexo 3.3. Secretaría de Planeación.
Humacata, L., & Buzai, G. (2018, May 16-19). Análisis espacial de los cambios de usos del suelo con Sistemas de Información Geográfica [Conference presentation]. V Jornadas Nacionales de Investigación en Geografía Argentina - XI Jornadas de Investigación y Extensión del Centro de Investigaciones Geográficas, Tandil, Argentina. https://host170.sedici.unlp.edu.ar/items/bba7ac54-dc01-4853-8a97-824fe4c1607f
Instituto de Hidrología, Meteorología y Estudios Ambientales (IDEAM) (2010). Leyenda nacional de coberturas de la tierra: metodología CORINE Land Cover adaptada para Colombia escala 1:100.000. IDEAM.
Lamprea, F. (2017). Zonificación de las coberturas de la tierra mediante la aplicación de herramientas SIG para la revisión y ajuste del P.O.T. en al marco del crecimiento urbano y la conurbación norte: caso municipio de Zipaquirá [Undergraduate thesis, IGAC-Universidad Distrital Francisco José de Caldas]. https://repository.udistrital.edu.co/handle/11349/25625.
Meneses-Tovar, C. L. (2011). El índice normalizado diferencial de la vegetación como indicador de la degradación del bosque. Unasylva: Revista Internacional de Silvicultura e Industrias Forestales, 62(238), 39-46. https://dialnet.unirioja.es/servlet/articulo?codigo=3925443.
Muñoz-Aguayo, P. (2013). Apuntes de teledetección: índices de vegetación. Centro de Información de Recursos Naturales.
Oltrá-Carrió, R., Sobrino, J., Gutiérrez-Angonese, J., Gioia, A., Paolini, A. & Malizia, A. (2010). Estudio del crecimiento urbano, de la estructura de la vegetación y de la temperatura de la superficie del Gran San Miguel de Tucumán, Argentina. Revista de Teledetección, 34, 69-76. http://cursosihlla.bdh.org.ar/PDI2019/Bibliografia/2010_Oltra-Carri%C3%B3-Ts.pdf.
Santana, L., Escobar, L., & Capote, P. (2010). Estimación de un índice de calidad ambiental urbano, a partir de imágenes de satélite. Revista de Geografía Norte Grande, 45, 77-95. http://dx.doi.org/10.4067/S0718-34022010000100006. DOI: https://doi.org/10.4067/S0718-34022010000100006
Tibaquirá, H. (2016). Análisis multitemporal del crecimiento urbano de la zona de expansión para el periodo de 1987-2005 en el municipio de Ibagué, Tolima [Specialization thesis, Universidad Militar Nueva Granada].
Totolhua-Ramírez, V. (2018). Percepción remota básica con QGIS. Comunidad QGIS México.
How to Cite
APA
ACM
ACS
ABNT
Chicago
Harvard
IEEE
MLA
Turabian
Vancouver
Download Citation
Recibido: 1 de noviembre de 2021; Aceptado: 20 de abril de 2022
Abstract
Context:
Given the increasing population concentration, both the proximity of the town of Madrid to the city of Bogotá and the growing metropolitan area around the latter have a significant influence on the increased urbanization and the change in land use in the town of Madrid, Cundinamarca.
Objective:
The objective of this study was to carry out a multitemporal analysis of the change in coverage and land use caused by urban expansion in the municipality of Madrid between 1977 and 2020.
Methodology:
Satellite images were observed through supervised classification, following the Corine Land Cover methodology, which was adapted for the Colombian context, and utilizing geographic information systems. Area variation analyses were performed for each classification in each of the evaluated years.
Results:
The data obtained show that the forest cover area and seminatural zones have been reduced by 86% in a period of 43 years, and that artificial territories have progressively become predominant in each of the years, even reaching a coverage greater than 50% of the municipality area. The agricultural territories have maintained 66,95% of the surface of the municipality, and they correspond the land use with the largest occupied area for the evaluated period, which shows the importance of the soil for the economic development of the population.
Conclusions:
This situation shows that population growth and urban expansion cause variations in coverage and land uses. Their valuation is an aspect that must be considered when elaborating development plans for municipal entities.
Keywords:
land cover and use, geographic information systems, urban expansion, multitemporal analysis.Resumen
Contexto:
Debido a la creciente concentración demográfica, tanto la proximidad de la localidad de Madrid a la ciudad de Bogotá como el crecimiento del área metropolitana en torno a esta última tienen una influencia significativa en el aumento de la urbanización y el cambio de uso del suelo en la localidad de Madrid, Cundinamarca.
Objetivo:
El objetivo de este estudio fue realizar un análisis multitemporal del cambio de cobertura y uso del suelo causados por la expansión urbana en el municipio de Madrid, Cundinamarca, entre 1977 y 2020.
Metodología:
Se observaron imágenes satelitales por medio de clasificación supervisada, siguiendo la metodología Corine Land Cover adaptada para el contexto colombiano y utilizando sistemas de información geográfica. Se realizaron análisis de variación de área para cada clasificación en cada uno de los años evaluados.
Resultados:
Los datos obtenidos muestran que el área de cobertura de bosques y las áreas semi naturales se han reducido en un 86 % en un periodo de 43 años y que los territorios artificiales han predominado en cada uno de los años de manera progresiva, llegando incluso a una cobertura superior al 50 % del área del municipio. Los territorios agrícolas han mantenido un 66,95 % de la superficie del municipio, y estos corresponden al uso de la tierra con la mayor área de ocupación para el territorio evaluado, lo cual muestra la importancia del suelo para el desarrollo económico de la población.
Conclusiones:
Esta situación evidencia que el crecimiento de la población y la expansión urbana ocasiona variaciones en las coberturas y usos del suelo. Su valorización es un aspecto a considerar cuando se elaboran planes de desarrollo para entidades municipales.
Palabras clave:
cobertura y uso del suelo, sistemas de información geográfica, expansión urbana, análisis multitemporal.INTRODUCTION
As a consequence of increasing population concentration, both the proximity of the town of Madrid (Cundinamarca) to the city of Bogotá and the growing metropolitan area around the latter (Aponte, 2011) have a significant influence on the increased urbanization and the change in land use of the town. This can be observed in the latest census data on population, construction, and dwelling, which was conducted by the National Planning Department (DNP, 2020). In addition, Madrid is perceived as a town with land that is still available for business and enterprise uses (CCB, 2016), and it contributes significantly to the gross income of the whole department of Cundinamarca in industrial sectors such as food production, plastics, and rubber products manufacturing, among others (Gobernación de Cundinamarca, 2015). It also has a useful location and road accessibility to the center and eastern regions of the country, and it is an extraction site for construction materials such as dressing, sand, and gravel (Contraloría de Cundinamarca, 2018). There is an additional benefit to the industrial use of the town: the presence of Colombian Air Force facilities, as well as the possible future development of a small airport, which is currently in design and diagnostic stages by the National Infrastructure Agency (ANI, 2017). In light of the above, analyzing variations in vegetation cover, land use, and urban growth is relevant to the planning and management of the town’s resources.
In this research, Geographic Information Systems (GIS) were used to analyze, process, store, generate, and visualize geographically referenced data. This allowed integrating images and descriptive and spatial data from applied mathematical models (Sarria, 2006) in order to analyze the changes in land use and vegetation cover between 1977 and 2020 in the municipality of Madrid, Cundinamarca, Colombia.
Moreover, vegetation and buildings normalized differential indices were used to complement the analysis by estimating artificial or in-development areas.
This type of analysis is a contribution to the municipality’s planning, management, and development because it provides insight into the behavior of population, economic, and natural land protection aspects.
METHODOLOGY
This is a qualitative research on the influence that urban expansion has had on vegetation cover and land use over time in the municipality of Madrid, Cundinamarca. It is supported by a multitemporal analysis with satellite images from 1977, 1985, 1997, 2007, 2018, and 2020. These specific dates almost coincide with those of official population and dwelling census conducted by the National Statistics Administration Department (DANE) (Alcaldía de Bogotá, 2018).
Table 1 shows the data obtained from the United States Geological Service (USGS) via sensors Landsat 5 and Landsat 8 (Alonso, 2006).
Source: Alonso (2006)
Table 1: List of satellite images of Madrid, Cundinamarca
Sensor
Register date (Acquisition)
ID
Path/Row
Landsat 5
January 07, 1977
LM02_L1GS_008057_19770107_20180421_01_T2.
8/57
Landsat 5
March 22, 1985
LM05_L1TP_008057_19850322_20180406_01_T2.
8/57
Landsat 5
August 30, 1997
LT05_L1TP_008057_19970830_20161230_01_T1.
8/57
Landsat 5
September 27, 2007
LT05_L1TP_008057_20070927_20161111_01_T1.tar
8/57
Landsat 8
December 30, 2018
LC08_L1TP_008057_20181230_20190130_01_T1.tar
8/57
Landsat 8
March 22, 2020
LC08_L1TP_008057_20200322_20200326_01_T1.tar
8/57
Figure shows the processing and treatment of satellite images using the Arc Gis (ESRI) tool in order to obtain input data for the multitemporal analysis.
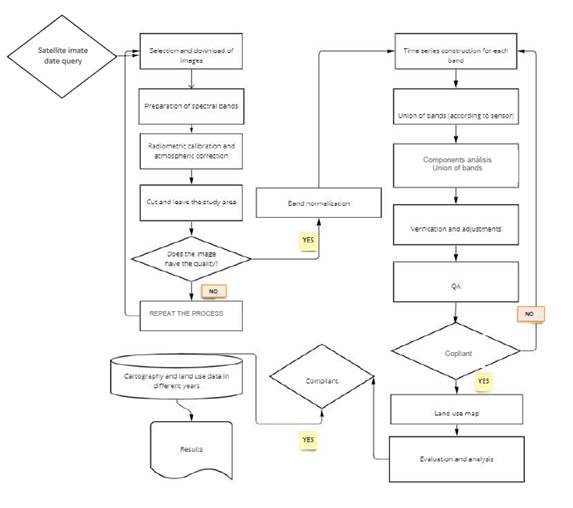
Figure 1: Satellite image processing diagram
In the image selection stage, the main criterion was a maximum cloudiness of 20% in the area. This, to ensure that it could be used to observe and quantify the vegetation in the land (Ávila & Molina, 2018). Afterwards, an image quality enhancement by radiometric calibration and atmospheric correction was performed in order to prepare the images for band combination (Santana et al., 2010), as well as to ensure that the subsequent supervised classification process would be optimal (Tibaquirá, 2016).
Supervised classification was carried out through the Corine Land Cover methodology, which was adapted for the Colombian context (IDEAM, 2010). The assigned categories were agricultural territories, artificial territories, clouds, water bodies, forests, and seminatural areas (Lamprea, 2017).
Finally, via spectral band combination of red and near infrared, the Normalized Difference Vegetation Index (NDVI) and Normalized Difference Building Index (NDBI) were mapped (Ariza et al., 2018) for each year under study, in order to verify (a) the quantity and particularity of the vegetation, (b) the modified areas and their changes over time, (c) anthropogenic modifications due to land use and cover, and (d) how the former’s increase over time has been throughout the time interval used for the multitemporal analysis (Cruz et al., 2020).
RESULTS
Once the base data had been collected and the treatment and classification of satellite images had been performed, the following quantification of areas of interest was obtained (Table 2). The final selected images had a cloudiness of less than 3%.
Source: Authors
Table 2: Multitemporal analysis of cover and land use in Madrid, Cundinamarca
Year
1977
1985
1997
2007
2018
2020
Cover
%
km2
%
km2
%
km2
%
km2
%
km2
%
km2
Forests and seminatural area
34,7
41,5
21,8
26,1
13,2
15,8
13,2
15,8
12,9
15,4
4,8
5,7
Clouds
0,2
0,2
0,2
0,2
0,0
0,0
0,0
0,1
0,8
1,0
2,4
2,9
Water bodies
0,0
0,0
0,0
0,0
0,0
0,1
0,0
0,0
0,0
0,0
0,2
0,2
Agricultural territories
60,3
72,1
71,9
86,0
73,5
87,7
73,5
87,7
64,4
77,0
58,3
69,7
Artificial territories
4,8
5,8
6,1
7,3
13,3
16,0
13,3
16,0
21,8
26,2
34,3
41,1
Total
100
119,6
100
119,6
100
119,6
100
119,6
100
119,6
100
119,6
Figure shows the mapping of the area categories obtained during the image classification process.
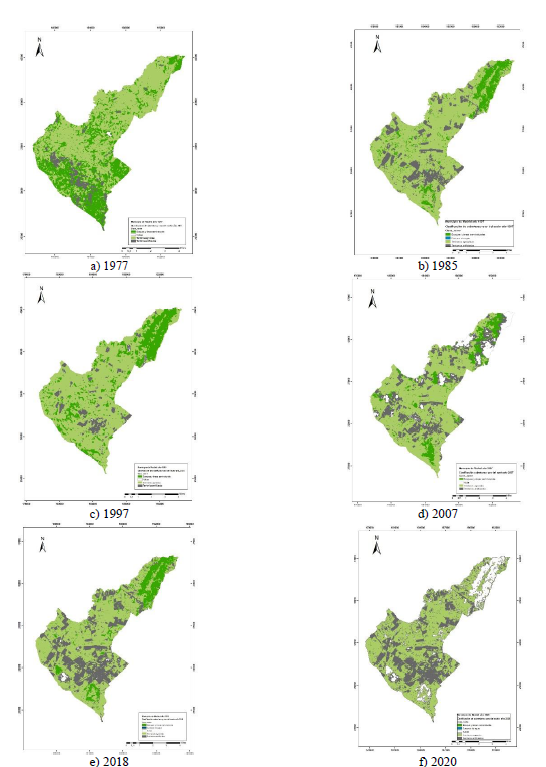
Figure 2: Mapping of the multitemporal analysis of land use in the municipality of Madrid, Cundinamarca, from 1977 to 2020
Next, the most significant changes in cover and land use in Madrid for the time frame under study are presented.
Forests and seminatural areas
This type of cover showed a continuously decreasing behavior in the observed time frame. The area lost to the other types of covers from the first year of the observed interval to the last is 86%. This, despite the 2012 modification to the municipality’s Basic Land Use Plan, in which the conformation of protected areas around native forests was encouraged (Concejo Municipal de Cundinamarca, 2012). The decreasing tendency of total forests and seminatural areas is shown in Figure 3. The total area for this type of cover in 2020 was only 5,71 km2.
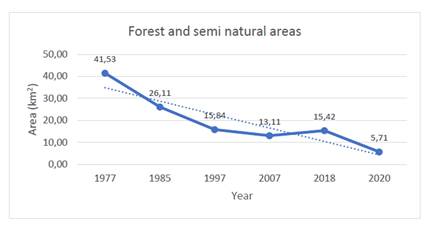
Figure 3: Analysis of forest and seminatural areas
Agricultural territories
This type of cover represents the predominant economic land use in the municipality (CCB, 2016). In the observed years, it maintained an average of 70% of the town’s total area, as can be seen in Figure 4. There is a slight 10% decrease in the last time interval (between 2018 and 2020), but it is still the most significant land use in the town.
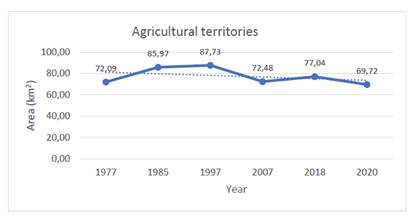
Figure 4: Analysis of agricultural area cover
Artificial territories
As it is shown in Figure 5., the total artificial cover area increased in the town. This type of cover results from the urban and industrial use of land, including mining and extraction, debris dump yards, and artificial non-agricultural greenery. This increase was steady during the observed time frame. For 2020, the total area covered by artificial territory was 41,08 km2, which evidences an urban expansion in the municipality.
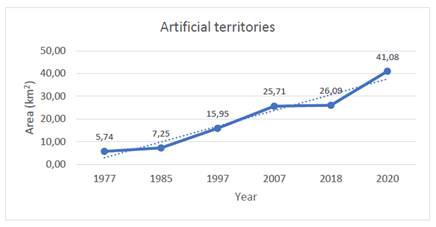
Figure 5: Analysis of artificial territories
The expansion of artificial territories coincides with the observed loss of land of other types of cover, especially forests and seminatural areas, as can be seen in Figure 2. This is validated by comparing the cover and land use overlap between the first and the last year of the studied time frame.
Additionally, according to projections by the Madrid Town Hall (Alcaldía de Madrid, 2019), the need to supply the dwelling and infrastructure demand will cause the artificial cover to increase even more in the near future.
Next, the behaviors of the area count for the three types of cover and land use from 1977 to 2020 are presented side by side as evidence for the previous observations.
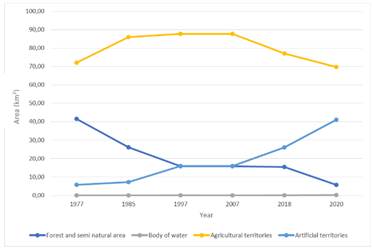
Figure 6: Behavior of types of cover and land uses in Madrid across the observed time frame
The change in cover and land use is analyzed according to the maps obtained by means of a transition matrix (Table ) (Humacata & Buzai, 2018).
Source: Authors
Table 3: Transition matrix for Madrid (1977 and 2020)
2020
Transition matrix for cover and land use change
Agricultural territories
Artificial territories
Forests and seminatural areas
Water bodies
Clouds
1
2
3
4
5
1977
Agricultural territories
10
11
12
13
14
15
Artificial territories
20
21
22
23
24
25
Forests and seminatural areas
30
31
32
33
34
35
Water bodies
40
41
42
43
44
45
Clouds
50
51
52
53
54
55
The agricultural territory was found to have an unchanged area of 43,13 km2, which is 36,1% of the total area of the town, followed by artificial territory, with 3,12 km2 (2,6% of the total area).
It is evident that the most frequent changes in land use were (a) from forest and seminatural areas to agricultural territory, and (b) from the agricultural to artificial territory. This could have been triggered by the population increase evidenced in the census data (an increase of approximately 112.307 inhabitants) (Oltrá et al., 2010).
There was a noticeable reduction in the forest area (39,68 km2 of the total area lost), a clear increase in artificial territory, and a location exchange between the latter and agricultural territories. This can be observed in Figure and Figure.
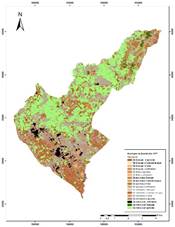
Figure 7: Cover and land use changes between 1977 and 2020 in Madrid
Next, by overlapping the maps obtained for 1977 and 2020, it was observed that a total area of 72,16 km2 in the town changed cover and land use, i.e., 60% of the total area of the municipality (Figure 8). Significant changes, as mentioned above, were seen in forest and agricultural cover, followed by more urban use.
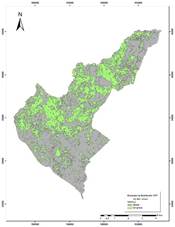
Figure 8: Cover and land use areas between 1977 and 2020, in Madrid, with and without changes
NDVI index
This index represents the quantity, quality, and development of vegetation (Meneses, 2011). The following classification and intervals were used: inanimate (-1 to 0), sick (0 to 0,33), moderately healthy (0,34 to 0,66), and very healthy (0,66 to 1) (Muñoz, 2013).
The areas shown in Table were calculated.
Source: Authors
Table 4: Multitemporal NVDI index for Madrid, Cundinamarca
Year/ Classification
1977
1985
1997
2007
2018
2020
Area (km2)
1
Inanimate
0,20
11,0
12,30
8,83
19,58
19,70
2
Sick
3,71
33,1
35,66
37,04
34,00
40,27
3
Moderately healthy
81,81
49,7
47,22
43,43
37,00
40,20
4
Very healthy
33,86
25,7
24,39
30,27
29,00
19,41
Total
119,58
119,58
119,58
119,58
119,58
119,58
Figure shows the vegetation type variation for the observed time frame. There is an evident increase in the area occupied by -1 to 0,33 vegetation, which may be a consequence of the increased urban use of land.
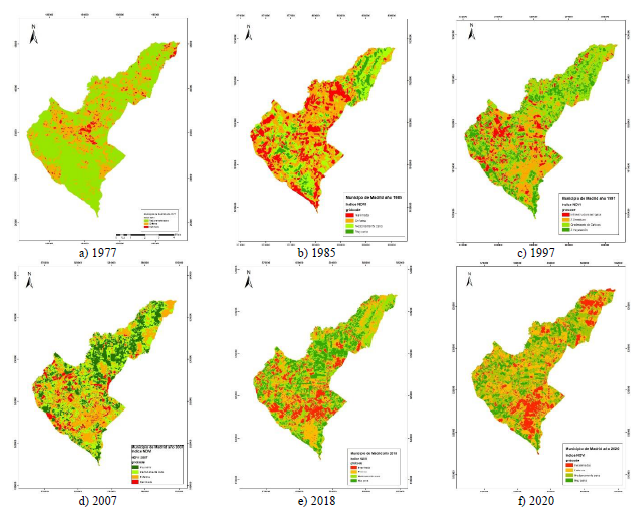
Figure 9: Multitemporal NVDI index for Madrid, Cundinamarca
There is a noticeable agricultural land use for flower cultivation and cattle raising in the municipality.
Figure 10 shows the annual behavior of the municipality’s NDVI Index for the observed time frame.
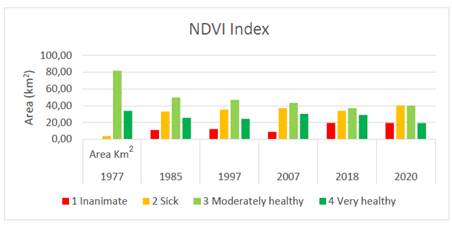
Figure 10: Annual behavior of the NDVI Index
NDBI Index
This index allows discriminating between areas with building surfaces, in-development areas, and areas naturalized with vegetation (Totolhua, 2018). The following classification and intervals were used: vegetation zone (-1 to 0), crop growing (0 to 0,33), semihard zone or urban development zone (0,34 to 0,66), and anthropic infrastructure (0,66 to 1).
Table shows the calculated areas.
Source: Authors
Table 5: Multitemporal NDBI Index for Madrid, Cundinamarca
Year Classification
1977
1985
1997
2007
2018
2020
Area (Km2)
1
Vegetation zone
0,08
25,9
12,30
30,27
29,00
19,41
2
Crop growing
82,02
49,5
35,66
43,43
37,00
40,20
3
Semihard and urban development zone
33,82
33,1
47,22
37,04
34,00
40,27
4
Anthropic infrastructure
3,66
11,0
24,39
8,83
19,58
19,70
Total
119,58
119,58
119,58
119,58
119,58
119,58
As shown in Figure , anthropogenic infrastructure and semihard zones increased in the observed years, which is in line with the analysis of cover and land use change.
Areas belonging to the crop growing category remained stable within the time frame, averaging 40 km2, which could be also concluded by means of the NDVI index analysis.
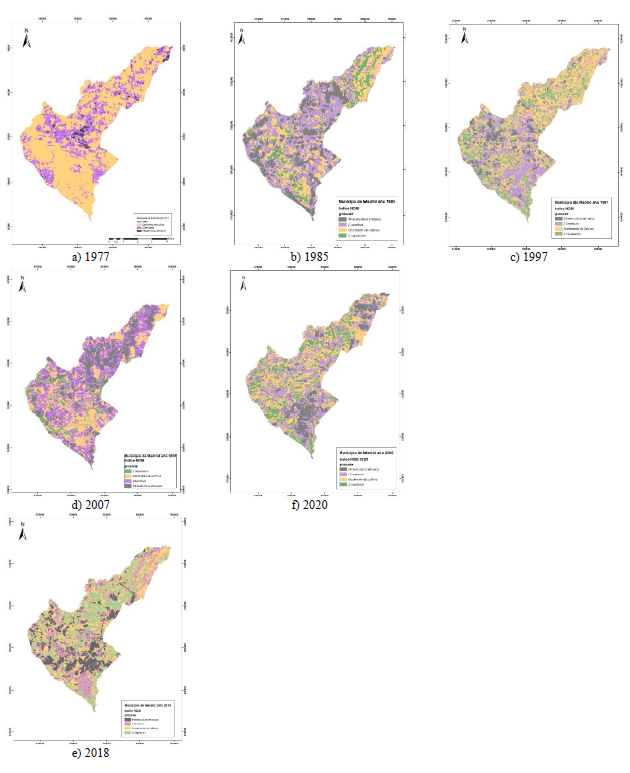
Figure 11: Multitemporal NDBI index for Madrid, Cundinamarca
Next, the annual behavior of the NDBI index for the municipality is presented.
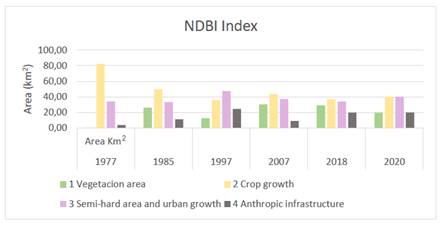
Figure 12: Annual behavior of the NDBI index
CONCLUSIONS
A significant decrease in forests and seminatural cover areas in the municipality of Madrid within the evaluated time frame was evidenced. Simultaneously, an increase in artificial territory was observed. Both observations coincide with a population increase, which was recorded during the census conducted by DANE. Urban expansion can also be located predominantly in the center and the southeast of the town due to their ease of access to the Sabana Road System.
Agricultural territory maintained an average of 66, 95% of the town’s total area, which makes it the most widespread land use in Madrid. This evidences its economic importance to the town. Moreover, as shown in the NDVI analysis, crop growing remained steady in the observed time frame. However, based on the conducted multitemporal analysis, it was evident that, although the percentage of land used for agriculture remained steady, it moved from its initial location; artificial territory appeared in former agricultural areas, and agricultural territory appeared in former forests and seminatural areas.
Multitemporal analysis is a useful application of public-access satellite images, and it may assist local governments in conscious urban development planning and in the protection of natural areas.
The analysis of NDVI and NDBI indexes easily quantifies cover and land use behavior over time and is a key supplement to the supervised classification method. Additionally, a close relation is observed between the results obtained from both applied methods. The analysis of change in cover and land use by supervised classification and the band overlap in satellite images used to obtain the NDVI and NDBI indices were both evidence of the noticeable reduction in forests and seminatural cover areas in the town, as well as of the increase in urban land use.
The implementation of more effective protection measures is recommended to preserve forests and seminatural cover areas, as they have lost an 86% of their area between 1977 and 2020. Additionally, there is a need for strategies that appropriately regulate urban growth and ensure the protection of natural areas without compromising the town’s economic development.
References
License
Esta licencia permite a otros remezclar, adaptar y desarrollar su trabajo incluso con fines comerciales, siempre que le den crédito y concedan licencias para sus nuevas creaciones bajo los mismos términos. Esta licencia a menudo se compara con las licencias de software libre y de código abierto “copyleft”. Todos los trabajos nuevos basados en el tuyo tendrán la misma licencia, por lo que cualquier derivado también permitirá el uso comercial. Esta es la licencia utilizada por Wikipedia y se recomienda para materiales que se beneficiarían al incorporar contenido de Wikipedia y proyectos con licencias similares.