
DOI:
https://doi.org/10.14483/22484728.7862Published:
2014-01-03Issue:
Vol. 8 No. 1 (2014)Section:
A Research VisionModeling the cytotoxic immune response effects on human immunodeficiency virus
Keywords:
Immune System, HIV, Cytotoxic Response, Dynamic System. (es).Downloads
References
UNA IDS, WHO. Global Report 2013. Joint United Nations Programme on HIV/ AIDS (UNAIDS) Joint United Nations Programme on HIV/AIDS (UNAIDS). 2013.
C. Lapenta, et al., "Potent Immune Response against HIV-1 and Protection from Virus Challenge in hu-PBL-SCID Mice Immunized with Inactivated Virus-pulsed
Dendritic Cells Generated in the Presence of IFN-α". J Exp Med. Jul 21, 2003;198(2):361–367.
A . Perelson, PW. Nelson PW “Mathematical Analysis of HIV-I: Dynamics in Vivo.”. SIAM Review, Vol. 41, No. 1, pp.
-44, Mar, 1999.
J. Alcamí J. “Avances en la inmunopatología de la infección por el VIH Enferm Infecc Microbiol Clin”, 2004.
D. Kirschner, “Using Mathematics to Understand
HIV Immune Dynamics”, Notices of the AMS, 1996, pp.191-202.
H.D., Toro-Zapata, et al, “Role of Active and Inactive Cytotoxic Immune Response in Human Immunodeficiency Virus Dynamics", Osong Public Health Res Perspect, 2014, pp.3-8.
S. Bonhoeffer , RM May, G. Shaw , MA Nowak, "Virus dynamics and drug therapy, Proc Natl Acad Sci U S A, 94 (1997), pp. 6971-6976.
MA Nowak, RM May, "Virus dynamics. Mathematical principles of immunology and virology". Oxford University Press, 2000.
JM Orellana, "Optimal drug scheduling for HIV therapy efficiency improvement. Biomedical Signal Processing and Control" pp. 379-386, 2011..
B .M. Adams, H.T. Banks H.T., M. Davidian, K. Hee-Dae,H.T. Tran, S.N. Wynne, E.S. Rosenberg, “HIV dynamics: Modeling,data analysis, and optimal treatment protocols”. Journal of Computational and Applied Mathematics, pp. 10-49, 2005.
R .R. Culshaw, S. Ruan, R.J. Spiteri, "Optimal
HIV treatment by maximising immune response". J. Math. Biol. pp. 545- 562, 2004.
Panel on Antiretroviral Guidelines for Adults and Adolescents. Guidelines for the use of antiretroviral agents in HIV-1-infected adults and adolescents. Department of Health and Human Services. January 10, 2011; pp 1-166.
H. Heesterbeek, "Centrum voor Wiskunde en Informatica". Amsterdam. 1992.
L. Perko, “Differential equations and dynamical
systems”. New York: Editorial Springer, tercera edición 2001.
How to Cite
APA
ACM
ACS
ABNT
Chicago
Harvard
IEEE
MLA
Turabian
Vancouver
Download Citation
MODELING THE CYTOTOXIC IMMUNE RESPONSE EFFECTS ON HUMAN IMMUNODEFICIENCY VIRUS
submitted date: Novembre 2013
received date: December 2013
accepted date: March 2014
Jeimy Lorena Pérez Ibarra
B.Sc. In Mathematics, Universidad del Quindío (Colombia). Member research group in applied mathematical – SIGMA, Universidad del Quindío (Colombia). E-mail: jlperezi@uqvirtual.edu.co
Hernán Darío Toro Zapata
B.Sc. In Mathematics and M.Sc. In Biomathematics, Universidad del Quindío (Colombia). Director research group in applied mathematical SIGMA, Universidad del Quindío (Colombia). E-mail:hdtoro@uniquindio.edu.co
Abstract
The immune system is responsible for the body defense against strange organisms. This type of control is performed by molecules and cells in an organized way. The proposed model consists in a system of ordinary deferential equations intended to resemble the interaction between HIV and the immune response when considering cytotoxic cells. Standard local stability analysis at the virus free equilibrium is carried out to determine the theoretical conditions that avoid infection. Simulations were run to obtain results for particular immunological conditions and also to describe the dynamics of the system when facing infection states
Key words
Immune System, HIV, Cytotoxic Response, Dynamic System.
1. Introduction
UNAIDS, in its Global Report (2013), estimates that 35.3 million people were living with HIV by 2012. These figures show an increase compared to previous reports, and the report itself suggests that this is due to a major access to antiretroviral therapy. On the other hand, there were 2.3 million new infections globally; this represents a reduction of 33%. Also, AIDS related deaths are declining from 2.3 million people in 2005 to 1.6 million in 2012. The estimated cost of the treatment and care programs for of HIV and AIDS patients is measured in billions of dollars. This scenario motivates scientific research aimed at understanding the mechanisms responsible for HIV transmission, treatment and control [1].
Although recent developments of antiviral treatment and the increasing access to such treatment have significantly reduced mortality and morbidity of HIV infected patients, the control of high viral replication continuous to be a major research challenge. It is known that treatment is unlikely to eradicate HIV in the short or mid term, and uncontrolled therapy interruptions lead to rebounds in viral replication. Therefore, there is increasing interest in developing vaccination strategies that make use of joint antiviral treatment, allowing longterm immune control of viral replication [2].
Antigen presenting cells are the first in fighting HIV once infection starts. These cells phagocytize and process viral particles, marking them on their surface to be recognized by CD4 T cells, which are then activated, (these cells specialize in identifying viral particles). Subsequently, the cells deploy adequate immune responses: humoral immune response or cytotoxic immune response. Simultaneously, the same CD4 T cells may become infected by the virus and initiate their replication process; in particular, when an activated T cell is infected, it loses the ability to deploy the appropriate immune response to cope with the infection [3-6].
This response activation occurs through the production of cytokines, which promote the proliferation of other specific cells of the immune system. In the case of humoral immune response, B lymphocytes are activated and produce neutralizing antibodies that bind to infected CD4 T cells, “marking” them, and “making them to be recognizable.” As the cellular immune response is activated, cytotoxic cells proliferation occurs, especially regarding CD8 T cells in initial phases of infection,and Natural Killer cells at later stages. These two types of cell have cytotoxic properties and are primarily responsible for eliminating the infected cells by stimulating CD4 T cells to “kill themselves” (i.e. apoptosis), thus inhibiting viral replication [4, 6].
Consistent with foregoing content, the relationship between the virus, the activation of CD4 T cells and the cellular immune response, appears to be decisive in the future evolution of the infection, because if active CD4 T cells concentration is low, cellular immune responses is not be deployed effectively and the body does not have the necessary tools to control the infection.
In order to gain a better understanding of this type of problems, the need arises to model the situation described above and study the behavior of the cytotoxic immune response over time together with the effects of the relationship with resting and helper CD4 T cells and HIV on the evolution of infection. Additional information on HIV dynamics and mathematical models is provided in [3-12].
2. Model description
Let T = T(t) be the average number of resting CD4 T cells at time , t , V = V (t) the average concentration of HIV at time t . Now suppose that the average number of helper CD4 T cells is Th =
Th (t) and the average number of cytotoxic cells, which are active against HIV, is represented by R = R(t) . Finally, let T* = T *(t) be the average number of infected CD4 T cells that actively replicate the virus.where Uc is the potential across the plates of the nonlinear capacitor, q is the charge , and s and a are constants. The equation of the circuit may be written asT resting cells are considered to increase at a constant rate σ and die by infection-unrelated reasons at a an average of µT If a population of resting T cells is infected with a probability β at time t , then an average number of new infected cells βTV are produced. On the other hand, some cells become active to recognize viral particles with probability Φ; then we have ΦT as the average number of new helper cells at time t. It is assumed that helper cells die at an average of µTh
Helper Th =cells are also susceptible to become infected with probability Ψ, so ΨThV represents the average number of helper cells that become infected at time t. It is assumed that cytotoxic cells grow at an average of αThV in response to infection, and die at a rate ρ so the average number of cytotoxic cells that die is ρR The infected celγlsR T* die by the action of cytotoxic cells (apoptosis) at an average of γRT* and make cellular lysis with probability δ; so δT* is the average number of destruction of infected cells at time t . When the cells die by lysis, viral particles are released at a rate η, then, there is an average of ηδT* new viral particles and cV virus clearance. The corresponding differential equations are as follows:
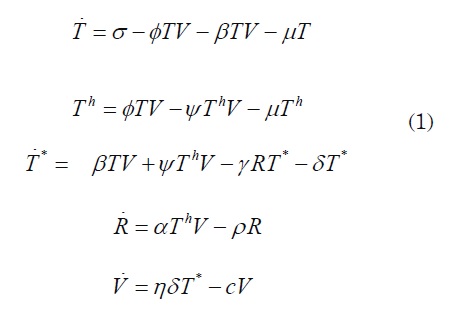
Parameter and state definitions can be found in Table 1. System (1) is not likely to be solvable using analytical techniques. In the following sections, attention is paid to the study of the basic reproduction number R0 and its influence on the virus-free equilibrium. This will bring analytical conditions to avoid infection.
2.1 Equilibriums and R0
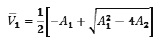
System (1) has two constant solutions given by E0 = ((σ/ µ),0,0,0,o) which corresponds to the virus free equilibrium, or absence of infection, and E1(T1, T 1, T11, R1, V1) which corresponds to the infection state, with
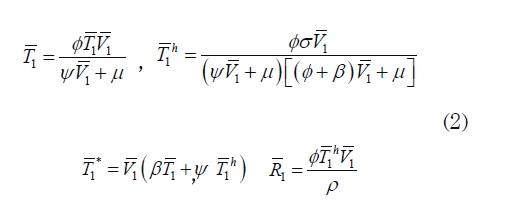
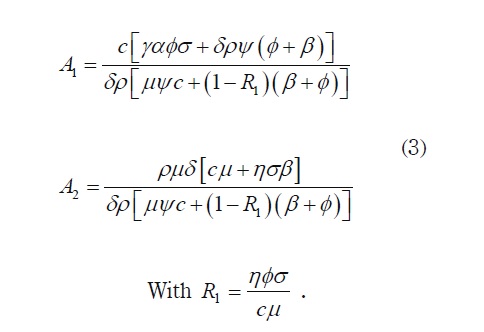
where V1 is a non negative root of the quadratic polynomial p(V)= V2 + A 1V + A 2, where:
Now the following proposition and lemma ensures for the model: existence of infection state and the basic reproduction number.
Proposition 1.: if A1 < 0 and A2 < 0 then system (1) has an infection steady state E1 and it is not possible for system (1) to have two different infection steady states.
Proof. Routh-Hurtwiz criteria states that the necessary conditions for p(V) to have two negative real part roots are A1 >0 and A2 > 0 a sufficient condition for this to occur is when R1 < 1 and therefore, the equilibrium would be E0
Routh-Hurwitz criteria can also be used to study the case of two positive real part roots. Indeed, If p(-V) has two negative real part roots, then will have two positive real part roots. In this case, p(-V)= V2 - A 1V + A 2 Considering the definition of A 1 and A 2 above, it is obvious that both coefficients in p(-V) have different signs, and the Routh-Hurwitz condition states that there is no two negative roots, and then, p(V) has no two positive roots simultaneously.
To ensure the existence of infection states, the existence of at least one positive real root of p(V) that occurs on the root should be guaranteed, namely
under the sufficient, but not necessary conditions A1 < 0 and A2 < 0 Indeed, in that case it will be
and since -A1 > 0 then
This proves that V1 > 0 at least when A1 < 0 and A2 < 0
The existence of E0 is then more likely than in the previous proposition, and that is made explicit in the simulations. The importance of Proposition 1 is that it ensures the existence of E1 and so guarantees that the model accepts infection to thrive into the body
The following lemma shows the basic reproduction number, namely a threshold quantity that determines the number of secondary infected cells produced by an infected cell from an initial viral load. Additional information on the basic reproduction number can be found in [12].
Lemma. The basic reproduction number of system (1) is given by R0 = η β σ / cµ
Proof. The basic reproduction number, R0 is defined as the spectral radius of the Next Generation Matrix [13]. To find such a number, consider the states that are responsible for transmission T* and V, and with their corresponding equations define vectors
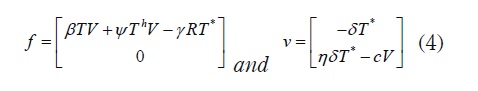
The next generation matrix is then defined as M = FV where F = -DF and v = (Dv)-1 here, Df and Dv denote the Jacobian matrix of f and v, respectively. Then, by substituting E0,
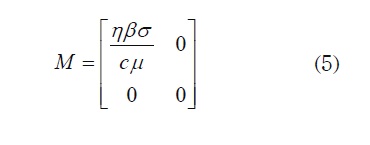
Thus, R0 = η β σ / cµ as the lemma states
This quantity, R0 is broadly used in epidemiology, as a measure of how fast the infection will colonize an entirely susceptible population or whether, on the contrary, it will disappear in a short time. This is the rationale behind analyzing E0 in the next subsection.
2.2 Local stability analysis of E0
Proposition 2. If R1 < 0, then the virus free equilibrium E0 is local and asymptotically stable.
Proof. The Jacobian matrix of system (1) in E0 has the characteristic equation, [14]:

Three eigenvalues are x1 = −μ, x2 = −μx3 = −ρ To analyze the other two, consider that the Routh- Hurwitz criterion establishes that both solutions of the quadratic factor have negative real part if the coefficients are positive; in this case, it means R0 < 1
The result above indicates that when R0 < 1 the infection is not deployed in the body and the initial viral load tends to be eliminated in a short time.
3. Simulation
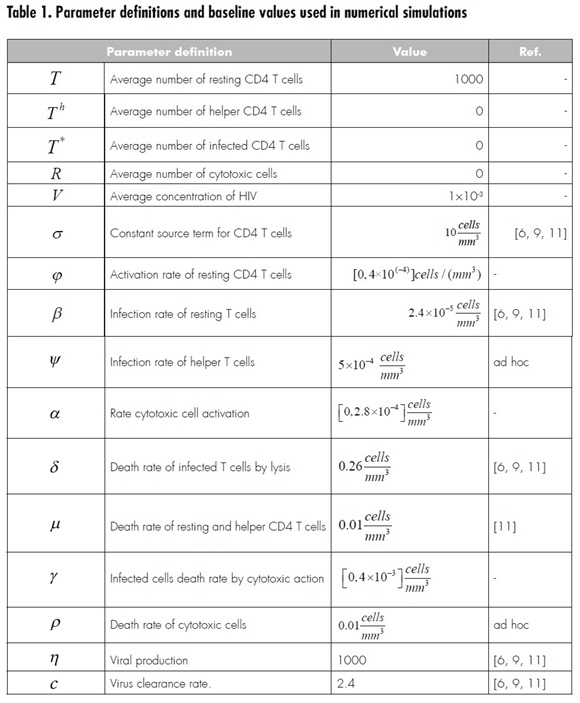
Model simulation is made using the parameters shown in Table 1. Variations are made over some parameters to see their impact on the system. Such parameters were selected to take an approximate representative value due to the lack of information in the bibliography. Twenty random values are generated for each parameter, using a uniform distribution over a given interval, to illustrate how the change in values affects system evolution.
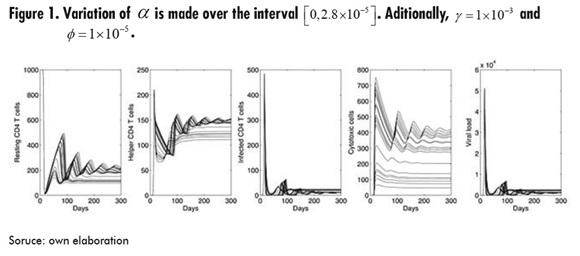
In Figure 1, the parameter that varies is , which represents the activation rate of the cytotoxic cells. It can be seen that, for infected cells and viral load, all values of α lead to the same initial outbreak; however, the second outbreak of infection is moving forward as increases. Also, increasing has the effect of increasing the average number of both resting and helper T cells, but with higher amplitude in the oscillations.
In Figure 2, the parameter to be varied is ϒ which represents the death rate of infected cells by cytotoxic action. The highest ϒ represents the largest number of resting and helper CD4 T cells, but these curves are characterized by oscillations with increasing amplitude. It is important to consider that, as in the simulation for α infection outbreaks move forward as ϒ increases; in fact, both parameters have a similar effect on the resulting dynamics.
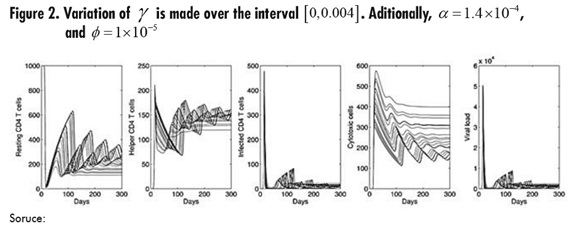
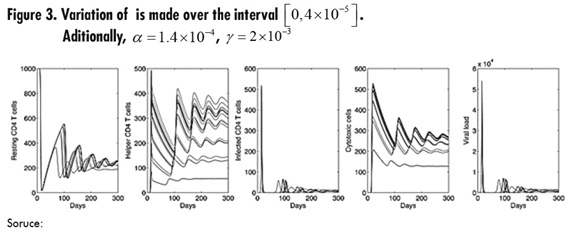
figure 3, shows the variation of parameter Φ where it can be seen that the parameter has a significant impact on the dynamics of helper CD4 T cells, which exhibit an important increase as Φ increases. Also, the secondary outbreaks of infection presented in viral load and infected cells are reduced when compared to Figures 1 and 2.
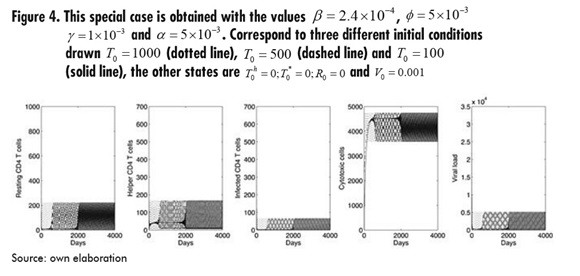
Finally, as a result of extensive simulations for every parameter, Figure 4 shows a special situation obtained with a change in some parameters, as specified in the figure. This suggests the way dynamics may lead to a cycle after some time depending on the initial conditions. It is beyond the aim of this paper to study and clarify the specific conditions for this situation to occur, and so these issues are left for future work.
4. Conclusions
It has been shown that under special immunological conditions ( R0 < 1), it is possible that the infection does not thrive in the body. This situation might be related to the cases of individuals who did not become infected after a situation of risk, and so could be considered when designing a vaccine or any other kind of prophylaxis (such as the use of antiretroviral gel). This will allow people to have their immune system at safe states before falling into risk.
Variations of α and ϒ allow observing that increasing the activation of cytotoxic response, or its effectiveness to destroy infected cells, increases the time between infection outbreaks; however, this also causes wide oscillations in T cells dynamics, which could affect the patient’s health condition. Furthermore, it is obvious that the cytotoxic response, together with a strong activation rate of resting CD4 T cells (variation of Φ ) is effective in reducing infection levels and therefore should not be neglected in the construction of antiretroviral therapy protocols. Further study is necessary to evaluate the effect of the cytotoxic response along with antiretroviral therapy, and also to determine optimal control strategies to ensure the strengthening of the immune system.
References
[1] UNAIDS, WHO. Global Report 2013. Joint United Nations Programme on HIV/ AIDS (UNAIDS) Joint United Nations Programme on HIV/AIDS (UNAIDS). 2013.
[2] C. Lapenta, et al., "Potent Immune Response against HIV-1 and Protection from Virus Challenge in hu-PBL-SCID Mice Immunized with Inactivated Virus-pulsed Dendritic Cells Generated in the Presence of IFN-α". J Exp Med. Jul 21, 2003;198(2): 361–367.
[3] A . Perelson, PW. Nelson PW “Mathematical Analysis of HIV-I: Dynamics in Vivo.”. SIAM Review, Vol. 41, No. 1, pp. 3-44, Mar, 1999.
[4] J. Alcamí J. “Avances en la inmunopatología de la infección por el VIH Enferm Infecc Microbiol Clin”, 2004.
[5] D. Kirschner, “Using Mathematics to Understand HIV Immune Dynamics”, Notices of the AMS, 1996, pp.191-202.
[6] H.D., Toro-Zapata, et al, “Role of Active and Inactive Cytotoxic Immune Response in Human Immunodeficiency Virus Dynamics", Osong Public Health Res Perspect, 2014, pp.3-8.
[7] S. Bonhoeffer , RM May, G. Shaw , MA Nowak, "Virus dynamics and drug therapy, Proc Natl Acad Sci U S A, 94 (1997), pp. 6971-6976.
[8] MA Nowak, RM May, "Virus dynamics. Mathematical principles of immunology and virology". Oxford University Press, 2000.
[9] JM Orellana, "Optimal drug scheduling for HIV therapy efficiency improvement. Biomedical Signal Processing and Control" pp. 379-386, 2011.
[10] B .M. Adams, H.T. Banks H.T., M. Davidian, K. Hee-Dae,H.T. Tran, S.N. Wynne, E.S. Rosenberg, “HIV dynamics: Modeling,data analysis, and optimal treatment protocols”. Journal of Computational and Applied Mathematics, pp. 10-49, 2005.
[11] R .R. Culshaw, S. Ruan, R.J. Spiteri, "Optimal HIV treatment by maximising immune response". J. Math. Biol. pp. 545- 562, 2004.
[12] Panel on Antiretroviral Guidelines for Adults and Adolescents. Guidelines for the use of antiretroviral agents in HIV- 1-infected adults and adolescents. Department of Health and Human Services. January 10, 2011; pp 1-166.
[13] H. Heesterbeek, R0 "Centrum voor Wiskunde en Informatica". Amsterdam. 1992.
[14] L. Perko, “Differential equations and dynamical systems”. New York: Editorial Springer, tercera edición 2001.
1.png)


.jpg)