
DOI:
https://doi.org/10.14483/22487638.17575Publicado:
01-04-2022Número:
Vol. 26 Núm. 72 (2022): Abril - JunioSección:
Estudio de casoUrban Drainage Water Quality Modeling on the SWMM Software, Northeastern Sector, Santa Inés District, Tunja
Modelación de calidad de agua del drenaje urbano en el software SWMM, sector nororiental, Santa Inés, Tunja
Palabras clave:
sewerage, water quality, modeling, SWMM (en).Palabras clave:
alcantarillado, calidad del agua, modelado, SWMM (es).Descargas
Referencias
Amaya-Tequia, E. (2019). Modelización hidráulica de drenaje urbano. Aplicación sector nororiental distrito Santa Inés Tunja-Boyacá [Undergraduate theis, Unversidad Santo Tomás]. http://hdl.handle.net/11634/22086
Cortés, M., & Vera, E. (2019a). Durability considerations for mitigating corrosion caused by biogenic sulfuric acid in sewerage system. Journal of Physics: Conference Series, 1386, 012088. http://dx.doi.org/10.1088/1742-6596/1386/1/012088 DOI: https://doi.org/10.1088/1742-6596/1386/1/012088
Cortés, M., & Vera, E. (2019b). Methodology for simulating the process of microbiologically induced degradation of concrete by chemical exposure of speccimens under controlled laboratory conditions. Journal of Physics: Conference Series, 1386, 012089. https://doi.org/10.1088/1742-6596/1386/1/012089 DOI: https://doi.org/10.1088/1742-6596/1386/1/012089
Cortés-Zambrano, M., Amaya-Tequia, E., & Gamba-Fernández, D. (2020). Implementation of the hydraulic modelling of urban drainage in the northeast sector, Tunja, Boyacá. Revista Facultad de Ingeniería Universidad de Antioquia, 101, 74-83. https://doi.org/10.17533/udea.redin.20200798 DOI: https://doi.org/10.17533/udea.redin.20200798
Gironás, J., Roesner, L. A., & Davis, J. (2009). Storm Water Management Model Applications Manual. United States Environmental Protection Agency. http://nepis.epa.gov/Exe/ZyPURL.cgi?Dockey=P100EA7H.txt
Hogue, T. S., Gupta, H., & Sorooshian, S. (1988). A 'user-friendly' approach to parameter estimation in hydrologic models. Journal of Hydrology, 320(1-2), 202-217. https://doi.org/10.1016/j.jhydrol.2005.07.009 DOI: https://doi.org/10.1016/j.jhydrol.2005.07.009
Pérez-Carmona, R. (2013). Diseño y construccion de alcantarillados sanitario, pluvial y drenaje en carreteras. Ecoe Ediciones.
Rodríguez, J. (2005). Desarrollo y aplicación de un modelo de calidad del agua del interceptor Fucha - Tunjuelos - Canoas [Master's thesis, Universidad de los Andes]. https://repositorio.uniandes.edu.co/bitstream/handle/1992/8998/u270910.pdf?sequence=1
Romero-Rojas, J. A. (2004). Tratamiento de aguas residuales. Escuela Colombiana de Ingeniería Julio Garavito.
Seco, R., & Gómez-Valentín, M. (2011). Aplicación del modelo SWMM 5.0 para la estimación del arrastre de depósitos de sedimentos y contaminantes asociados en sistemas de alcantarillado unitario [Conference presentation]. IWA Spain National Young Water Professionals Conference, Madrid, Spain. http://hdl.handle.net/2117/18111
Temprano, J., & Tejero, I. (2002). Detention storage volume for combined sewer overflow into a river. Environmental Technology, 23(6), 663-675. https://doi.org/10.1080/09593332308618381 DOI: https://doi.org/10.1080/09593332308618381
Roca-Hernández, R. (2012). Estudio de la eliminacion y de la prevencion de la generacion de sulfuros en redes de saneamiento [Master's thesis, Universidad Politecnica de Cartagena]. https://www.upct.es/hidrom/publicaciones/Tesis_pfc/redes_de_saneamiento%20.pdf
Obermann, M., Rosenwinkel, K., & Tournoud, M. (2009). Investigation of first flushes in a medium-sized mediterranean catchment. Journal of Hydrology, 373(3), 405-415. http://dx.doi.org/10.1016/j.jhydrol.2009.04.038 DOI: https://doi.org/10.1016/j.jhydrol.2009.04.038
Marcor, J., & Pedraza, R. (2012). Efectos de la discretización en la simulación de la escorrentía urbana. Ingeniería del Agua, 13(1), 35-46. https://doi.org/10.4995/ia.2006.2882 DOI: https://doi.org/10.4995/ia.2006.2882
Ministerio de Ambiente y Desarrollo Sostenible (2015). Resolución número 0631. Por la cual se establecen los parámetros y los valores límites máximos permisibles en los vertimientos puntuales a cuerpos de aguas superficiales y a los sistemas de alcantarillado público y se dictan otras disposiciones. https://www.rds.org.co/es/recursos/resolucion-631-de-2015-parametros-vertimientos#:~:text=Por%20la%20cual%20se%20establecen,y%20se%20dictan%20otras%20disposiciones.
Ramos-Velandia, C. C. (2017). Evaluacion de un sistema de tratamiento de lodos activados para la remocion de carga organica en las aguas residuales domesticas generadas en el colegio San Viator [Undergraduate thesis, Universidad de América]. https://hdl.handle.net/20.500.11839/6578
U.S. Environmental Protection Agency. (1974). Process Design Manual for Sulfide Control in Sanitary Sewerage Systems. United States of America: EPA.
Cómo citar
APA
ACM
ACS
ABNT
Chicago
Harvard
IEEE
MLA
Turabian
Vancouver
Descargar cita
Recibido: 9 de febrero de 2021; Aceptado: 7 de febrero de 2022
ABSTRACT
Objective:
This research aimed to design a drainage quality hydrodynamic model of the northeastern sector of Tunja (Santa Inés neighborhood), Boyacá, Colombia, which was validated and calibrated by means of the mean square error method, where a comparison between the values observed in the field and the simulation results in the model was determined in order to observe and analyze the effect of precipitation on pollutants before entering the treatment plant.
Methodology:
For this study, rainfall and water flow equipment were installed in the district. A validated and calibrated urban drainage model was created on the SWMM 5.1 software, which allowed a temporal hydrodynamic modeling of the system. In addition, samples were taken to determine the quality of the water arriving at the treatment plant and evaluate the transportation of pollutants, as well as the possibility of hydrogen sulfide generation in the study area.
Results:
The results obtained with the model show that all pollutants generate drag in their concentrations. An excess of these values is observed within the total flow, which demonstrates the relevance of accumulation, washing, and transport processes, in light of the pollutant remnants causing the flow to decrease before the pollutant load.
Conclusions:
Our sampling indicates that it is necessary to analyze the coliforms present in wastewater discharges, as well as the sulfate, nitrite, and nitrate values in the case of a specific discharge. The entity in charge of discharge control must be then informed.
Funding:
Universidad Santo Tomas - Tunja
Keywords:
sewerage, water quality, modeling, SWMM.RESUMEN
Objetivo:
Esta investigación pretendió diseñar un modelo hidrodinámico de calidad de drenaje urbano del sector nororiental de Tunja (barrio Santa Inés), Boyacá, Colombia, calibrado y validado por el método del error cuadrático medio, donde se determinó una comparación entre los valores observados en campo y los resultados de la simulación en el modelo en aras de observar y analizar el efecto de la precipitación sobre los contaminantes antes de ingresar a la planta de tratamiento.
Metodología:
Para el presente estudio se instalaron equipos de precipitación y flujo de agua en el distrito. Se creó un modelo de drenaje urbano validado y calibrado en el programa SWMM 5.1, que permitió obtener la modelización hidrodinámica temporal del sistema. Adicionalmente se tomaron muestras de agua en la red para conocer la calidad de agua que llega a la planta de tratamiento y evaluar el transporte de los contaminantes y la posible generación de sulfuro de hidrógeno en la red de estudio.
Resultados:
Los resultados obtenidos con el modelo muestran que todos los contaminantes generan arrastre de sus concentraciones. Se observa un exceso de estos valores frente al caudal máximo, lo cual demuestra la relevancia de los procesos de acumulación, lavado y transporte, en vista de que el remanente de contaminantes es lo que ocasiona que el caudal disminuya primero que la carga contaminante. Adicional a esto se presenta un análisis en los tramos de concreto en la red para así determinar la posible generación de sulfuro de hidrogeno, como se presenta en la Tabla 6 de este documento.
Conclusiones:
Nuestro muestreo indica que es necesario analizar los coliformes presentes en los vertimientos de aguas residuales, así como los valores de sulfatos, nitritos y nitratos en el caso un vertimiento puntual. Posteriormente se debe informar a la entidad encargada de control de vertimientos.
Financiamiento:
Universidad Santo Tomas, Tunja, Boyacá, Colombia.
Palabras clave:
alcantarillado, calidad del agua, modelado, SWMM.INTRODUCTION
Nowadays, the city of Tunja is experiencing a phenomenon of occupation or alteration of the natural channels of rainwater or runoff that lead these flows to the receiving bodies, thus causing an impact on the drainage since the hydrology of the natural basins is not respected, which affects their drainage capacity. In addition, there is considerable and accelerated urban development in the city’s northeastern sector, which has caused concern due to this and the continuous substitution of drainage surfaces that allow infiltration by hard and impermeable areas, causing overflows and floods that affect the citizens (Amaya-Tequia, 2019).
In a city whose aqueduct and sewerage networks are growing, it is necessary to know the operating behavior of the system. Knowing the hydraulic operation of the networks in real time is a vital tool to identify areas of conflict, vulnerabilities, and risks. Thus, it is also possible to propose prevention measures, dictate alternative solutions, optimize the functioning of the urban drainage system, prevent damage and problems in the structures, prioritize resources, meet contractual targets, and improve the citizens’ quality of life (Gerencia de Planeación y Construcciones, 2017).
The over-dimensioning of the elements of a unitary urban sewerage system, even though it allows the transport of flows collected from rainfall runoff, provides a significant potential for sedimentation of wastewater solids during dry periods. This is because runoff speeds are, in many cases, inadequate to keep them in suspension. As a result, during periods without rainfall, the ducts act as reservoirs for said sediments, thus affecting water quality (Seco & Gómez-Valentín, 2011). Earlier, there was a tendency to not consider water quality aspects in the design and operation of drainage systems. This trend remains in the development of most projects (Rodríguez, 2005)
The management of pollution associated with urban runoff is a difficult problem to solve, especially considering the stochastic nature of rainfall and the hydrological regimes of some rivers (Obermann et al., 2009). The natural channels of some regions have flows whose seasonal differences are significant, which makes them more sensitive to discharges from unit systems at times when the water flow provided by the spillways may be of the same order or greater than the flow rate. The assessment of urban rainwater quality is of great importance for the current approach to integrated urban drainage management. The characteristics of wastewater can be determined in different ways depending on the specific purpose. A sampling software for water characterization and quality control involves careful analysis of the samples type, the number of samples, and the parameters to be studied (Romero-Rojas, 2004).
It is important to know where and how the flows are incorporated into the network in order to be able to analyze their hydraulic behavior. For this reason, together with the Veolia Aguas de Tunja S.A. E.S.P. company, a measurement and modeling of the contaminants present in the water was carried regarding BOD (biological oxygen demand), COD (chemical oxygen demand), lead, TSS (total suspended solids), and nitrogen, with the purpose of improving rainfall drainage to avoid economic, environmental, and public health consequences as a result of climate change and its impact on the design flow of urban drainage systems (Veolia Tunja, 2017)
In addition to the above, an analysis of the possible generation of sulfides is also carried out, since one of the main causes for the deterioration of drainage systems is microbiological corrosion. An example of this is Thiobacillus Thiooxidans, which is also known as Acidthiobacillus thiooxidans, a sulfur-oxidizing organism that has been reported in sewerage systems in several countries including Mexico, the United States, Japan, Belgium, and China. The restoration costs of the concrete elements affected by microbiological corrosion represent a great investment in some countries and cities such as Germany, where it accounts for 40% of the US$100 billion invested in wastewater infrastructure; Belgium, where it accounts for 10% of the total expenditure; and Los Angeles, USA, where approximately US$400 million are invested. It is also estimated that the United States spends around US$25 billion annually on the maintenance of sewerage systems (Cortés & Vera, 2019). The corrosion of concrete structures is very common in the world; it is a silent phenomenon that must be addressed because of the large amount of money that is lost in performing maintenance works (Cortés & Vera, 2019).
METHODOLOGY
1. Area characterization and sampling
Topological base drainage network of the Santa Inés district (Amaya-Tequia, 2019)
Once the activities involving inspection, network cadastre, verification of the connectivity of the system, and identification of initial wells were performed, the delimitation of the Santa Inés district, as indicated in Figure 1, was carried out.
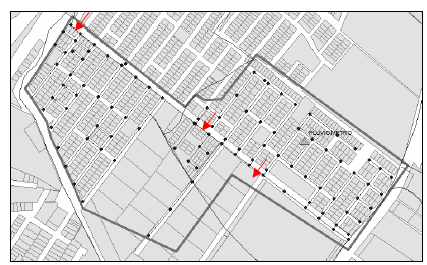
Figure 1: Urban basin of the Santa Inés drainage network
The points where the wastewater sampling was conducted are also indicated in Figure 1. These points were chosen given their location, as they are at the beginning, the middle (where a significant part of the system’s water is collected), and at the end of the network.
2. EPA modeling - SWMM (Gironás et al., 2009)
SWMM’s rainwater management model is a dynamic rain runoff simulation model that calculates quantity and quality mainly in urban areas. It operates in a collection of sub-catchment areas that receive precipitation and generate runoff and polluting loads. Routing transports the runoff through a pipe system, tracking its quality within each sub-uptake and the quality of the water in each pipe during a simulation period composed of multiple time steps.
This software shows how to simulate the accumulation and washing of pollutants in an urban basin. The influence of different land uses on pollutant accumulation is considered, and the average concentrations of events such as exponential functions are used to represent the washing process. The quality of surface runoff is an extremely important but very complex problem in the study of wet climate flows and their environmental impact. SWMM provides a flexible set of mathematical functions that can be calibrated to estimate the accumulation of pollutants on the Earth’s surface during dry weather periods, as well as their release from runoff during storm events.
3. Hydrogen sulfide (US Environmental Protection Agency, 1974)
Hydraulic characterization
Hydraulic characterization of sewage is necessary to determine the correlation between existing and predicted sulfur concentrations. It requires measuring the speed, flow depth, and slope of the sewer, by means of hydraulic relations. The flow rate and depth are obtained at the time of sampling of sulfides.
Speed can be measured through several methods (e.g., flotation speed). The slope of the culvert can be measured on the ground or taken in the form of constructed plans. The actual hydraulic roughness coefficient (n) can be calculated using the Manning Equation (1):
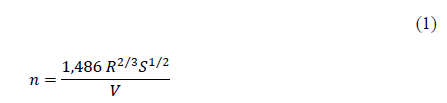
where:
V: average speed ft/s
A: hydraulic radio (ft)
S: slope
N: roughness coefficient
Wastewater characterization
Parameters such as biochemical oxygen demand, pH, temperature, dissolved oxygen, and sulfate need to be controlled; their concentrations can be measured by individual or composite laboratory tests.
The daily mean sulfide concentration and pH values can be calculated by applying a correction factor (which is derived from the diurnal sulfide variation graph) to the sulfide concentrations measured in one day. Since speed is one of the determining factors in the generation of sulfides, it is feasible that all three conditions of possible sulfide generation exist in a pipe at some point within a period of 24 h. Therefore, for definition purposes, the three categories that define the sulfide generation characteristics of a pipeline are based on the average speed for the maximum flow period of 6 h.
Predictive equations
The quantitative Pomeroy and Parkhurst method for the prediction of sulfides has proven its effectiveness in studies conducted in California, Louisiana, and Texas. It was developed and is applicable only for partially filled trunk sewage culverts when conditions are favorable for sulfide accumulation. Since misleading results may be obtained under other conditions, indicators are evaluated to determine whether there is a possibility of sulfide generation before using this method.
Sulfur generation indicators
The recommended method of analysis is to evaluate the formula Z and A/B curves. If any of the indicators shows that conditions are favorable for the generation of sulfides, the Pomeroy and Parkhurst method is used to determine if there is a real problem. If both indicators show no potential for sulfide generation, no further analysis is required.
Z formula
The first equation to express the necessary conditions for sulfide generation in gravity nets was developed in 1946. This formula did not deal with sulfide levels, but merely with whether a build-up of sulfide could occur. In 1950, Davy presented a more complete formula that related the Reynolds number, the BOD5 effectiveness, the flow cross-sectional area, and the surface width. This work was later modified by Pomeroy to develop what is known as the Z formula:
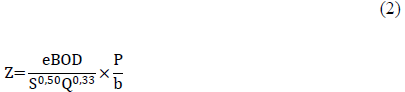
Where:
Z: defined function
eBOD: effective BOD5, (mg/L)
Q: flow rate (ft3/s)
S: slope
P: wet perimeter (ft)
b: width (ft)
Table 1: Interpretation of Z values
Z value
Sulfur condition
Z < 5.000
Sulphur is rarely produced
5.000 ≤ Z ≤ 10.000
Secondary condition for sulfide accumulation
Z > 10.000
Sulfur accumulation is common
RESULTS
1. Characterization
The sewerage system of the neighborhood is of combined nature since the pipe system collects and transports both waste and rainwater. The pipes are built from concrete (96%) and PVC (4%). The outflow well provides the right conditions for the installation of a flow meter, with a depth to level of 1,58 m. The main collector is built from concrete pipe with a diameter of 30 inches. A simultaneous monitoring of rainfall and flow during 4 months was carried out, and the representativeness of these events was executed by cross-referencing the data recorded in the measuring equipment, verifying the magnitude and time of occurrence between hydrograms and hietograms (Amaya-Tequia, 2019). Within the monitoring period (year 2018), six representative rainfall events were captured, the model of this research was implemented on July 16th because sampling was conducted on that day, with the results shown in Table 32 and obtaining a maximum flow of 161,13 l/s.
Source: Authors
Table 2: Rainfall events, precipitated volume, and associated return period
Event
Total rain (mm)
Rainfall volume (m3)
Duration (min)
Intensity (mm/h)
Return period
July 16th
3,75
598,50
35
6,43
< 2 years
Sampling was carried out for 24 h in dry and rainy periods at the established points of the network. During the sampling, in situ parameters such as pH, temperature, and percentage of dissolved oxygen were measured, and the corresponding samples were taken to the laboratory in order to analyze the other parameters. Tables 3, 4, and 5 present the results at each of the sampling points in the study area.
Source: Authors
Table 3: Results for point 3955
Parameter
Method
Units
Dry period
Rainy period
BOD-5
SM5210 B
mg O2/L
315,6
96
COD
SM 5220 B
mg O2/L
522,16
481
Chlorides
SM 4500-CL-D
mg Cl-/L
60,69
52,0
pH
SM 4500-H-B
6,94
7,96
TSS
SM 2540-D
mg/L
132,5
86,0
Sulfates
SM 4500-SO4-E
mg SO4-/L
61,90
68,9
Sulfides
SM 4500 S2-F
mg S-/L
<4
350
Source: Authors
Table 4: Results for point 3910
Parameter
Method
Units
Dry period
Rainy period
BOD-5
SM5210 B
mg O2/L
372,15
267
COD
SM 5220 B
mg O2/L
541,86
481
Chlorides
SM 4500-CL-D
mg Cl-/L
53,55
37
pH
SM 4500-H-B
6,89
8,10
TSS
SM 2540-D
mg/L
115
85
Sulfates
SM 4500-SO4-E
mg SO4-/L
44,90
63,7
Sulfides
SM 4500 S2-F
mg S-/L
<4
294
Source: Authors
Table 5: Results for point 4091
Parameter
Method
Units
Dry period
Rainy period
BOD-5
SM5210 B
mg O2/L
365,165
321
COD
SM 5220 B
mg O2/L
522,16
518
Chlorides
SM 4500-CL-D
mg Cl-/L
60,69
41
pH
SM 4500-H-B
7,04
7,04
TSS
SM 2540-D
mg/L
117,5
30
Sulphates
SM 4500-SO4-E
mg SO4-/L
74,05
86,9
Sulphides
SM 4500 S2-F
mg S-/L
<4
385
2. SWMM model
To this date, there are several studies on modeling sewerage systems. It has been deduced that the spatial simplification scale influences the results of the SWMM simulation (Marcor & Pedraza, 2012). The total concentration time of the urban watershed of the study area was estimated via the Carter method at 21,60 minutes, considering the weighted average slope of sub-basins and the main length of the flow (Amaya-Tequia, 2019).
In 2012, a study was conducted with the purpose of determining specific quality patterns of the behavior of the sewerage system of a sector in Catalonia, where the unitary network was calibrated and validated with data of rainfall episodes. For ease of access, the SWMM software and the variables adopted in the simulation were tailored when performing the calibration and validation of the proposed model (Seco & Gomez-Valentín, 2011). This model treats each basin as a non-linear reservoir obtained by the continuity and the Manning equation for each sub-basin (Hogue, et al., 1988). Figure 2 presents the continuity of the simulated runoff in the model.
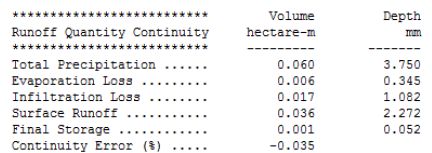
Figure 2: Runoff continuity
Figure 3 shows the runoff quality in the continuity balance throughout the study area. Input loads are expressed as "Initial Buildup" prior to the start of the simulation, "Surface Buildup" during the dry period, and "Wet Deposition" pollutants in the rain. The output loads include "Infiltration Loss", generated by direct rain; "Surface Runoff", the pollutant load which includes a portion of accumulation; and the continuity report, indicated by "Remaining Buildup".
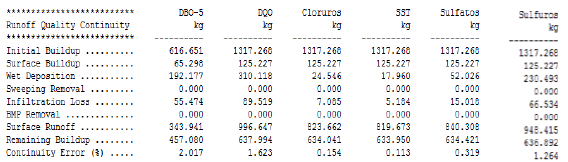
Figure 3: Runoff quality in the study area
Figure 4 shows the quality routing. Only runoff loads through the transport system are shown. Dry weather is not shown; it is only supplied by the user through external inputs. Therefore, the three variables represented are "Wet Weather Inflow", "External Outflow", and "Final Stored Mass". The entry for wet weather is the same.
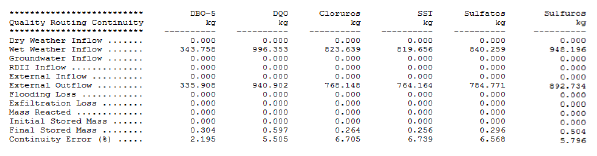
Figure 4: Routing quality
Figure 5 compares the results of the measured flow with respect to the different pollutants established in the model at the point at the outlet of the basin. For all pollutants, the concentrations exceeded the maximum flow, thus demonstrating the initial analysis in which the importance of the accumulation, washing, and transport processes was mentioned, given that it is the remains of the pollutants generated that affect the flow.
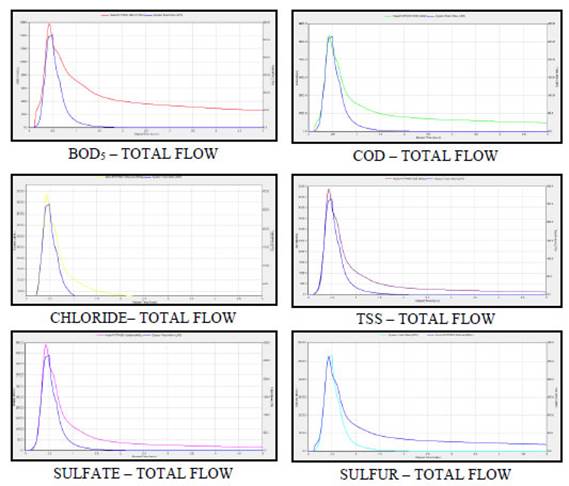
Figure 5: Behavior of pollutants and total flow during a rainfall event
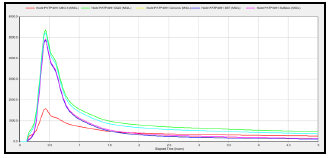
Figure 6: Comparison of pollutants evaluated in a rainfall event
Figure 6 shows the behavior of all the pollutants studied in a rainy period. It is evident that BOD5 has a lower concentration than the others and COD is the one with the highest concentration.
2. Hydrogen sulfide prediction
Table 6 shows the results of all sections of the study area. Green indicates that sulfide is rarely produced; yellow indicates a probability that it will occur; and red shows hydrogen sulfide accumulation.
Fuente: Authors
Table 6: Hydrogen sulfide production probability
Tranche
eBOD5 (mg/l)
S
Flow rate (ft3/s))
P (ft)
b (ft)
Z
PATLAL4741
2,73
0,0028
0,0074
0,85
0,772
286,948
PATLAL4742
785,70
0,0072
0,3517
1,15
1,008
14.961,449
PATLAL4743
699,03
0,0047
0,3510
1,74
1,274
19.732,557
PATLAL4744
61,98
0,0054
0,3687
2,19
1,306
1.959,816
PATLAL4745
452,33
0,0013
0,1928
1,22
1,050
25.010,071
PATLAL4746
377,38
0,0026
0,0773
1,08
0,962
19.325,388
PATLAL4747
0,00
0,0070
0,0000
0,33
0,320
0,000
PATLAL4748
0,00
0,0060
0,0000
0,00
0,035
0,000
PATLAL4749
484,43
0,0004
0,1056
1,18
1,030
55.131,607
PATLAL4750
641,96
0,0029
0,2525
0,15
1,179
2.428,179
PATLAL4751
80,70
0,0136
0,3524
1,74
1,274
1.334,034
PATLAL4752
717,51
0,0018
3,0452
3,21
2,394
15.509,457
PATLAL4754
853,94
0,0012
2,7259
3,16
2,379
23.519,386
PATLAL4757
0,00
0,0050
0,0000
0,37
0,366
0,000
PATLAL4758
0,00
0,0083
0,0064
1,04
0,937
0,000
PATLAL4759
32,86
0,0029
0,0675
1,55
1,214
1.898,148
PATLAL4760
48,38
0,0046
0,2892
2,27
1,296
1.878,098
PATLAL4761
921,83
0,0017
3,9376
3,41
2,443
20.049,830
PATLAL4762
887,79
0,0006
4,0877
3,31
2,421
30.969,852
PATLAL4763
913,54
0,0000
4,3991
3,16
2,379
0,000
PATLAL4764
5,54
0,0035
0,0650
1,77
1,280
320,329
PATLAL4765
874,58
0,0032
4,5093
3,36
2,432
13.064,168
PATLAL4766
48,20
0,0021
0,2140
2,86
2,176
2.319,844
PATLAL4768
590,94
0,0042
0,1900
1,41
1,203
18.467,157
PATLAL4769
0,00
0,0039
0,0000
0,65
0,623
0,000
PATLAL4771
862,19
0,0009
4,6746
3,67
2,481
25.334,140
PATLAL4772
60,10
0,0028
0,3945
2,33
1,286
2.816,970
PATLAL4773
463,27
0,0020
0,2214
1,25
1,069
19.934,308
PATLAL4774
0,00
0,0009
0,0000
0,61
0,573
0,000
PATLAL4775
974,49
0,0066
0,2472
1,15
0,967
22.679,642
PATLAL4776
0,00
0,0053
0,0000
0,66
0,623
0,000
PATLAL4777
0,00
0,0205
0,0000
0,00
0,035
0,000
PATLAL4778
0,00
0,0025
0,0000
0,00
0,030
0,000
PATLAL4779
828,45
0,0031
0,2338
1,15
0,967
28.491,066
PATLAL4780
402,73
0,0029
0,2137
1,15
1,008
14.134,925
PATLAL4781
40,38
0,0034
0,3803
2,01
1,311
1.452,415
PATLAL4782
873,11
0,0018
4,9479
3,67
2,481
17.733,161
PATLAL4783
863,97
0,0006
5,2470
3,62
2,476
29.716,490
PATLAL4784
0,00
0,0037
0,0000
0,78
1,134
0,000
PATLAL4785
36,42
0,0037
0,3489
1,90
1,303
1.236,264
PATLAL4787
870,89
0,0027
5,5373
3,62
2,476
13.859,458
PATLAL4788
879,92
0,0015
5,7527
3,62
2,476
18.495,793
PATLAL4789
875,06
0,0018
5,7255
3,52
2,461
16.470,123
PATLAL4790
27,54
0,0073
0,2080
2,15
1,142
1.018,695
PATLAL4791
307,30
0,0012
0,2211
1,18
0,926
18.608,470
PATLAL4792
1.030,76
0,0020
0,2483
1,87
1,146
59.200,972
PATLAL4794
1.267,01
0,0040
0,2444
1,33
1,053
40.473,978
PATLAL4795
0,00
0,0035
0,0000
0,70
0,657
0,000
PATLAL4796
31,83
0,0053
0,2352
1,69
1,143
1.037,811
PATLAL4797
0,00
0,0029
0,0000
0,74
0,689
0,000
PATLAL4798
0,00
0,0037
0,0000
0,00
0,035
0,000
PATLAL4799
0,00
0,0025
0,0000
0,00
0,035
0,000
PATLAL4800
0,00
0,0057
0,0000
0,00
0,035
0,000
PATLAL4801
0,00
0,0047
0,0000
0,00
0,031
0,000
PATLAL4802
0,00
0,0035
0,0000
0,00
0,035
0,000
PATLAL4803
0,00
0,0018
0,0000
0,00
0,035
0,000
PATLAL4804
0,00
0,0019
0,0000
0,70
0,657
0,000
PATLAL4805
641,97
0,0044
0,2066
1,12
0,951
19.181,969
PATLAL4806
836,67
0,0027
0,3704
1,55
1,120
31.057,307
PATLAL4807
0,00
0,0053
0,0000
0,40
0,392
0,000
PATLAL4809
22,86
0,0040
0,0346
1,16
0,917
1.379,208
PATLAL4810
57,18
0,0086
0,3931
2,04
1,125
1.518,157
PATLAL4811
925,85
0,0042
6,1080
3,26
2,408
10.606,031
PATLAL4994
70,92
0,0108
0,2617
2,01
1,311
1.627,460
PATLAL4995
501,12
0,0020
0,1208
1,31
1,105
27.077,951
PATLAL4996
105,79
0,0100
0,2850
1,98
1,310
2.424,133
PATLAL4997
654,80
0,0014
0,1649
1,49
1,191
39.640,400
PATLAL4998
1.025,13
0,0035
0,1896
1,12
0,986
33.712,539
PATLAL4999
0,00
0,0046
0,0000
0,00
0,035
0,000
PATLAL5000
0,00
0,0034
0,0000
0,00
0,035
0,000
PATLAL5001
0,00
0,0032
0,0000
0,75
0,712
0,000
PATLAL7594
40,84
0,0007
0,0046
0,66
0,623
9.346,264
PATLAL7595
0,00
0,0022
0,0000
0,46
0,450
0,000
PATLAL7596
540,94
0,0062
0,0791
0,81
0,746
17.278,768
PATLAL7597
0,00
0,0047
0,0000
0,61
0,586
0,000
PATLAL7598
1.077,87
0,0062
0,1190
0,85
0,772
30.387,260
PATLAL7599
364,71
0,0010
0,1151
1,18
1,030
27.500,090
PATLAL7600
1.070,14
0,0038
0,3535
1,34
1,121
29.416,646
PATLAL7601
434,09
0,0101
0,3496
1,28
1,087
7.212,652
PATLAL7604
0,00
0,0054
0,0000
0,81
0,746
0,000
PATLAL7606
0,00
0,0044
0,0000
0,57
0,545
0,000
PATLAL7607
1.038,02
0,0018
0,0646
0,85
0,772
66.811,409
PATLAL7608
245,85
0,0024
0,0600
0,91
0,820
14.086,141
PATLAL7609
709,01
0,0051
0,2211
1,01
0,882
18.706,940
PATLAL7610
1.001,47
0,0145
0,3563
1,18
1,030
13.436,455
PATLAL7612
680,12
0,0024
0,4248
1,84
1,677
20.397,905
PATLAL7613
671,07
0,0039
0,7674
2,12
1,873
13.211,050
PATLAL7615
908,96
0,0014
1,3003
2,37
2,031
26.256,416
PATLAL7616
572,65
0,0016
1,4592
2,61
2,159
15.333,006
PATLAL7619
872,21
0,0028
2,5246
2,89
2,285
15.472,388
PATLAL7620
0,00
0,0038
0,0000
0,52
0,501
0,000
PATLAL7621
311,75
0,0014
0,0650
0,95
0,842
23.382,543
PATLAL7622
854,89
0,0026
0,2260
1,18
1,030
31.519,325
PATLAL7623
353,90
0,0019
0,2468
1,34
1,121
15.548,603
PATLAL7624
851,85
0,0040
0,7999
1,55
1,214
18.593,306
PATLAL7625
263,12
0,0081
0,8013
1,82
1,291
4.449,585
PATLAL7626
71,53
0,0042
0,0321
0,81
0,746
3.718,041
PATLAL7627
84,73
0,0033
0,0300
0,89
0,821
5.086,538
PATLAL7628
384,87
0,0016
0,1010
1,08
0,962
23.324,631
PATLAL7629
0,00
0,0073
0,0000
0,23
0,227
0,000
PATLAL7630
0,00
0,0067
0,0000
0,65
0,623
0,000
PATLAL7631
0,00
0,0087
0,0000
0,40
0,392
0,000
PATLAL7632
5,24
0,0020
0,0028
0,78
0,719
877,806
PATLAL7633
318,60
0,0018
0,1596
1,23
1,007
16.701,222
PATLAL7634
277,06
0,0015
0,3348
1,43
1,088
13.416,357
PATLAL7635
922,40
0,0006
0,2458
1,22
1,050
70.174,637
PATLAL7636
158,64
0,0140
0,2437
1,15
1,008
2.435,488
PATLAL9265
229,37
0,0039
0,0406
0,75
0,712
11.200,975
PATP4812
0,00
0,0080
0,0000
0,00
0,076
0,000
Oxygen influence on sulphur generation (Roca-Hernández, 2012)
In a sewer system that circulates by gravity, water is aerated. This process can be slow in large collectors due to the gentle slope and flow depth. The rate increases in smaller pipes, and this does not happen in pressure systems, so the oxygen is consumed in a shorter time, thus yielding a higher concentration of sulfides. Oxygen is consumed by microorganisms present in the body of water (in the biofilm of the pipes), and the rate of consumption and oxygen can vary depending on the distance that the wastewater has to travel due to the diffusion in the biologically active film of the pipe wall.
The structure of the biofilm is formed by several layers, with an aerobic and an anaerobic zone. If the former prevails, the conditions will be given for sulfate reduction to occur. The relationship between these zones is delimited by the concentration of organic matter. If the oxygen concentration in the current is close to zero, then not all the sulfide can be oxidized and passed into the current.
CONCLUSIONS
The behavior of the physicochemical and microbiological characteristics measured along the sewerage network at the three established points evidences that there is spatial uniformity in the analyzed parameters and that there is little variability in their behavior when the first wash occurs at each point. All this, considering the results indicated in Tables 4, 5, and 6.
The design of the hydrodynamic model of urban drainage quality of the northeastern sector of Tunja, Santa Inés neighborhood, was performed, calibrated, and validated via the SWMM 5.1 software based on data obtained in the field.
The implementation of the model allowed concluding that the sewerage of the city of Tunja, despite being combined, and considering the current dumping regulations in Colombia, namely Resolution 0631 of 2015 (Ministerio de Ambiente y Desarrollo Sostenible, 2015) which indicates the maximum allowable values for any type of dumping, requires prior treatment to avoid contamination in the dry period. As indicated by the rule, the maximum allowed value for suspended solids is 90 mg/L. This limit was exceeded in all three points. During the rainy period, although the value was not exceeded at the two points near the exit, it was very close to the limit: 85 and 86 mg/L, respectively.
It is recommended that treatment alternatives be considered in the activated sludge process, based on the relationship between BOD and COD, since waste can be degraded through a biological process (Ramos-Velandia, 2017).
Given that the Z formula has generally been successful in predicting the occurrence of sulfide problems in gravity sewers, for our network, specifically with 96% of the pipelines, approximately 48% show no likelihood of sulfur generation. For pipelines that are likely to generate hydrogen sulfide, it is recommended to ensure proper aeration in order to avoid gas accumulation.
REFERENCES
Licencia
Esta licencia permite a otros remezclar, adaptar y desarrollar su trabajo incluso con fines comerciales, siempre que le den crédito y concedan licencias para sus nuevas creaciones bajo los mismos términos. Esta licencia a menudo se compara con las licencias de software libre y de código abierto “copyleft”. Todos los trabajos nuevos basados en el tuyo tendrán la misma licencia, por lo que cualquier derivado también permitirá el uso comercial. Esta es la licencia utilizada por Wikipedia y se recomienda para materiales que se beneficiarían al incorporar contenido de Wikipedia y proyectos con licencias similares.