
DOI:
https://doi.org/10.14483/22487638.17743Publicado:
01-04-2022Número:
Vol. 26 Núm. 72 (2022): Abril - JunioSección:
InvestigaciónModelado del fenómeno de remoción de masa para determinar la profundidad de infiltración de la lluvia en el suelo
Modeling of Mass Movement Phenomena to Determine the Depth of Rainfall Infiltration into the Soil
Palabras clave:
humedad del suelo, dinámica de sistemas, deslizamientos, lluvia crítica (es).Palabras clave:
soil moisture, system dynamics, landslides, critical rain (en).Descargas
Referencias
Alcántara, I. (2002). Geomorphology, natural hazards, vulnerability and prevention of natural disasters in developing countries. Geomorphology, 47, 107-124. https://doi.org/10.1016/S0169-555X(02)00083-1 DOI: https://doi.org/10.1016/S0169-555X(02)00083-1
Aracil, J., & Gordillo, F. (1997). Dinámica de sistemas. Alianza Editorial.
Arévalo-Algarra., H. M., Perico-Granados., N. R., Reyes-Rodríguez., C. A., Vera., C. M., Monroy., J., & Perico-Martínez., C. (2021). Sitios de inundaciones causadas por los ríos La Vega y Jordán, Tunja (Boyacá). Tecnura, 25(67), 86-101. https://doi.org/10.14483/22487638.15248 DOI: https://doi.org/10.14483/22487638.15248
Barrantes, G., Barrantes, O., & Núñez, O. (2011). Efectividad de la metodología Mora – Vahrson modificada en el caso de los deslizamientos provocados por el terremoto de Cinchona, Costa Rica. Revista Geográfica de América Central, 2(47), 141-162. https://www.revistas.una.ac.cr/index.php/geografica/article/view/3970
Aristizábal, E., Gamboa, M., & Leoz, F. (2010). Sistema de alerta temprana por movimientos en masa inducidos por lluvia para el valle de Aburrá. Revista EIA, 13, 155-169. https://www.redalyc.org/articulo.oa?id=149213727011
Berry, P., & Reid, D. (1993). Mecánica de Suelos. McGraw-Hill.
Braja, D. (2015). Fundamentos de ingeniería geotécnica. Thomson.
Castro, E., Valencia, A., Ojeda, J., Muñoz, F., & Fonseca, S. (2014). Evaluación del riesgo por fenómenos de remoción en masa, guía metodológica. Editorial Escuela Colombiana de Ingeniería.
Castro-Garzón., H. Torres-Flórez., D., & Gallardo-Lichaa., N. J. (2020). Análisis de la intervención antrópica en cuerpos de agua: caso caño Banderas, en el municipio Puerto López (Meta, Colombia). Tecnura, 24(65) 77-84. https://doi.org/10.14483/22487638.15772 DOI: https://doi.org/10.14483/22487638.15772
Chaparro, F., & Pedraza, J. (2012). Análisis de las propiedades geotécnicas (gravimétricas y volumétricas) de los suelos en los sitios afectados por fenómeno de remoción en masa de la zona urbana de Pamplona (Colombia) [Undergraduate thesis, Universidad de Pamplona].
Cuanalo-Camposa, O. A., & Gallardo-Amaya, R. J. (2016). Fenómenos de remoción en masa. Acciones para reducir la vulnerabilidad y el riesgo. Vector, 11, 30-38. http://vector.ucaldas.edu.co/downloads/Vector11_5.pdf
Fell, R., Corominas, J., Bonnard, C., Cascini, L., Leroi, E., & Savage, W. (2008). Guidelines for landslide susceptibility, hazard and risk zoning for land-use planning. Engineering Geology, 102, 99-111. https://doi.org/10.1016/j.enggeo.2008.03.014 DOI: https://doi.org/10.1016/j.enggeo.2008.03.014
Forrester, J. (1997). Industrial dynamics. Journal of the Operational Research Society, 48(10), 1037-1041. https://doi.org/10.1057/palgrave.jors.2600946 DOI: https://doi.org/10.1057/palgrave.jors.2600946
Guzzetti F. (2000). Landslide fatalities and the evaluation of landslide risk in Italy. Engineering Geology, (58), 89-107. Doi: 10.1016/S0013-7952(00)00047-8 DOI: https://doi.org/10.1016/S0013-7952(00)00047-8
Instituto de Hidrología, Meteorología y Estudios Ambientales (IDEAM) (2015). Estudio nacional del Agua 2014. IDEAM.
Instituto Colombiano de Geología y Minería & Corporación Autónoma Regional del Valle del Cauca (INGEOMINAS-CVC) (2001). Evaluación del riesgo por fenómenos de remoción en masa - Guía metodológica (1st ed.). Escuela Colombiana de Ingeniería.
Lara, M., & Sepúlveda, S. (2008). Remociones en masa, apuntes del curso. Universidad de Chile.
Ministerio de Ambiente, Vivienda y Desarrollo Territorial (2010). Reglamento colombiano de construcción sismo-resistente. Asociación Colombiana de Ingeniería Sísmica.
Montoya-Armenta., L. H., & Rodríguez-Díaz., Y. J. (2020). Efectos de las crecidas en el transpor¬te de material particulado y carbono orgánico. Caso del río Oka (País Vasco, España). Tecnura, 24(65), 64-76. https://doi.org/10.14483/22487638.15759 DOI: https://doi.org/10.14483/22487638.15759
Montzka, S. A., Dlugokencky, E. J., & Butler, J. H. (2011). Non-CO2 greenhouse gases and climate change. Nature, 476, 43-50. https://doi.org/10.1038/nature10322 DOI: https://doi.org/10.1038/nature10322
Mora, R., Chaves, J., & Vázquez, M. (2002). Zonificación de la susceptibilidad al deslizamiento: resultados obtenidos para la Península de Papagayo mediante la modificación del método Mora-Vahrson. Universidad de Costa Rica.
Mora, S., & Vahrson, W. (1994). Macrozonation methodology for landslide hazard determination. Environmental and Engineering Geoscience, XXI(1), 49-58. https://doi.org/10.2113/gseegeosci.xxxi.1.49 DOI: https://doi.org/10.2113/gseegeosci.xxxi.1.49
Quesada, A., & Feoli, S. (2018). Comparación de la metodología Mora-Vahrson y el método morfométrico para determinar áreas susceptibles a deslizamientos en la microcuenca del Río Macho, Costa Rica. Revista Geográfica de América Central 2(61), 17-45. https://doi.org/10.15359/rgac.61-2.1 DOI: https://doi.org/10.15359/rgac.61-2.1
Quintana-Cabeza, C. (2014). Modelamiento de la amenaza relativa por fenómenos de remoción en masa en el sector urbano de Pamplona, Colombia, aplicando un complemento a la metodología Mora & Vahrson [Master’s thesis, Universidad de Pamplona].
Rodríguez-Mejía, C. A., Bustos-Castelblanco, D. E., Cadena-Acevedo, A., & Salazar-Henao, D. M. (2019). Evaluación del riesgo por movimientos de remoción en masa activados por procesos de precipitación, estudio de caso vía Chagualá-Quindío. Revista de Investigaciones Universidad del Quindío, 31(1), 7-14. https://doi.org/10.33975/riuq.vol31n1.239 DOI: https://doi.org/10.33975/riuq.vol31n1.239
Rodríguez-Solano, J. G, Quintana-Cabeza, C. D., Rivera Alarcón, H. U., & Mosquera Téllez, J. (2013). Zonificación del peligro de remoción en masa en las zonas urbanas según método de análisis Mora y Vahrson: estudio de caso. Revista Ambiental, Agua, Aire y Suelo 4(1), 13-22. https://doi.org/10.24054/19009178.v1.n1.2013.146
Román, D., & Chio, G. (2018). Análisis de modelos de deslizamiento en bloque para predecir el comportamiento dinámico del fenómeno de remoción en masa: modelo uniparamétrico y modelo biparamétrico. Boletín de Geología, 40(2), 113-124. https://doi.org/10.18273/revbol.v40n2-2018007 DOI: https://doi.org/10.18273/revbol.v40n2-2018007
Servicio Geológico Colombiano (SGC) (2016). Guía metodológica para estudios de amenaza, vulnerabilidad y riesgo por movimientos en masa (1st ed). SGC. https://libros.sgc.gov.co/index.php/editorial/catalog/book/32
Servicio Geológico Colombiano (SGC) (2017). Guía metodológica para la zonificación de amenaza por movimientos en masa escala 1: 25.000. https://www2.sgc.gov.co/Archivos/GM(2017).pdf
Soeters, R., & van Westen, J. (1996). Slope instability recognition, análisis and zonation. In: A. K. Turner & R. L. Schuster (Eds.), Landslides: Investigation and Mitigation (pp. 129-177). National Academic Press.
Cómo citar
APA
ACM
ACS
ABNT
Chicago
Harvard
IEEE
MLA
Turabian
Vancouver
Descargar cita
Recibido: 25 de mayo de 2021; Aceptado: 7 de febrero de 2022
ABSTRACT
Context:
Establishing a dynamic model of the water precipitation intensity-soil porosity and infiltration speed system offers the possibility of measuring the depth of water infiltration and soil moisture that produce landslides.
Methodology:
By applying system dynamics, a causal diagram of the geotechnical variables of two samples from sites affected by the mass movement phenomena in Pamplona (Colombia) was developed. The model was implemented using the Stella v9 software.
Results:
The simulation results show the variation of soil depth to be saturated in order to reach the liquid limit or a failure due to shear stress.
Conclusions:
The relation between mass movement and precipitation does not coincide with the current collective imaginary, but it depends on a characteristic set of precipitation values for each soil type.
Financing:
This research was funded with the authors’ own resources.
Keywords:
soil moisture, system dynamics, landslides, critical rain.RESUMEN
Contexto:
El establecimiento de un modelo dinámico del sistema intensidad de precipitación de agua-porosidad del suelo y velocidad de infiltración ofrece la posibilidad de medir la profundidad de infiltración de agua y de humedad en el suelo que producen el deslizamiento.
Metodología:
Aplicando la dinámica de sistemas, se desarrolló un diagrama causal de las variables geotécnicas de dos muestras de suelo de sitios afectados por fenómenos de remoción en masa en Pamplona (Colombia). El modelo fue implementado con el software Stella v9.
Resultados:
Los resultados de simulación muestran la variación de profundidad de suelo a saturar para alcanzar el límite líquido o la falla debido al esfuerzo cortante.
Conclusiones:
La relación entre el fenómeno de remoción en masa y precipitación no coincide con el imaginario colectivo actual, sino que depende de un conjunto característico de valores de precipitación para cada tipo de suelo.
Financiamiento:
La investigación fue financiada con recursos propios de los autores
Palabras clave:
humedad del suelo, dinámica de sistemas, deslizamientos, lluvia crítica.INTRODUCTION
There are several methodologies used to study and zone mass movement phenomena, such as uniparametric and biparametric models (Román & Chio, 2018), analyzing hydroclimatological, geological, physical, geometric, and mechanical parameters, or risk factor estimation (Rodríguez-Mejía et al., 2019). Some of these methodologies assume that the occurrence of the phenomenon is due to the effect of high-intensity rainfall on the affected area; they also assume that the variable that measures soil moisture depends only on the intensity of rainfall and also confuse the geotechnical concept of saturation with moisture. In Mora and Varhson's methodology, the soil moisture factor is directly related to monthly average precipitation values without further geotechnical considerations (INGEOMINAS-CVC, 2001). In addition, several researchers have complemented this methodology by incorporating other variables (Rodríguez-Solano et al., 2013; Barrantes et al., 2011).
In this study, by means of mathematical models complemented by the system dynamics methodology (Aracil & Gordillo, 1998), together with the use of simulation software and through the evaluation of the variables proposed in the American Society of Testing Materials (ASTM), a model was implemented for variables such as liquid limit (ASTM 423-66), saturated specific gravity, unit weights of solids and water, unit volumes of water and voids, porosity, cohesion, internal friction angle, permeability coefficient (ASTM D2434-68), and slope gradient regarding two soil samples from sites affected by landslide phenomena in Pamplona, Colombia.
The gravimetric moisture of the soil mass and the relative specific weight of the solids, as proposed in ASTM D2216-71 and ASTM D854-58, respectively, were characterized in the laboratory in order to calculate the gravimetric and volumetric ratios for the following variables: void ratio, porosity, and degree of saturation. The units of measurement used in the mathematical model are grams (g), centimeters (cm), and seconds (s).
Simulation assumptions consist of rainfall intensities of 0,002350, 0,001347, and 0,000181 cm/s, durations of 900 and 21.600 s, and a slip safety factor of 1 (Montzka, 2011; Rodríguez-Solano et al., 2013).
As shown by the simulation results, the saturation depth for the liquid limit to be reached in the entire soil mass does not vary in the soils, nor does the saturated depth at which shear failure occurs.
The system dynamics analysis concluded that the landslide phenomenon does not occur exclusively because of high-intensity rainfall or the frequency between rainfalls, but because the liquid limit value in the soil mass or shear failure is reached due to the duration of the rainfall.
This article shows a fraction of the work developed with the aim of providing another way for estimating the soil moisture factor within the aforementioned methodology.
METHODOLOGY
Mass movement phenomena
In Colombia, mass movement phenomena occur relatively frequently (Cuanalo-Camposa & Gallardo-Amaya, 2016) and mainly in rainy seasons. In the last few years, it has become important to conduct research on these phenomena due to the alleged increase in the frequency of their occurrence due to increased rainfall or to the perception of increased loss of life or materials each time they occur (INGEOMINAS-CVC, 2001). Not all cases of mass movement phenomena are caused by the action of nature; anthropogenic action also contributes to their occurrence, to the extent that “human activities alter landscapes’ evolutionary processes and shape their natural forms” (Castro-Garzón et al., 2020, p. 78).
A mass movement or mass wasting phenomenon, can be understood as any movement of soil mass by the action of the force of gravity (SGC, 2016) with a downward character (Lara & Sepúlveda, 2008). These movements involve slope-forming materials under the influence of gravity, without the primary assistance of any fluid transport agent (SGC, 2017). The flow of soil dissolved in water, which is known as an avalanche, should also be considered to be a mass movement phenomenon (Quesada & Feoli, 2018).
The classifications of mass movement phenomena are based on morphological aspects of the fault surface, the area of occurrence, movement velocity, volume moved, and materials involved, among others (Alcántara & Ayala, 2002). The most accepted and well-known classification is the one formulated by Varnes in 1978, which uses the type of movement and the material involved as criteria (Fell et al., 2008).
It is important to determine the threat points of mass movement phenomena in order to regulate land use in territories and define prevention mechanisms (Fell et al., 2008; Aristizábal et al., 2010). Depending on the level of precision required for the evaluation and zoning of said phenomena, there are several methodologies that always relate internal factors of the slope and external factors that trigger the occurrence of the events (Guzzetti, 2000).
According to the Colombian Geological Survey (SGC), the geological, geomorphological, land cover, and land use aspects that condition landslide hazards are inherent to each study area and establish the “predisposition of the terrain to the occurrence of mass movements” (SGC, 2017, p. 19).
Considering the urgency of contributing to the solution of environmental conflicts and disaster risk management (Perico-Granados et al., 2021), the correct mapping of phenomena associated with the risk of slope instability must contemplate information related to the “spatial and temporal probability of occurrence, type, magnitude, speed, travel distance and limit of retrogressive advance of mass movements” (Soeters & Van Westen, 1996). However, in practice, these aspects are not taken into account due to lack of resources for a detailed characterization of the slope.
The SGC (formerly INGEOMINAS), which is part of the National System of Science, Technology, and Innovation (SNCTI), classifies the FRM zoning methods (Castro et al., 2014) as implicit, semi-implicit, empirically explicit, semi-analytically explicit, or analytically explicit according to the way in which the internal or external factors are synthesized to obtain the landslide hazard map.
The Mora and Varhson methodology
This methodology was developed in Costa Rica by Sergio Mora and Wilhelm-Guenther Varhson in 1994 to classify landslide hazard in a given area or region using morpho-dynamic terrain indicators (Mora & Vahrson, 1994; Alcántara & Ayala, 2002). The methodology requires five factors; a combination of three of them (slope, lithology, and soil moisture) are defined as intrinsic factors and the rainfall and seismic intensity of the study area as extrinsic factors.
The SGC classification is an explicit empirical method because internal and external factors are represented by a numerical value assigned by an expert in order to indicate their degree of contribution to ground instability. These values are totaled and divided by ranges to determine the different threat levels (INGEOMINAS-CVC, 2001).
The combination of these factors is expressed as Equation (1), where H stands for hazard or degree of landslide susceptibility:
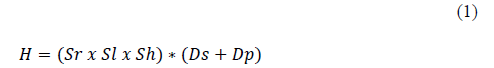
In this Equation, Sr is the relative relief, Sl the lithology, and Sh the soil moisture. The triggering or external factors are seismicity (Ds) and precipitation intensity (Dp).
Landslide susceptibility due to seismicity and precipitation intensity can be established by multiplying the product of the intrinsic factors (Sr, Sl, Sh) by each of the external factors (Ds, Dp).
The relative relief factor (Sr) involves the topographic conditions of the terrain regarding the elevations and slope angles on the surface. The methodology establishes classification ranges for the different slope values that are finally represented in numerical values from 0 to 5.
The lithology (Sl) establishes the influence of the different types of soils and rocks on the occurrence of landslides. Based on the geological maps of the area, the different lithological formations are taken into account and, according to their characteristics, they are assigned a numerical value ranging from 0 to 5.
The soil moisture (Sh) factor aims to quantify the water retained in the soil. It indicates the amount of infiltrated water that remains in the subsoil, filling the soil particles. This parameter is calculated by using monthly rainfall averages from pluviometric stations located in the study area (Table 1).
Source: Rodríguez-Solano et al. (2013)
Table 1: Values assigned to the monthly rainfall averages
Assigned value for
0
1
2
Monthly average rainfall (mm/month)
>125
125-250
>250
The monthly averages are assigned the values in Table 2 and totaled for the twelve months of the year, thus obtaining a value between 0 and 24 units, later assigning the value of the soil moisture parameter (Sh), as established in Table 2.
Source: Rodríguez-Solano et al. (2013)
Table 2: Evaluation of the soil moisture parameter (Sh)
Sum of the values assigned to each month
Description
Parameter rating
0-4
Very low
1
5-9
Low
2
10-14
Average
3
15-19
High
4
20-24
Very high
5
Note that the soil moisture factor does not depend on any geotechnical variable. For the seismic activity (Ds) factor, the use of the modified Mercalli intensity scale is considered to be adequate, and, for the precipitation (Dp) factor, a value between 1 and 5 is selected, which corresponds to the maximum daily precipitation value, as shown in Table 3.
Source: Mora et al. (1992)
Table 3: Precipitation factor values
Maximum precipitation (mm/day)
Description
Dp factor
<100
Very low
1
101-200
Low
2
201-300
Average
3
301-400
High
4
>400
Very high
5
Mathematical formalizations
In geotechnics, soil consists of solids, water, and air. The weight of the latter is neglected. The sum of the volumes of water and air are defined as the ‘void volume’ (Berry & Reid, 1993; Braja, 2015). Figure 1 shows this composition, as well as the source that originates them. Part of the water that precipitates is incorporated into the soil through runoff, and sometimes the air enclosed between solids passes into the atmosphere.
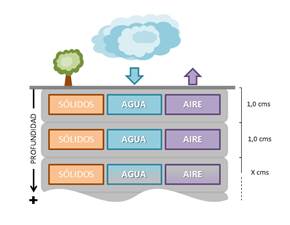
Figure 1: Graphical balance of water and air in the soil mass
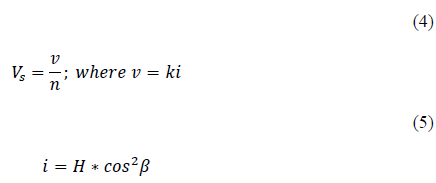
In geotechnics, the moisture (ω) of a soil is calculated by the ratio of the weight of water to the weight of soil, while the saturation (S) in a soil is expressed as the ratio of the volume of water to the volume of voids. This is shown in Equations (2) and (3).
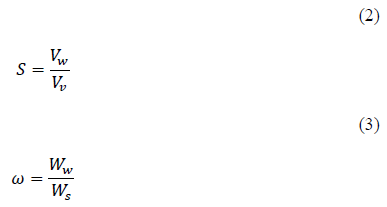
Thus, there can be a saturated soil (S=100%) with a moisture content of 60%, just as there can be a soil with a moisture content greater than 100%, where the weight of water is much greater than the weight of solids in the soil mass; in this case, however, due to the large void volume, the soil does not reach 100% saturation.
The infiltration velocity (Vs) is the rate of change for the actual length of advance of water through the void volume of the soil mass per unit time, as shown in Equation (4). The discharge velocity (v) is the amount of water flowing per unit time through a total cross-section of soil perpendicular to the direction of the flow, and it is determined by the scalar product of the permeability coefficient (k) and the hydraulic gradient (i) obtained by laboratory tests according to Equation (5). For the presented model, the hydraulic gradient is 1.
Runoff, understood as rainwater flowing freely across the surface of a terrain, is estimated to occur if the intensity of the rainfall is greater than the permeability coefficient of the soil, that is, if the speed with which the water manages to infiltrate the soil is less than the intensity of the rainfall that reaches the soil surface (in the same unit of time).
Under the assumptions of this model, soil sliding on the slope is estimated to be caused by fatigue in the shear strength of the solids comprised by the soil mass, but the liquid limit (LL) of soil consistency, proposed at the beginning of the 20th century by Swedish pedologist Albert Mauritz Atterberg, is also taken into account as a presumed trigger for sliding (Figure 2).

Figure 2: Theoretical consistency of the soil mass according to the moisture content
Sliding of soil on a slope due to shear strength fatigue could result in rotational and translational landslides, while exceeding the liquid limit could result in avalanche- or reptation-type landslides (Ramos et al., 2015).
The fatigue of the material (soil solids) is calculated, second by second, by a mathematical expression that sums two relationships: a) cohesion (C) with the product of the saturated specific weight of the soil (γ_sat), the saturated depth (H), and the slope slope angle (ß); and b) the product of the ratio of the effective specific weight of the soil (γ^') and its saturated specific weight affected by the ratio between the tangents of the angle of internal friction (Ø) and the slope (inclination) (Braja, 2015).
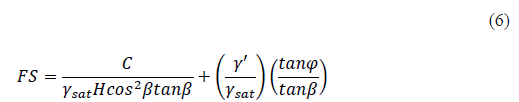
Although the model does not aim to analyze the stability of the slope, the mathematical expression used for the calculation of the shear strength of soil solids defines the stability of infinite slopes with infiltration, as shown in Figure 3. A slope is an artificial conditioning of the soil to anthropic needs, whereas a hillside is the natural inclination that a soil mass has acquired at the end of its natural geological processes (Figure 3).
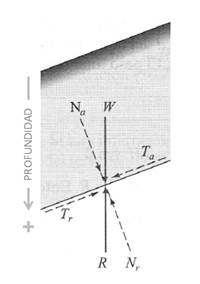
Figure 3: Analysis of an infinite slope, without infiltration
In this model, the expected value to which the mathematical expression tends is 1 because, at that instant, and at a certain saturated depth, the forces tangential to the plane at the saturated depth that resist the column of saturated soil are equal to the tangential forces that cause it to slide, i.e., the failure is incipient (initiation). In slope stability, the employed safety factor is 1,5 (Ministerio de Ambiente, Vivienda y Desarrollo Territorial, 2010).
The rainfall intensity values used in the model come from the intensity-duration-frequency (IDF) curves calculated by the Colombian Institute for Hydrology, Meteorology, and Environmental Studies (IDEAM), with data from meteorological station 16015020, which is located in Pamplona, Colombia (Lat. 7.373111 N, Long. 72.645 W, Alt. 2.340 masl). These curves are summarized in Table 4.
Source: Authors, based on data from IDEAM (2015)
Table 4: Intensities in centimeters per second, Pamplona station (cm/s)
Duration
Return period (years)
Seconds
3
Seconds
3
Seconds
3
Seconds
900
0,001347
900
0,001347
900
0,001347
900
1.800
0,000992
1.800
0,000992
1.800
0,000992
1.800
3.600
0,000697
3.600
0,000697
3.600
0,000697
3.600
7.200
0,000428
7.200
0,000428
7.200
0,000428
7.200
21.600
0,000181
2.1600
0,000181
21.600
0,000181
21.600
The sampled sites correspond to known landslides within the urban perimeter of Pamplona (Colombia): 13 Atrás Cariongo, 10 Cristo Rey (low), 2 Jurado (high), 7 Jurado (low), 8 La Curva, 14 Las Margaritas, 5 Los Olivos, 16 Salida Bucaramanga, 9 Santa Marta (high), and 6 Santa Marta (low) (Chaparro & Pedraza, 2012). The above sites are shown in Figures 4 and 5.
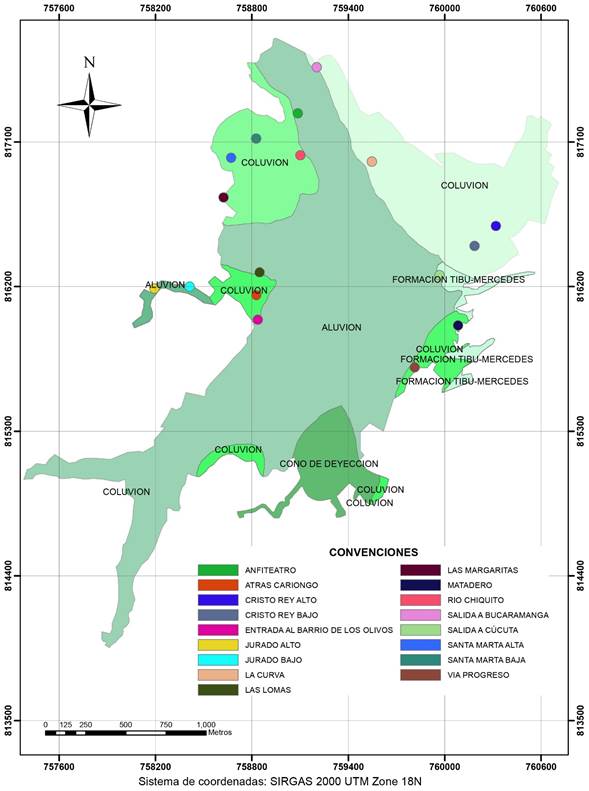
Figure 4: Geology and sampling points in the municipal capital of Pamplona, Colombia
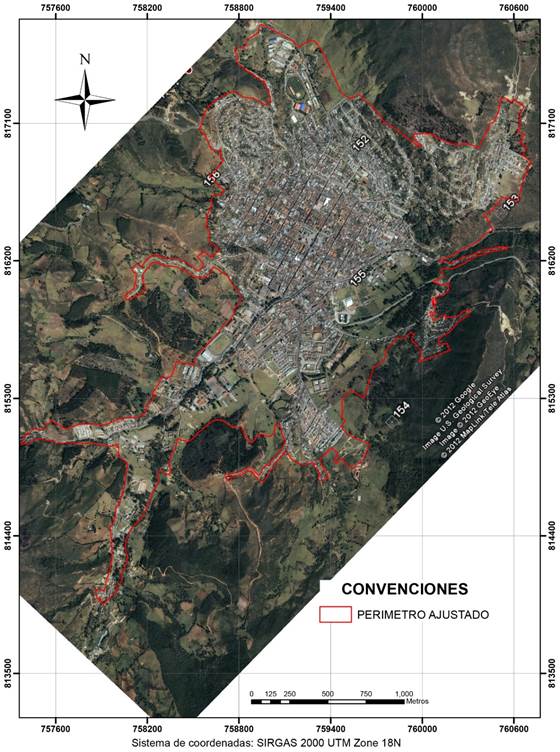
Figure 5: Urban perimeter of the municipal capital of Pamplona (Colombia)
The samples taken from the sites affected by mass movement phenomena do not correspond to the soil removed by the phenomenon but to that adjacent to it. This was done in order to avoid obtaining data on residual cohesion, the angle of internal friction, and the permeability coefficient. The codes come from the programmed sequence of field activities for sampling, and the names obey the subjective appreciation of the authors, together with urban denominations. For the purposes of this paper, the model has been run for the dataset of sites 16 and 8. In other analyses performed by the authors, it has been found that the mass movement phenomena of these sites may be directly related to irregular anthropic interventions rather than to natural actions.
Mathematical model approach
In order to obtain an operational model of the mass removal phenomenon which could be subsequently simulated under different scenarios, the methodology proposed by Aracil and Gordillo (1997), which is based on Forrester's system dynamics (Forrester, 1997), was applied with a systemic approach. One way to systemically approach this phenomenon is to propose a causal diagram that relates the geotechnical and hydrological variables and thus observe the relationships of influence between them. With this, feedback cycles and accumulation equations of the state variables can be identified.
The vegetation cover acts as a water control mechanism within the soil, as it intercepts part of the rainwater, part of which percolates into the soil. The water that is not filtered runs off, leading to erosion, which is affected by the soil per unit runoff and is in turn influenced by soil erodibility in terms of “increased sediment entrainment and deposition” (Montoya-Armenta & Rodríguez-Díaz, 2020, p. 65). The initial causal diagram is shown in Figure 6.
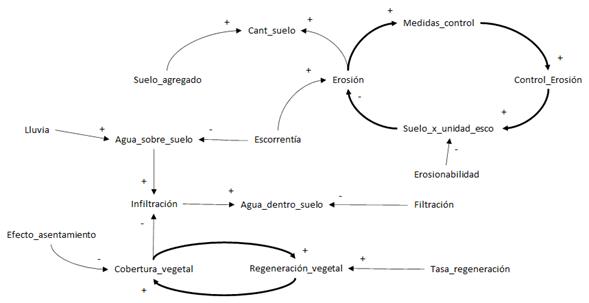
Figure 6: Causal diagram of the landslide event
One way to control erosion is through civil infrastructure as a means of control, which decreases the erodible soil through stabilization works, which are carried out when erosion is appreciable. In Figure 6, it corresponds to the feedback loop in the upper right corner. However, other variables such as runoff continue to affect erosion. These control measures do not have an instantaneous effect, so there may be delays in their final effects. In turn, the amount of water that infiltrates and passes into the soil depends on the water that is on the ground but is diminished by the vegetation cover, which absorbs part of that water. The effect of human settlements is noticeable, as they reduce the vegetation cover, thus allowing for a greater amount of infiltrated water.
Once the variables have been identified by means of the causal diagram, they are classified, and then a Forrester diagram is generated (Aracil & Gordillo, 1997). This diagram allows the system of equations to explain the phenomena to be simulated. Table 5 lists the main variables. By way of convention, it is established that subsystem A groups the variables related to stability, B contains those associated with humidity, C is made up of those related to rainfall, D is made up of those related to soil properties, and E is made up of variables related to permeability and infiltration. Table 5 lists the variables used in the model.
Source: Authors
Table 5: Most relevant variables in the model
Variable
Description
Subsystem and variable type
Unit of measurement
AlertaEstabilidad
Stability indicator
A, auxiliary variable
N/A
FactorSeguridad
Threshold for stability
A, auxiliary variable
N/A
Cohesión
Soil cohesion factor
A, auxiliary variable
N/A
AnguloPhi
Angle φ
A, auxiliary variable
Radians
Pendiente
Angular measurement of slope
A, auxiliary variable
Radians
YSat
Depth of vertical saturation
A, auxiliary variable
cm
ProfSaturadaAcum
Unitary void volume of the soil mass
B, level variable
cm3
SolidosTotales
Amount of solids
B, level variable
cm3
AguaTotal
Amount of water
B, level variable
cm3
LluviaTotal
Water falling in precipitation over a period of time
C, level variable
cm3
Lluvia
Instantaneous water precipitation
C, flow variable
cm3/s
Escorrentía
Water runoff per unit of time
C, flow variable
cm3/s
Agua
Net water change rate
B, flow variable
cm3/s
Sólidos
Rate of change for the number of solids
B, flow variable
cm3/s
ProfSaturada
Amount of water entering the soil
B, flow variable
cm3/s
AleraHumedad
Moisture warning indicated
B, auxiliary variable
Intensidad
Rainfall intensity
C, auxiliary variable
Mm
CoberVeg
Vegetative cover
C, auxiliary variable
g
VelocInfiltracion
Water infiltration rate
E, auxiliary variable
Porosidad
Soil porosity factor
D, parameter
GradHco
Water gradient
E, parameter
CoefPerm
Permeability coefficient
E, parameter
PesoAguaUnit
Weight of water per unit volume
D, auxiliary variable
g/cm3
The model is based on the vertical calculation of the depth of soil saturated with water (H) through the determinination of the number of times that rainwater, immersed in the soil mass, occupies the unit void volume of the soil mass (AcumSaturatedDepth). It is expressed in ‘void volume units’ because it is the volume occupied by water and air in each cubic centimeter of soil mass. Figure 7 shows the structural diagram of the model, which results in a system of differential equations for the level variables, complemented by the algebraic equations that relate the other variables, which were previously established.
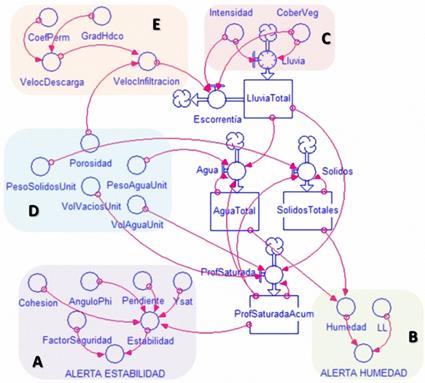
Figure 7: Structural diagram of the landslide phenomenon
According to the Forrester diagram, soil moisture varies with respect to the amount of rainwater (TotalRain) which is added to the amount of water already in the soil mass (WeightWaterUnit). The volume and weight of solids per unit volume is constant (SolidsUnitWeight), and the total solids value varies (TotalSolids) as the depth increases because the volume of soil mass to be analyzed increases.
The MOISTURE ALERT variable acquires a value of 1 if the moisture of the soil mass as the simulated saturated depth reaches the value of the liquid limit (LL), since it is assumed that, at that moment, the soil acquires a liquid consistency and starts its displacement. The model does not estimate any displacement length or velocity.
In sector A, the model calculates the imbalance that exists between the shear forces at the simulated saturated depth. The STABILITY ALERT variable acquires a value of 1 if there is no longer an imbalance of shear forces because it is assumed that, at that moment, the shear force resisting is less than the action of the normal component of the shear forces, which is due to the weight of the saturated soil column on the failure plane at the saturated depth.
Water infiltration into the soil is achieved by successive saturation of the surface unit volumes, which causes the water to move vertically downwards (to depth) by gravitational attraction due to the release of interstitial pressure. It is estimated that the depth of soil saturated with water depends only on the amount of rainwater that actually manages to enter the soil after being intercepted by the vegetation cover.
This leads to infer that a 100% saturation is essential because, without saturation, there is no vertical advance of water in the soil mass; if there is no saturation, one would be faced with a soil mass with such a high permeability coefficient that it does not experience pore pressure (interstitial pressure) due to the transit of rainwater between its empty spaces (volumes) without any problem.
Therefore, in sector E, we have the variables for calculating the infiltration velocity (VelocInfiltration), which is compared to the rainfall intensity (Intensity) in order to define the presence of runoff, since this physical phenomenon reduces the amount of water entering the soil mass. In sector C, the amount of water reaching the soil surface is calculated, understanding the soil surface as the boundary between the atmosphere and the soil mass. The values of solids and water weight, as well as the values of water volume and voids, were analytically calculated with processed data and information from laboratory tests. The model was implemented for the data set of two sites: 16 and 8.
RESULTS
According to the work described and conducted, it is convenient to establish some initial simulation conditions, under the assumption that the amount of water and solids in the model is 0, given that the depth of soil that is saturated at that moment is 0, i.e., it starts on a dry surface. The units of measurement are grams (g), centimeters (cm), and seconds (s). Two sites were selected as the main scenario: site 8, with high soil stability, and site 16, with a more unstable soil type. The parameters in both sites are different, and the most important ones are shown in Table 6.
Source: Quintana-Cabeza (2014)
Table 6: Parameters of the sites where the model is applied
Site
Liquid limit
Plastic limit
Density
Humidity
Void volume
8 (La Curva)
23%
13%
1,7
10%
0,4
16 (Salida Bucaramanga)
55%
22%
1,54
33%
0,56
In the simulation of soil behavior at site 16, using the highest probable intensity (0,002350 cm/s) and occurring every 100 years, the soil reaches liquid limit moisture at 145 s (about three minutes), while stability is seriously compromised at 358 s (just under six minutes). The simulation has a total duration of 900 s, which corresponds to a period of 15 minutes. Figure 8 shows the behavior of the soil at this site.
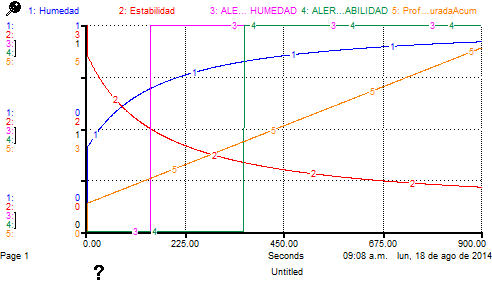
Figure 8: Simulation of soil behavior at site 16 with an intensity of 0,00235 cm/s
For the soil at site 8, with the same rainfall intensity, the soil reaches the liquid limit moisture at 64 s, while stability is never compromised. The simulation also had a total duration of 900 s, and its results are shown in Figure 9.
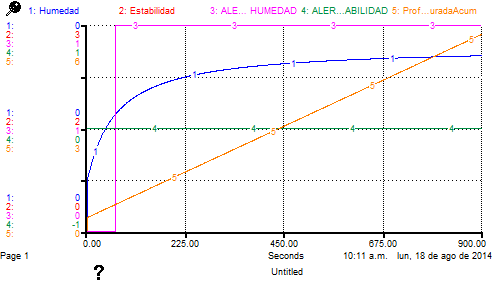
Figure 9: Simulation of soil behavior at site 16 with an intensity of 0,00235 cm/s
Table 7 shows the evolution of the moisture and stability indicator variables for site 8 throughout the simulation.
Source: Authors
Table 7: Appearance of moisture or stability alerts for soil at site 8
Seconds
Humidity
Stability
Moisture alert
Moisture stability
AcumSaturatedDepth
63
0,23
67,77
0,00
0,00
0,77
64
0.23
67,27
1,00
0,00
0,77
…
899
0,34
11,64
1,00
0,00
5,73
End
0,34
11,63
1,00
0,00
5,74
For the lowest probable rainfall intensity (0,000181 cm/s) that occurs most frequently (every three years) and during 21.600 s (six hours), the soil of site 16 reaches the liquid limit in a little more than half an hour (1.864 s), and stability is compromised after an hour and a quarter of rain (4.626 s). Figure 10 shows the behavior of these variables, and Table 8 shows the behavior of the variables associated with moisture and stability indicators.
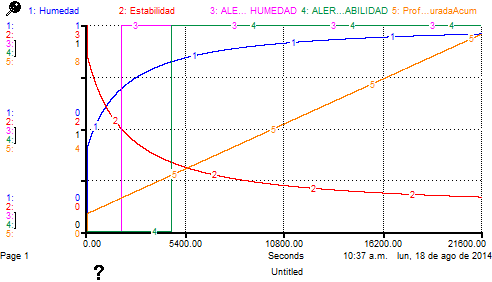
Figure 10: Simulation of soil behavior at site 16 with an intensity of 0,000181 cm/s
Source: Quintana-Cabeza (2014)
Table 8: Appearance of moisture or stability alerts for the soil at site 16
Time
Humidity
Stability
Moisture alert
Moisture stability
AcumSaturatedDepth
1.864
0,55
1,49
1,00
0,00
1,28
…
4.626
0,66
1,00
1,00
1,00
2,18
For the soil at site 8, with the lowest probable intensity and the highest duration (six hours), the soil reaches liquid limit moisture at 819 s (just over 13 minutes), while stability is never compromised. Figure 11 and Table 9 summarize these results.
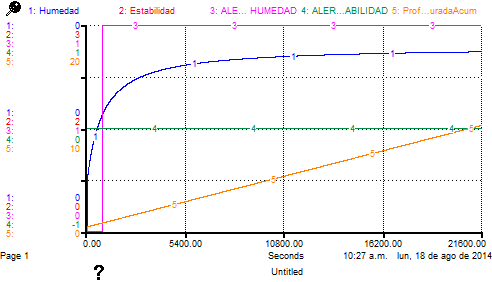
Figure 11: Soil behavior at site 8 with an intensity of 0,000181 cm/s
Source: Authors
Table 9: Appearance of moisture or stability alerts for soil at site 8
Time
Humidity
Stability
Moisture alert
Moisture stability
AcumSaturatedDepth
819
0,23
67,27
1,00
0,00
0,77
…
21.599
0,35
7,8
1,00
0,00
10,28
End
0,35
7,8
1,00
0,00
10,28
Soil behavior was also simulated for the presence of the highest intensity that occurs most frequently and for which a quarter-hour duration is expected (I = 0,001347 cm/s; D = 900 s; F = 3 years). Figures 12 and 13 show the results for sites 8 and 16, respectively, and Table 10 shows the moisture alerts.
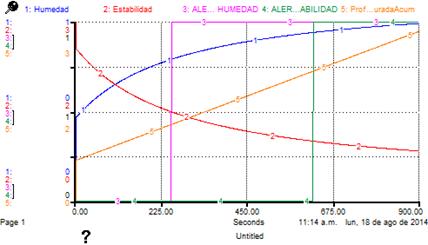
Figure 12: Simulation of soil behavior at site 8 with an intensity of 0,000181 cm/s
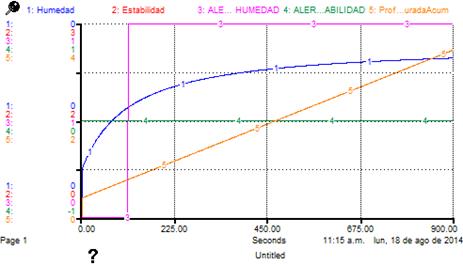
Figure 13: Soil behavior at site 16 with an intensity of 0,000181 cm/s
Source: Authors
Table 10: Appearance of moisture or stability alerts for soil at sites 16 and 8 with an intensity of 0,001347 cm/s, D = 900 s, F = 3 years
Site
Time
Humidity
Stability
Moisture alert
Moisture stability
AcumSaturatedDepth
16
251
0,55
1,49
1,00
0,00
1,28
16
623
0,66
1,00
1,00
1,00
2,18
8
111
0,23
67,25
1,00
0,00
0,78
8
End
0,33
17,35
1,00
0,00
3,46
Finally, Figure 14 shows the time elapsed before the liquid limit and shear failure appear for different rainfall intensities at site 16, which is more prone to landslide events due to its instability. As can be seen, shear failure is reached quickly with high rainfall intensities, but also with a lower intensity if the rainfall is prolonged.
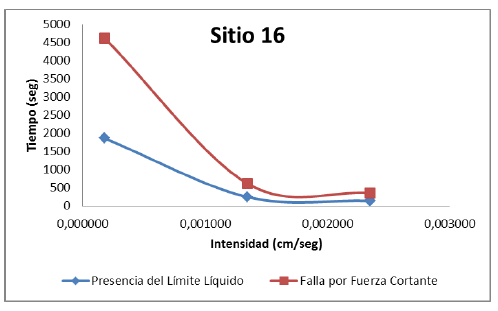
Figure 14: Elapsed time for liquid limit or shear failure to appear at different rainfall intensities at site 16
CONCLUSIONS
As shown by the simulation results, the soil depth that must be saturated does not vary (so the liquid limit is reached in the entirety of the soil mass) nor does the saturated depth at which shear failure occurs.
The exceedance of the liquid limit value by soil moisture or the loss of shear force imbalance in the saturated depth plane at the time of failure is indeed related to rainfall intensity.
However, in the collective imagination, there is an exclusive relationship between heavy rainfall and the presence of landslides on slopes due to the alleged saturation of soils. Saturation is a physical phenomenon that must exist for water infiltration into the soil mass to exist; otherwise, the water that comes into contact with the soil mass only joins with the water that naturally exists in the soil mass, but only as adhered to the surface of the solid particles of the soil mass.
In reality, the duration factor is responsible for the total filling of the soil mass void volume to the depth of occurrence of the liquid limit or shear equilibrium, as shown by the results of this research.
However, a high rainfall intensity of the order of 0,001325 cm/s or more, fractioned by simulation durations between 3.600 and 21.600 s, cannot be used in the model because it does not correspond to the statistical assumptions of the intensity-duration-frequency (IDF) curves.
The model only considers the vegetation cover factor as a reducer or obstacle for rainwater to come into contact with the soil mass. In reality, there are many factors that reduce the amount of water that reaches the bare soil surface, such as evaporation, transpiration, or water absorption by plant roots.
The model should not be used as a substitute for specific studies to determine the stability of a slope or as a tool for predicting landslides on slopes, but it can be used as an input for its application in methodologies for landslide hazard zoning.
Acknowledgements
ACKNOWLEDGMENTS
The authors are grateful to Universidad de Pamplona.
REFERENCES
Licencia
Esta licencia permite a otros remezclar, adaptar y desarrollar su trabajo incluso con fines comerciales, siempre que le den crédito y concedan licencias para sus nuevas creaciones bajo los mismos términos. Esta licencia a menudo se compara con las licencias de software libre y de código abierto “copyleft”. Todos los trabajos nuevos basados en el tuyo tendrán la misma licencia, por lo que cualquier derivado también permitirá el uso comercial. Esta es la licencia utilizada por Wikipedia y se recomienda para materiales que se beneficiarían al incorporar contenido de Wikipedia y proyectos con licencias similares.