
DOI:
https://doi.org/10.14483/22487638.16800Published:
2020-10-01Issue:
Vol. 24 No. 66 (2020): October - DecemberSection:
ResearchDesign of drones for monitoring of volcanic areas
Diseño de Drones para monitoreo de zonas volcánicas
Keywords:
Dron, Sensores de Gas, Monitoreo de Volcanes, Análisis de Patrones (es).Keywords:
Drone, Gas sensors, Volcanic monitoring, Pattern analysis (en).Downloads
References
Amelung, B., Nicholls, S., & Viner, D. (2007). Implications of global climate change for tourism flows and seasonality. Journal of Travel Research. https://doi.org/10.1177/0047287506295937
Becken, S., Hay, J. E., & Espiner, S. (2011). The risk of climate change for tourism in the Maldives. In Island Tourism: Towards a Sustainable Perspective. https://doi.org/10.1079/9781845936792.0072
Hanisch, C. (1998). Where Is Mercury Deposition Coming From? Environmental Science & Technology. https://doi.org/10.1021/es983470q
Hein, L., Metzger, M. J., & Moreno, A. (2009). Potential impacts of climate change on tourism; a case study for Spain. In Current Opinion in Environmental Sustainability. https://doi.org/10.1016/j.cosust.2009.10.011
Malvina, S., Herrera, C. G., & Niz, A. E. (2019). Teledetección aplicada al mapeo geomorfológico de los volcanes de la cuenca alta del río Chaschuil, provincia de Catamarca, Argentina. Tecnura. https://doi.org/10.14483/22487638.14642
Márquez, H., Hernández, C., & Pedraza, L. (2012). Sistema electrónico para control de actuadores mediante Bluetooth Electronic system for control of actuators using Bluetooth. Revista Tecnura. https://doi.org/http://dx.doi.org/10.14483/udistrital.jour.tecnura.2012.1.a11
Massacane, A., Vorobioff, J., Pierpauli, K., Boggio, N. G., Reich, S., Rinaldi, C. A., Boselli, A., Lamagna, A., Azcárate, M. L., Codnia, J., & Manzano, F. (2010). Increasing electronic nose recognition ability by sample laser irradiation. Sensors and Actuators, B: Chemical. https://doi.org/10.1016/j.snb.2009.12.033
Neumann, P., Bartholmai, M., Schiller, J. H., Wiggerich, B., & Manolov, M. (2010). Micro-drone for the characterization and self-optimizing search of hazardous gaseous substance sources: A new approach to determine wind speed and direction. ROSE 2010 - 2010 IEEE International Workshop on Robotic and Sensors Environments, Proceedings. https://doi.org/10.1109/ROSE.2010.5675265
Rodionova, O. Y. (2005). Brereton, R.G., Chemometrics: Data Analysis for the Laboratory and Chemical Plant, Chichester: Wiley, 2003, 489 pp. Journal of Analytical Chemistry. https://doi.org/10.1007/s10809-005-0223-6
Rodríguez, D., Bonaparte, J., Boggio, N., & Fasciszewski, A. (2019). Desarrollo y fabricación de un microsensor de gas de baja potencia para la detección de amoniaco a bajas concentraciones. Tecnura. https://doi.org/10.14483/22487638.15353
Scharff, L., Hort, M., & Varley, N. R. (2015). Pulsed Vulcanian explosions: A characterization of eruption dynamics using Doppler radar. Geology. https://doi.org/10.1130/G36705.1
Scott, S. M., James, D., & Ali, Z. (2006). Data analysis for electronic nose systems. In Microchimica Acta. https://doi.org/10.1007/s00604-006-0623-9
Vargas, M. N., & Jaramillo, J. (2018). The sensors industry in Colombia. Tecnura.
Vorobioff, J., Videla, E., Boggio, N., Salomón, O. D., Lamagna, A., & Rinaldi, C. A. (2018). Laser Vaporization eNose method for the detection of transmitter of Chagas disease. Sensors and Actuators, B: Chemical. https://doi.org/10.1016/j.snb.2017.10.143
Vega-Posada, C. A., Ramos-Cañón, A. M., & García Aristizábal, E. F. (2017). Efecto del gas en la velocidad de onda de corte de suelos arenosos densificados con explosivos. Revista Tecnura. https://doi.org/10.14483/udistrital.jour.tecnura.2017.1.a05
Webb, A. R., & Copsey, K. D. (2011). Statistical Pattern Recognition: Third Edition. In Statistical Pattern Recognition: Third Edition. https://doi.org/10.1002/9781119952954
Wold, S., Sjöström, M., & Eriksson, L. (2001). PLS-regression: A basic tool of chemometrics. Chemometrics and Intelligent Laboratory Systems. https://doi.org/10.1016/S0169-7439(01)00155-1
How to Cite
APA
ACM
ACS
ABNT
Chicago
Harvard
IEEE
MLA
Turabian
Vancouver
Download Citation
Recibido: 2 de marzo de 2020; Aceptado: 13 de agosto de 2020
Abstract
Objective:
Volcanic eruptions are a serious threat to the environment. In order to assess more accurately the state of a volcanic zone, spatially distributed measurements are required.
Methodology:
An electronic nose (eNose), a quad-copter drone with gas, temperature, and humidity sensors was developed. The drone was assembled with 3D printed parts and tested for properties like structural rigidity. The eNose samples gases, manages a sensor array, acquires data, extracts features, and classifies them with suitable classification algorithms.
Results:
The eNose drone system provides a versatile technology for autonomous monitoring of diverse environments. A logarithmic calibration curve was observed for the CO sensor.
Conclusions:
The implementation of a eNose drone system and its application to the detection and study of gases in volcanic areas would be innovative in Argentina. The system can access remote dangerous areas and is versatile. Different gas sensors like H2S or SO2 can be added.
Financing:
Project PID MSUTIBA0004713TC Universidad Tecnológica Nacional. Comisión Nacional de Energía Atómica. Buenos Aires, Argentina
Keywords:
Drone, Gas sensors, Volcanic monitoring, Pattern analysis.Resumen
Objetivo:
Las erupciones volcánicas son una grave amenaza para el ambiente. La ceniza de un volcán puede contaminar el agua, la vegetación, el ganado y a las personas. Con el fin de evaluar con mayor precisión el estado de la zona volcánica, se requiere la aplicación de mediciones distribuidas espacialmente.
Metodología:
Se desarrolló una nariz electrónica (eNose) y un dron cuadricóptero con sensores de gas, temperatura y humedad. El dron fue ensamblado con una estructura realizada con impresora 3D y se comprobó su correcta rigidez. La nariz electrónica toma muestra de gases, controla el array de sensores, adquiere datos, extrae características de los datos y clasifica las muestras con los algoritmos correspondientes.
Resultados:
El sistema de dron eNose provee una tecnología flexible para el monitoreo de diferentes entornos. Para el sensor de gas de CO se observó una curva de calibración logarítmica.
Conclusiones:
La implementación de un sistema drone eNose y su aplicación a la detección y estudio de gases en áreas volcánicas resultaría innovador en Argentina. El sistema puede acceder a zonas remotas y peligrosas, y es muy flexible. Se pueden agregar diferentes sensores de gas como por ejemplo H2S o SO2.
Financiamiento:
PID MSUTIBA0004713TC Universidad Tecnológica Nacional. Comisión Nacional de Energía Atómica. Buenos Aires, Argentina
Palabras claves:
Dron, Sensores de Gas, Monitoreo de Volcanes, Análisis de Patrones.INTRODUCTION
Currently, volcanic eruptions act as triggers for a series of processes that endanger the population. They constitute a serious threat and are responsible for many problems, which is why air quality must be monitored in volcanic areas (Malvina, 2019; Vargas, 2018). Gases released by a volcanic eruption will be highly toxic depending on their concentration, volume, and time in the environment. The follow-up and monitoring of these emissions must be carried out continuously throughout the whole process of a volcanic eruption in order to diagnose anomalies and prevent accidents (Amelung, 2007). Additionally, since wind and rain disperse the gases, it is essential to carry out spatially distributed direct readings to obtain a true representation of gas concentration. However, installing a fixed sensor network is not necessarily a reasonable solution due to economic and logistical reasons; thus, a mobile measuring device would be more useful and efficient (Vargas, 2018).
According to official information from the National Geographic Institute (IGN) in Argentina, there are around 37 active volcanoes in the Andes mountain range. So, this work presents the development and assembling of a drone for gas monitoring in volcanic areas.
Drones are very useful in this area since they allow control in dangerous environments. Sensing devices such as an electronic nose (eNose) can be used to take samples, interact with other systems, and provide useful markers to manage system operators. (Vorobioff, 2018) Also, drones can carry out continual measurement procedures over long time periods, so they can carry out space-time measurements with higher point density (Rodionova, 2005). Additionally, the use of an automated observation platform can minimize human intervention and minimizes gas exposure (e.g., to hydrogen sulfide).
Using a drone would make it possible to locate the emission sources of the pollutants and carry out the monitoring required by volcanologists in a faster and less expensive way. The development and implementation of a complete equipment, an eNose drone, could be used for an in-situ detection of pollutants and their source, and then take direct action measures when necessary. The complete development of this technique would allow an early diagnosis of volcanic eruptions and a preventive control over the nearby population (Hanisch, 1998). The drone would have built-in sensors able to find the exact location of volcanic eruptions and would have the computational capability to calculate gas and temperature distribution, for example (Hein, 2009). This would allow deciding the places that according to the model should be observed. (Wold, 2001) A drone must be able to perform three main tasks: It must serve as a flexible and autonomous system to explore large areas to measure gas concentrations (e.g., H2S and CO2); it must be able to provide useful information such as distribution maps and gas leak locations from the acquired data; and it must take measurements, take images, and pass on this information in real time (Neumann, 2010).
Therefore, the prediction of eruptions from location and on-site monitoring of gas emission sources could be possible in a faster and less expensive way.
The environmental impact could be rapidly reduced by improving the quality of the management system (Vega-Posada, 2017). The complete development of this technique would allow the diagnosis of soil quality as well as sanitary control (Becken, 2011).
In the bibliography there are also numerous examples of this kind of applications. For instance, the Federal Institute for Materials Testing and Research in Germany designed a drone with different sensors (Neumann, 2010). Gas sensitive drones are valuable instruments to address these issues such as gas leak detection, monitoring, or exploration of dangerous regions (Massacane, 2010)
METHODOLOGY
Drone manufacture
The implemented methodology aimed to perform the following: to develop a drone (mobile robot) with an eNose system; and to test the analytical capabilities of the assembled system by conducting studies in semi-field conditions (small spaces under controlled conditions). Once these objectives are met, an area or region of interest may be explored to sample pollutants and to obtain their distribution map. Results in different project stages contribute to the development of new technologies relevant to environmental chemistry; in each of the stages of this work, different human resources are trained in order to apply these new technologies to different areas (Márquez 2012).
Drone structure parts were manufactured using a 3D printer, and the drone's arm rigidity was tested. The weight of each arm must be constant; and since the tubular arms oscillate less than the rectangular ones, the tubular were chosen to improve the structural rigidity of the drone. Furthermore, parts were printed with filaments composed of different materials to obtain a robust frame. Motors and propellers were selected according to the drone load capacity, sensors, stability control, and the tele-transmission system. The flight can be controlled manually by remote control or autonomously by a programmed flight plan.
The electronic controller was compensated to avoid vibrations because it was essential to have more rigidity. The selected design of the drone allowed printing without support material and can accommodate 3-cell 6000 mAh or 4-cell 4200 mAh LiPo battery. It was possible to put camera and/or sensors in their compartments. Four Readytosky model 2212 of 920 kV motors and suitable propellers were selected. A Pixhawk PX flight controller was chosen because it has the following benefits: real-time operating system (RTOS), multiple communication interfaces, a backup power system, manual and automatic flight modes, and the ability to record flight data on an SD card. The chosen kit also includes a GPS module and telemetry, and a Radiolink AT9S 2.4G 9CH transmitter allowed the connection with the drone. In the following section, different parts of the drone and its characteristics are described in detail.
Motors and propellers
Four Readytosky 2212 920 kV motors and the most suitable propellers have been selected for the drone (Figure 1). Their main characteristics are described below:
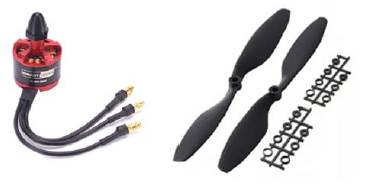
Figure 1: Motor RS 2212 and propellers model 1045.
Model RS 2212, Weight: 56 g, Size: 24 x 12 mm Propellers: model 1045
Electronic speed controller
The selected Electronic Speed Controller (ESC) model is Simonk 30A (Figure 2). Its main characteristics are:
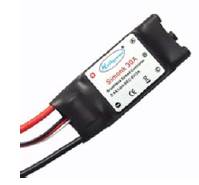
Figure 2: Electronic Speed Controller (ESC) Simonk 30A.
Brand: Readytosky, Cont.Current:30A, Burst Current(10sec): 40A, BEC (Battery Elimination Circuit): 3 A, recommended battery: Lipo:2-3S LiPO, with dimensions LxWxH: 45 x 24 x 9 mm, and weight: 24 g.
Flight controller
The Pixhawk PX flight controller (Figure 3) has been chosen for its multiple advantages. It has a real-time operating system (RTOS), multiple communication interfaces, backup power system, manual and automatic flight modes, and the ability to record flight data on an SD card. This model also includes a GPS and telemetry module. Features:
-
Ultra-fast microcontroller of 32 bits with real-time systems
-
14 output PWM
-
Interface UART and I2C
Remote control system
The link with the drone is done through a Radiolink AT9S for RC quadcopters (Figure 4) Features:
-
Dimensions: for AT9S: 185 x 105 x 183mm
-
Weight: 0.88 kg
-
Modulation: QPSK
-
Bandwidth: 6 MHz and 250 kbps
-
Distance: 950 meters above ground, 1400 meters in the air.
-
Channels: 8
-
Screen: 2.7 "230 x 320 pixels, 16 colors.
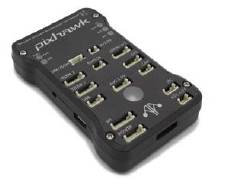
Figure 3: Pixhawk Flight Controller.
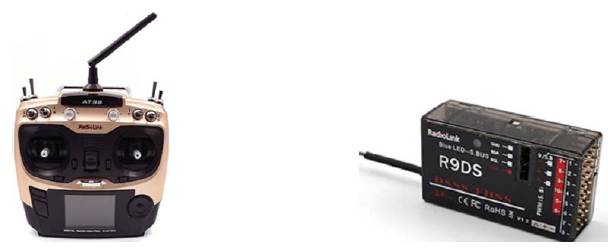
Figure 4: left). RadioLink AT9S transmitter, right). RadioLink R9DS receiver.
Drone structure
To implement the drone structure, parts were manufactured using a 3D printer. 3D printers make replicas of 3D designs, creating pieces with any type of complexity. For the drone shell, a Thingiverse design was used. This online community is managed by the 3D printing company Makerbot, which is a site for sharing object designs that can be 3D printed. In this case, there are many models available to print, but the structures have to be selected correctly to obtain better rigidity and guarantee low weight.
Two quadcopter arm models are shown in Figure 5; a weight is placed on each arm and they sway. At the same weight, the tubular arm oscillates less than the rectangular arm, so the tubular arms are chosen to improve structural rigidity because the electronic controller has to compensate for arm vibrations.
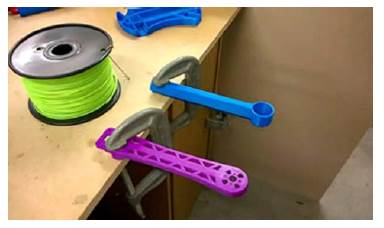
Figure 5: Rigidity test of the drone arms: Tubular (blue) and Rectangular (violet) arms.
The selected design can be printed without support material, and it can accommodate a 3-cell 6000 mAh or 4-cell 4200 mAh battery. Furthermore, it is possible to house camera and/or sensors in their compartments.
Figure 6 shows the different 3D printed parts used to assemble the drone structure. The complete structure of the drone weighs 480g without the electronics. Special care has been taken so that the 4 drone arms have similar weights.
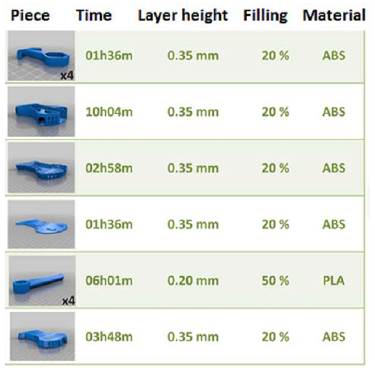
Figure 6: Printed parts of the drone and their printing features.
The characteristics that had to be selected for the drone in order to develop this work are:
-
The correct structure of the drone so that it has low weight and good rigidity.
-
Medium kV motors.
-
Optimal battery for 12 minutes of flight.
-
Propellers.
-
Required current from the ESC controller.
-
Flight controller.
-
Autopilot.
Figure 7 shows a typical quadcopter connection diagram with ESC controllers' interface between motors, control logic, and battery. The battery powers the ESC that powers the motors. Three signals compose the ESC control logic: ESC signal, telemetry signal (which is optional), and the ESC signal ground connection. In this case, the ESC signal from each drive is controlled by a PWM pin on the system and the ground signals can be connected to the control system ground.
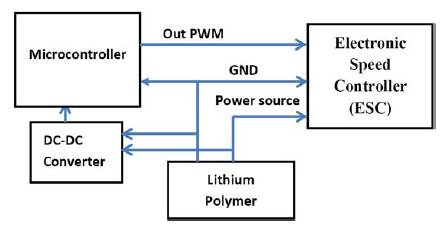
Figure 7: Connection diagram of the motors and ESC to the drone.
Gas detection system
The gas detection system (eNose) to be mounted on the drone consists of a plate containing the gas sensors, the electronics to process measurements, and an Arduino Nano 3.0 microcontroller. Data is analyzed on a PC with a user-friendly pattern recognition software which has a GUI that allows to pick between PCA, Fisher, and linear classifiers.
The sensor array consists of 6 Microsens MOS type gas sensors, and part of this arrangement consisted of three MSGS-3000i sensors. The MSGS-3000i Gas Sensor detects CO, ethanol, and volatile organic compounds (VOC) emissions. The remaining part of the arrangement consisted of three MSGS-3007i sensors, which detect NO2 in 0.05 to 5 ppm range. Due to the integrated sockets that the eNose possesses, sensors could be easily changed to detect different compounds. Figure 8 shows the ENose board with the 6 gas sensors. Detectable gases:
-
CO: 2 - 1000 ppm
-
C2H5OH: 20-500ppm
-
H2: 1-1000ppm
-
NH3: 1-600ppm
-
CH4:> 2000ppm
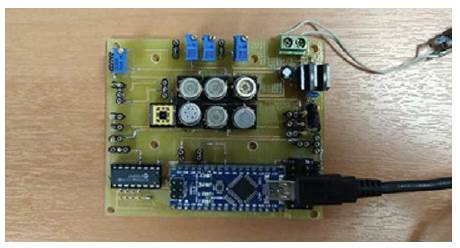
Figure 8: eNose board.
Drone system integration with the eNose
An electronic nose (eNose) is attached to the drone.
An eNose is an instrument that can "smell" and is able to execute analyses of a mixture of gases, vapors, and odors. It is an artificial smell instrument that allows distinguishing and recognizing aromas using gas sensors (Rodriguez, 2019). This device has 4 subsystems: one that samples and evaluates the quality of the gas mixture, the gas sensor array that detects the gas mixture, the control electronics that manages the sensor array and signal quality, and the data acquisition and processing system that extracts characteristic features or "traces" of each aroma and reports the results to the user. Each function must be integrated into the drone and tested in flight. The compact eNose design can be used both in R&D laboratories and in field work with the addition of batteries. The data is processed with a versatile and friendly-interfaced recognition software that uses one of the following algorithms to process the data: PCA, Fisher and Linear Classifiers (Scott, 2006), (Webb, 2011).
Integration by parts
Since the eNose has its own hardware with a data acquisition system, this equipment should preferably be mounted on top of the drone. The system is powered by LiPO batteries that consist of 3 packs with 5200 mAh cells. Also, a GPS system must be installed in order to temporarily geolocate and synchronize the eNose measurements, so the measurements results will be correlated with the physical position of the drone and the measuring time. The drone's trajectory will be programmed according to different measurement needs and areas of interest. Once the characterization stage of the different systems is completed, the area of interest will be analyzed.
RESULTS
The implementation of an eNose drone system has the advantage of being a flexible system. This project was carried out with the objective of studying the negative environmental impacts arisen from volcanic eruptions, but the technological innovations of this project could be applied to other fields of monitoring. For example, controlling high-toxici-ty-risk areas due to the emission of gaseous pollutants, inaccessible for humans. Figure 9 shoes the assembled.
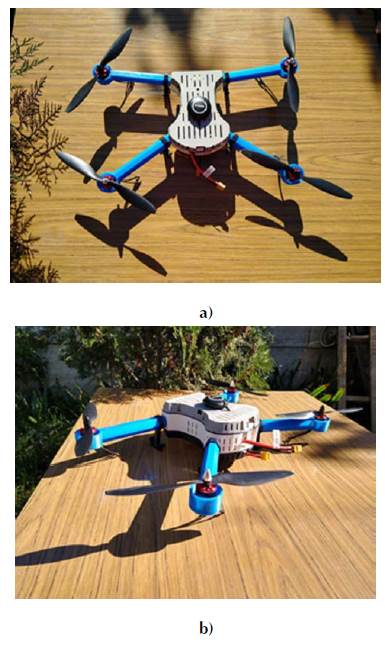
Figure 9: Assembled drone. (a) Top view. (b) Side view.
Gas sensor system
The eNose board tests were performed to verify the correct operation of the gas sensors. Different gases were injected using a Gas Bank. A Mass Flow Controller (MFC) generates different concentrations of gases to perform the calibration curve of the sensors.
For example, the response of a sensor for different CO concentrations is shown below, and figure 10 presents the logarithmic response. The normalized resistance of the sensor is plotted: Rs/Ro, where Rs is the resistance measured in the presence of gas, and Ro is the resistance in the presence of air.
Figure 10: Normalized sensor response for different CO concentrations.
CONCLUSIONS
The implementation of an eNose drone system and its application to the study and detection of gases in volcanic areas would be innovative in Argentina. It was designed for the prevention and minimization of negative environmental impacts arising from volcanic eruptions. The technological innovation on this work could be used on other monitoring applications, like controlling areas with a high risk of toxicity due to the emission of gaseous polluting substances, inaccessible by human contact, such as industrial effluent treatment plants, areas close to toxic spills, and volcanic formations. Furthermore, it contributes to reducing the risk of accidents to volcanologists from a human-safety point of view.
REFERENCES
License
Esta licencia permite a otros remezclar, adaptar y desarrollar su trabajo incluso con fines comerciales, siempre que le den crédito y concedan licencias para sus nuevas creaciones bajo los mismos términos. Esta licencia a menudo se compara con las licencias de software libre y de código abierto “copyleft”. Todos los trabajos nuevos basados en el tuyo tendrán la misma licencia, por lo que cualquier derivado también permitirá el uso comercial. Esta es la licencia utilizada por Wikipedia y se recomienda para materiales que se beneficiarían al incorporar contenido de Wikipedia y proyectos con licencias similares.