DOI:
https://doi.org/10.14483/23448393.23371Published:
2025-11-13Issue:
Vol. 30 No. 3 (2025): September-DecemberSection:
Civil and Environmental EngineeringAnalysis of Road Accidents in Colombia: Departmental Patterns and Trends from Vehicle Records
Análisis de la siniestralidad vial en Colombia: patrones departamentales y tendencias a partir de registros vehiculares
Keywords:
accident rate, vehicles, traffic, binomial analysis, road safety, clusters (en).Keywords:
accidentalidad, vehículos, tráfico, análisis binomial, seguridad vial, conglomerados (es).Downloads
References
National Road Safety Agency, “Anuario nacional de siniestralidad vial – Colombia 2023,” 2023. [Online]. Available: https://ansv.gov.co/es/observatorio/publicaciones/anuario-nacional-de-siniestralidad-vial-colombia-2023
J. I. Ruiz and A. N. Herrera, "Accidentes de tránsito con heridos en Colombia según fuentes de información: caracterización general y tipologías de accidentes," Revista CES Psicol., vol. 9, no.1, pp. 32-56, 2016. http://www.scielo.org.co/pdf/cesp/v9n1/v9n1a04.pdf
D. Herrero-Fernández, M. Oliva-Macías, and P. Parada-Fernández, "Prediction of accident rate from risky and aggressive behavior behind the wheel: Differences by age and gender," Rev. Psicopatol. Psicol. Clin., vol. 24, no. 3, pp. 159–169, 2019. https://doi.org/10.5944/rppc.23370
J. D. Parra-Quintero, J. A. Barrera-Cardozo, and P. Ramírez-Soto, "Factorial analysis of road infrastructure related to traffic accidents occurred in Neiva in the years 2017–2018," Dyna, vol. 91, no. 231, pp. 99–107, 2024. https://doi.org/10.15446/dyna.v91n231.110396
R. Mejia, E. Quinteros, and A. Ribo Arnau, "Áreas geográficas con mayor concentración de accidentes de tránsito en San Salvador, El Salvador: un análisis espacial del periodo 2014-2018," Rev. Peru. Med. Exp. Salud Publica, vol. 40, no. 4, pp. 413–425, 2023. https://doi.org/10.17843/rpmesp.2023.404.12963
Consejo Colombiano de Seguridad, "Cómo afecta el mal estado de las carreteras a la seguridad en el vehículo," Oct. 12, 2023. [Online]. Available: https://ccs.org.co/como-afecta-el-mal-estado-de-las-carreteras-a-la-seguridad-en-el-vehiculo/
AASHTO, Highway safety manual, 1st ed. Washington, DC, USA: American Association of State Highway and Transportation Officials, 2010.
I. Karamanlis, A. Nikiforiadis, G. Botzoris, A. Kokkalis, and S. Basbas, “Towards sustainable transportation: The role of black spot analysis in improving road safety,” Sustainability, vol. 15, no. 19, art. 14478, 2023. https://doi.org/10.3390/SU151914478
Ministerio de Transporte, "La Agencia Nacional de Seguridad Vial, ANSV, avanza con sus programas en los territorios del país," 2023. [Online]. Available: https://mintransporte.gov.co/publicaciones/11348/la-agencia-nacional-de-seguridad-vial-ansv-avanza-con-sus-programas-en-los-territorios-del-pais/
Ministerio de Transporte, Plan Nacional de Seguridad Vial 2022-2031. Bogotá, Colombia: Ministerio de Transporte, 2022.
Observatorio Vial Argentina, "Infraestructura vial: factor de riesgo de la seguridad vial," 2020. [Online]. Available: https://www.argentina.gob.ar/seguridadvial/observatoriovialnacional/infraestructura-vial-factor-de-riesgo-de-la-seguridad-vial
J. Qiu, H. Wang, R. Jiang, W. Xiao, H. Chang, and S. Zhu, "Identification and analysis of serious conflicts in expressway transition areas," China Safety Sc.i J., vol. 32, no. 2, pp. 184–191, 2022. https://doi.org/10.16265/j.cnki.issn1003-3033.2022.02.025
C.-W. Choe, S. Lim, D. J. Kim, and H.-C. Park, "Development of Spatial Clustering Method and Probabilistic Prediction Model for Maritime Accidents," Appl. Ocean Res, vol. 154, art. 104317, 2025. https://doi.org/10.1016/j.apor.2024.104317
F. Á. C. Escobar, G. P. Buitrago, and F. A. Guío B., "Spatial analysis with weighted kernel groupings to determine risk sectors due to traffic accidents in urban area. Tunja analysis, Colombia," Cuad. Geogr. Rev. Colomb. Geogr, vol. 62, no. 1, pp. 45–58, 2023. https://doi.org/10.30827/cuadgeo.v62i1.18025
J. L. Montealegre Quijano and J. A. Garzón Quiroga, "Critical points of traffic accidents in Ibagué, Colombia," Estud. Demogr. Urbanos, vol. 36, no. 4, pp. 298–312, 2021. https://doi.org/10.24201/edu.v36i2.2035
S. Chatti, G. Rama Krishna, S. Krishna Mohan Rao, and P. Venketeswa Rao, "A method to find optimum number of clusters based on fuzzy silhouette on dynamic data set," Procedia Comput. Sci, vol. 46, pp. 346–353, 2015. https://doi.org/10.1016/j.procs.2015.02.030
Y. H. Caña, R. Gomero-Cuadra, R. P. Llerena, J. Armada, and C. R. Mejía, "Work-related accident rates at a metropolitan Lima hospital during the COVID-19 pandemic: A behavioral analysis,” Rev. Asoc. Esp. Espec. Med. Trab., vol. 32, no. 4, pp. 297–307, 2023. https://scielo.isciii.es/scielo.php?script=sci_arttext&pid=S3020-11602023000400004
A. B. Silva and M. C. Oliveira, "Data integration process: An information management model for multiple databases on traffic accidents in Brazil," Epidemiol. Serv. Saude, vol. 27, no. 2, p. e201800218, 2018.2024. htttps://doi.org/10.5123/S1679-49742018000200018
V. Cantillo, P. Garcés, and L. Márquez, "Factors influencing the occurrence of traffic accidents in urban roads: A combined GIS-empirical Bayesian approach," Rev. Ing., vol. 40, no. 2, pp. 123–135, 2024. https://doi.org/10.15446/dyna.v83n195.47229
J. D. Alarcón, I. Gich Saladich, L. Vallejo Cuéllar, A. M. Ríos Gallardo, C. Montalvo Arce, and X. Bonfill Cosp, "Mortalidad por accidentes de tráfico en Colombia. Estudio comparativo con otros países," Rev. Esp. Salud Pública, vol. 92, art. e201807040, 2018. https://pubmed.ncbi.nlm.nih.gov/29967318/
G. Lozano Pérez, D. Muñoz Torres, and V. Villalba Vimos, "Road safety perspective in developing countries - Colombia," Rev. Espacios, vol. 39, no. 42, pp. 11-23, 2018. https://www.revistaespacios.com/a18v39n42/18394211.html
DANE, “Mapas Nacionales | GEOPORTAL.” [Online]. Available: https://geoportal.dane.gov.co/
L. Yue, C. Xiaoquan, D. Tian, and J. Feng , “Customer segmentation using K-means clustering and the adaptive particle swarm optimization algorithm,’ Appl. Soft Comput., vol. 113, art. 107924, 2021. https://doi.org/10.1016/j.asoc.2021.107924
A. Baíllo y A. Grané, 100 problemas resueltos de estadística multivariante. Madrid, Spain: Delta Publicaciones Universitarias, 2007.
A. Jain, M. Murty, and P. Flynn, “Data Clustering: A Review,” ACM Comput. Surv., vol. 31, nº 3, pp. 264–323, 1999. https://doi.org/10.1145/331499.331504
J. L. Devore, Probability and statistics for engineering and the sciences, 8th ed. Boston, MA, USA: Brooks/Cole, Cengage Learning, 2012.
C. Rosas, C. Gaviria, and C. Calero, “Classification of Driver Behavior in Horizontal Curves of Two-Lane Rural Roads,” Rev. Fac. Ing., vol. 30, no. 57, art. e13410, 2021. https://doi.org/10.19053/01211129.v30.n57.2021.13410
H. Taherdoost and M. Madanchian, “A Comprehensive Overview of the ELECTRE Method in Multi Criteria Decision-Making,” J. Manage. Sci. Eng. Res., vol. 6, no. 2, pp. 5–16, 2023. https://doi.org/10.30564/jmser.v6i2.5637
F. Castro, “The geosimulation, a tool for the prevention of traffic accident,” Ing.Inv. Tecnol., vol. 19, no. 2, pp. 135–145, 2018. https://doi.org/10.22201/fi.25940732e.2018.19n2.012
A. C. Yeo, K. A. Smith, R. J. Willis, and M. Brooks, "Clustering technique for risk classification and prediction of claim costs in the automobile insurance industry," Intell. Syst. Account. Finance Manage., vol. 10, no. 1, pp. 39–50, 2001. https://doi.org/10.1002/ISAF.196
D. Wang, Y. Huang, and Z. Cai, "A two-phase clustering approach for traffic accident black spots identification: integrated GIS-based processing and HDBSCAN model," Int. J. Inj. Control Saf. Promot., vol. 30, no. 2, pp. 270–281, 2023. https://doi.org/10.1080/17457300.2022.2164309
B. Sui, N. Lubbe, and J. Bärgman, "A clustering approach to developing car-to-two-wheeler test scenarios for the assessment of Automated Emergency Braking in China using in-depth Chinese crash data," Accid. Anal. Prev., vol. 132, art. 105242, 2019. https://doi.org/10.1016/j.aap.2019.07.018
S. S. Yassin and Pooja, "Road accident prediction and model interpretation using a hybrid K-means and random forest algorithm approach," SN Appl. Sci., vol. 2, no. 9, 2020. https://doi.org/10.1007/s42452-020-3125-1
How to Cite
APA
ACM
ACS
ABNT
Chicago
Harvard
IEEE
MLA
Turabian
Vancouver
Download Citation
Recibido: 20 de marzo de 2025; Aceptado: 5 de agosto de 2025
Abstract
Context:
The high rate of road accidents in Colombia constitutes a serious public health issue. This study seeks to identify spatial patterns in the occurrence of traffic accidents at the departmental level. Based on these data, the aim is to better understand the factors that influence road accidents in order to propose more effective prevention strategies.
Method:
To this effect, a cluster analysis based on the K-means algorithm and binomial analysis was used. These statistical techniques allowed grouping Colombian departments according to their accident profile, considering variables such as geographical location, incidents, the validity of vehicle documents, and the presence of new road actors.
Results:
The results of the analysis revealed three groups of departments with different accident rates: high, medium, and low. This classification makes it possible to identify regions with a higher risk of suffering road accidents and determine their associated factors, such as population density and road conditions. This study demonstrates the usefulness of cluster analysis to identify spatial patterns in road accidents at the departmental level.
Conclusions:
The results obtained contribute to a better understanding of the factors that influence the occurrence of traffic accidents in Colombia, which enables the design of more focused and effective prevention strategies. Future research could delve into the analysis of the socioeconomic and cultural factors associated with road accidents, in addition to exploring the application of predictive models to anticipate the occurrence of accidents.
Keywords:
accident rate, vehicles, traffic, binomial analysis, road safety, clusters.Resumen
Contexto:
La alta accidentalidad vial en Colombia constituye un serio problema de salud pública. Este estudio busca identificar patrones a nivel departamental en la ocurrencia de accidentes de tránsito. Con base en los datos de accidentalidad, se busca comprender mejor los factores que influyen en los sucesos para proponer estrategias de prevención más efectivas.
Método:
Se utilizó un análisis de conglomerados basado en el algoritmo K-medias y un análisis binomial. Estas técnicas estadísticas permitieron agrupar los departamentos colombianos según su perfil de accidentalidad, considerando variables como: la ubicación geográfica, los incidentes, la validez de los documentos vehiculares y la presencia de actores viales.
Resultados:
Los resultados del análisis mostraron tres grupos de departamentos con diferentes tasas de accidentalidad: alta, media y baja. Esta clasificación permite identificar las regiones con mayor riesgo de sufrir accidentes viales y determinar los factores asociados, como la densidad poblacional y el estado de las carreteras. Este estudio demuestra la utilidad del análisis de conglomerados para identificar patrones de comportamiento espacial en accidentalidad vial a nivel departamental.
Conclusiones:
Los resultados obtenidos contribuyen a una mejor comprensión de los factores que influyen en la ocurrencia de accidentes de tránsito en Colombia, lo que permite diseñar estrategias de prevención específicas y eficaces. Futuras investigaciones podrían profundizar el análisis, con factores socioeconómicos y culturales asociados a los accidentes de tránsito. Además, de explorar la aplicación de modelos predictivos para anticipar la ocurrencia de accidentes.
Palabras clave:
accidentalidad, vehículos, tráfico, análisis binomial, seguridad vial, conglomerados.Introduction
According to the National Road Safety Agency 1 , the main causes of traffic accidents in the country are excessive speed (42.91 %), failure to obey traffic signals (32.51 %), and driving under the influence of alcohol (4.94 %). These factors pose a significant risk to road safety and highlight the need to strengthen control and prevention strategies regarding mobility.
According to 2, five risk factors associated with traffic accidents have been identified, among which driving under the influence of alcohol, excessive speed, and the lack of protective systems (e.g., helmets and seat belts) stand out. The same study reports that, in 2002, out of 6063 traffic-related deaths in Colombia, 39 % involved pedestrians, 19 % involved passengers, and 15 % involved motorcyclists. Additionally, 75 % of these accidents involved men, indicating that the male gender has been the most affected. This trend has remained consistent over time.
The analysis of accident rates in the context of risky and aggressive driving behaviors, as presented in the study by 3, reveals that factors such as age and gender significantly impact traffic accident rates. The results indicate that men and young drivers tend to exhibit riskier driving behaviors, which are associated with a higher likelihood of accidents. This study underscores the importance of identifying and addressing these behaviors to improve road safety.
In a different context, the study by 4 in Neiva, Colombia, examines the road infrastructure and its relationship with urban traffic accidents. The findings indicate that factors such as vehicle type, time of day, and road infrastructure characteristics play a crucial role in accident frequency, with motorcyclists being the most vulnerable victims. Combining these studies highlights the relevance of both driver behavior and road infrastructure in preventing traffic accidents, suggesting that improving road safety requires interventions targeting both driver conduct and infrastructure improvements.
Additional important factors, such as location, the lack of road safety systems for drivers, and road infrastructure conditions, contribute to a higher incidence of traffic accidents in certain areas 5. Likewise, studies such as that of the Colombian Safety Council 6 have shown that road conditions are a determining factor in the occurrence of accidents, as they influence both driver behavior and vehicle performance. In this context, geographic location and driving behavior play a significant role 7).
In an article on how black spots can significantly improve road safety, 8 argue that this is a key aspect in analyzing road safety. Addressing these areas, where most accidents occur, helps to reduce the likelihood of their recurrence. Moreover, in a broader sense, this approach could not only identify specific black spots, but also reveal ‘black departments’, or regions characterized by high accident rates. This may be influenced by multiple factors such as vehicle flow, the mandatory traffic accident insurance (SOAT), driver’s licenses, and vehicle registrations, among other elements that contribute to this phenomenon. In 2023, the Colombian government implemented various initiatives aimed at strengthening driver capabilities and improving road safety. These actions align with the objectives of the Decade of Action for Road Safety. The Ministry of Transport’s territorial programs 9 and the Global Plan for Road Safety 2021-2030 10 prioritize the improvement of road infrastructure as a key measure to reduce traffic-related fatalities, with projections extending to the year 2030 11.
Research in the field of road safety has advanced significantly due to the development of statistical models and machine learning techniques. Studies such as those by 12 and 13 have demonstrated the usefulness of these models in identifying patterns in accident data and assessing the impact of various risk factors. By analyzing variables such as vehicle type, traffic flow, and road characteristics, these models enable the development of more effective strategies for accident prevention and road safety improvement.
The studies by 14 and 15) address issues related to traffic accidents in Colombian urban contexts, emphasizing the importance of identifying high-risk points to enhance road safety. In the case of Tunja, 14 applied spatial analysis, using geoprocessing techniques and kernel density estimation to identify risk-prone areas based on accident concentration while considering socio-spatial variables such as land use and traffic flows. This approach helps to delineate zones with a high probability of accidents, offering a useful framework for planning and managing road safety in urban areas. On the other hand, 15 focused on Ibagué, determining that, aside from factors such as mechanical failures and recklessness, decision-making errors at critical points like roundabouts significantly contribute to accident rates. Both studies agree on the need for an integrated approach to road risk management, incorporating both infrastructure and driver behavior to reduce accidents and improve public safety.
According to 16, the K-means and K-medoids algorithms are widely used in partition- based clustering techniques. These algorithms form clusters based on their centers, but they require the number of clusters (k) to be specified beforehand. To determine this optimal number, it is essential for the user to have adequate knowledge of the application dataset, as the value of k depends on the specific characteristics of the data. There are various methods for identifying the correct number of clusters, including the rule of thumb, cross- validation, the elbow method, information-based criteria, and the core matrix. However, most of these approaches require clustering beforehand in order to estimate the appropriate number of clusters.
According to the study by 17, which was conducted in a hospital in Metropolitan Lima during the COVID-19 pandemic, a significant increase in occupational accidents was observed during the pandemic. These included crush injuries, assaults, internal trauma, sprains, and fractures, notably impacting the lumbosacral region and fingers. This rise highlights the risks faced by healthcare workers during a public health crisis. In contrast, the work by 18 on the handling of traffic accident data in Brazil demonstrates how information can be effectively managed by integrating multiple databases. This process, implemented in five pilot capitals of the Vida no Transit project, enabled the creation of a unified victim list and the reclassification of accidents as severe or fatal. The results showed a significant increase in the number of recorded victims, emphasizing the importance of accurate data for planning and evaluating road safety actions. Although they address different contexts (occupational and traffic accidents), both studies agree on the importance of data collection and analysis to understand and mitigate risks in various domains. They suggest that improving safety requires integrating effective information systems and making decisions based on reliable data.
Furthermore, 19 analyzed factors affecting traffic accidents in Cartagena, Colombia, using a geographic information system (GIS) and a Bayesian approach. They identified 69 sections with a high propensity for accidents, noting that motorcycles have a higher accident rate than cars, and that commercial areas experience more accidents due to the high presence of pedestrians. The study by 20 compared the adjusted traffic accident mortality rates (TAMR) in Colombia, Spain, and the United States, highlighting that Colombia has higher rates due to its lesser development in road safety. However, the European guidelines implemented by Spain have contributed to a reduction in mortality rates, whereas the United States demonstrates limited adherence to international guidelines, which also affects its TAMR.
As for developing countries, the analysis by 21 highlights Colombia’s progress in adopting regulations to improve road safety. Nevertheless, despite recent legislative efforts, the country still faces significant challenges in enforcing and ensuring the effectiveness of these measures. This reflects the general situation in developing nations, where implementing road safety policies remains a priority.
After conducting a literature review, we determined that the factors with the most significant influence on road accidents are those provided by the National Road Safety Agency (ANSV). Therefore, this research aimed to find solutions to traffic safety problems by addressing questions such as: Do vehicle registration data influence accident rates? Is it possible to predict accidents based on the analysis of this data? and Is it feasible to classify accident-prone zones by department using this information? In line with these questions, the research objectives were firstly, to demonstrate the influence of vehicle registration records on road accident rates; secondly, to demonstrate the importance of analyzing variables in understanding road accidents and how they affect road behavior; and finally, to identify critical accident zones based on available information and analyze how these affect road safety in their corresponding regions.
Methodology
Location
Fig. 1 shows the geographical distribution of Colombia’s 32 departments, serving as a fundamental reference for territorial and regional analysis. This spatial context is essential for identifying accident-prone areas and understanding regional differences regarding road safety. This map supports the examination of factors such as traffic flow, infrastructure, and administrative divisions. It provides the basis for targeted strategies aimed at reducing road accidents across the country.
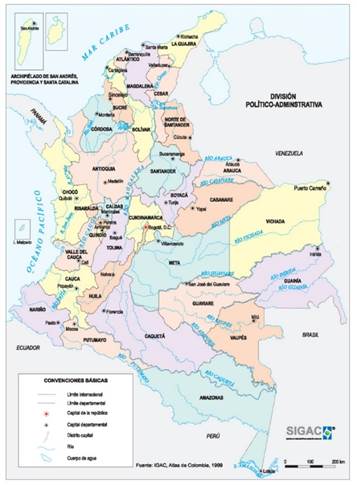
Figure 1: Map with the 32 departments of Colombia
The research methodology was structured in three main phases, as illustrated in Fig. 2: database construction and segmentation, cluster center analysis, and the accident prediction model for improving road safety in Colombia. To conduct an analysis of accidentality based on a cluster distribution, various methods were employed to segment the data according to their characteristics and behavior. The criteria for segmentation were dictated by the distance between the data points. Grouping was executed using the K-means method, one of the most commonly utilized techniques for the specific purpose of data clustering 23.
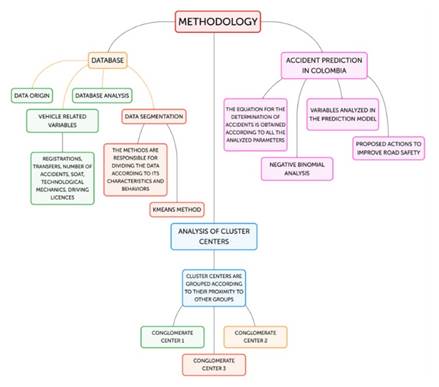
Figure 2: Methodology
This cluster analysis method aims to classify data related to a specific study, facilitating the formation of groups with a higher level of identification. This process is executed through the approximation of distance matrices, which are developed according to specific criteria 24. This method seeks to unite similar elements, providing solutions for addressing challenges related to pattern clustering, decision-making, data mining, and machine learning, among others. Conceptually, it deals with the representation of patterns, evaluates similarities, performs grouping, and ultimately aids in visualizing the resulting clusters 25.
The database utilized in this study was obtained from the National Single Traffic Registry (RUNT) and the ANSV. These data were essential for the efficient consolidation and distribution of vehicle-related variables, including registrations (the official identification records of vehicles, comprising a unique combination of letters and numbers), transfers (the formal process of transferring vehicle ownership), the number of fatal accidents (the total number of accidents resulting in the loss of human lives), the SOAT (the mandatory traffic accident insurance, covering medical expenses for victims), technical inspections (mandatory reviews ensuring compliance with safety and emissions standards), and driver’s licenses (official documents authorizing individuals to operate vehicles on public roads after passing the required examinations). Based on these variables, an analysis was conducted in order to determine the distribution of the 32 departments in Colombia, following a data normalization process that incorporated population figures from the 2018 census conducted by the National Statistics Department (DANE).
Equations
To conduct this type of analysis, it is essential to determine the number of clusters into which the data will be divided. Consequently, it is necessary to normalize the data in order to ensure that all groups are on equal footing 26. In this work, the K-means method was employed for group separation 27. This method groups the data’s spatial position and their distance to a random point within an iterative process directed by Eq. (2). The proposed process includes: (i) assigning a random position to each element (speed profile), (ii) calculating the distance of each element and grouping those with similar values according to Eq. (1), (iii) calculating the group center location using Eq. (2), and (iv) iterating between steps (iii) and (iv) until the sum of the distances of the elements is minimized, as evaluated via Eq. (3) 28).

where n is the number of iterations, k the number of clusters, Cj(n) the cluster center for j = 1,2,...,k; D(Xi+1,Cj(k) the distance for i = 1,2,...,k; and Wj the cluster center. The result of this process assigns a value (1,2,3,...,n) to each analyzed speed profile, indicating the cluster to which it was assigned.
Results
This section provides a detailed overview of the results obtained from the analyzed methodological procedures.
Table I presents data related to the 32 departments of Colombia and their vehicular records, including registrations, transfers, SOAT, and technical-mechanical inspections. These descriptive statistics characterize the sample to facilitate grouping based on accidentality.
Note: A2022 and A2023 correspond to accidents recorded in the years 2022 and 2023
Table I: Basic statistical description of the sample
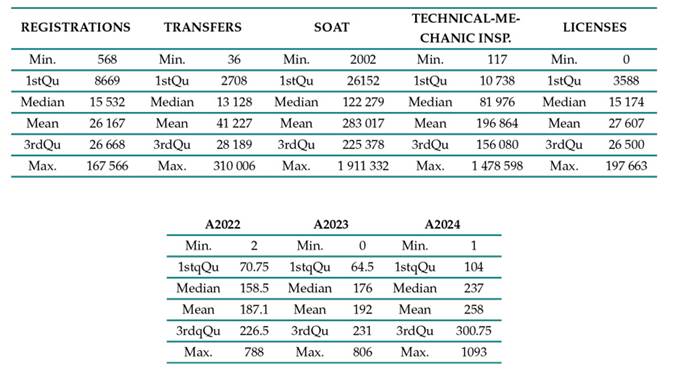
Table II presents the classification of the departments according to their population, which was normalized based on the analysis using the K-means method. This was complemented with a distribution selected through predefined criteria. Through this analysis, each department was assigned to one of three groups (1, 2, or 3). Subsequently, the incidence of accidents within each group was evaluated and classified as high, medium, or low, according to the criteria established in this study.
Table II: Group distribution of the 32 departments of Colombia
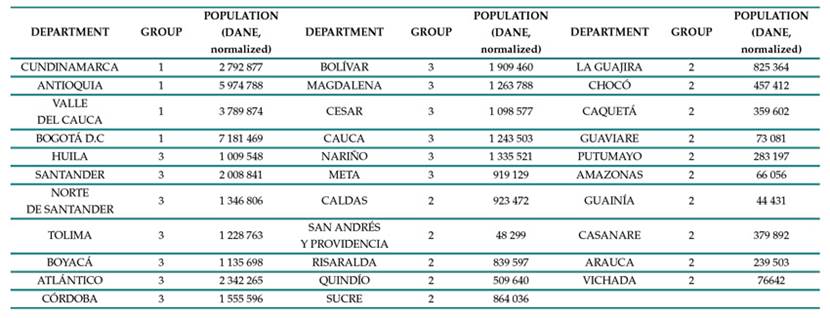
Fig. 3 presents the distribution of the 32 departments of Colombia, comprising three clusters based on the number of accidents for every 100 000 inhabitants in 2022 and 2023. The departments are represented by colored points, with each cluster identified by a specific color and number, providing an overview of the spatial distribution of accidents in Colombia. Note that the departments with a higher number of accidents are concentrated in the central part of the country, while those with a lower number of accidents are located in peripheral regions.
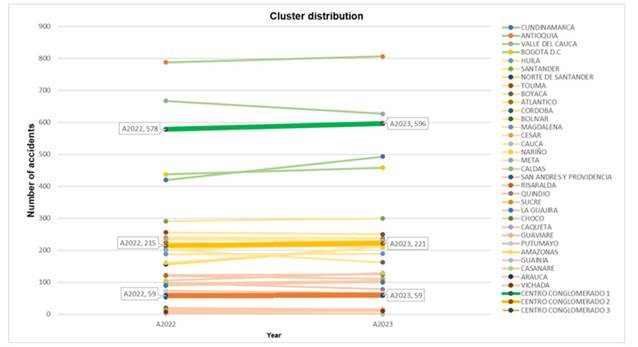
Figure 3: Cluster distribution
The center of cluster 1 includes the departments with the lowest number of accidents, with 24 to 25 accidents for every 100 000 inhabitants. The departments in this group are Cundinamarca, Antioquia, Valle del Cauca, and Bogotá DC. Cluster 2 comprises the departments with the highest number of accidents, with 14-15 accidents for every 100 000 inhabitants. The departments in this group include Huila, Santander, Norte de Santander, Tolima, Boyacá, Atlántico, Córdoba, Bolívar, Magdalena, Cesar, Cauca, Nariño, and Meta. Cluster 3 encompasses the departments with a moderate number of accidents, reporting 4 to 5 accidents for every 100 000 inhabitants. This group includes the remaining 19 departments, significantly influencing the overall distribution of accidents in the country.
However, departments with a higher number of accidents and a higher risk classification should be the central focus of road safety policies. Prioritizing these areas enhances decision-making processes and encourages the implementation of specific measures, such as contingency plans, road infrastructure and signage improvements, and awareness campaigns.
Fig. 4 presents a graphical analysis of the weighting of the cluster centers. It illustrates how they are grouped based on their proximity to other groups, identifying accidents that occurred in 2022 and 2023. This information could prove valuable in determining the areas of the country that require greater attention with regard to accident prevention. Here, the cluster with the lowest number of accidents is in black, the cluster with a moderate number of accidents is labeled green, and the cluster with the highest number of accidents is in red.
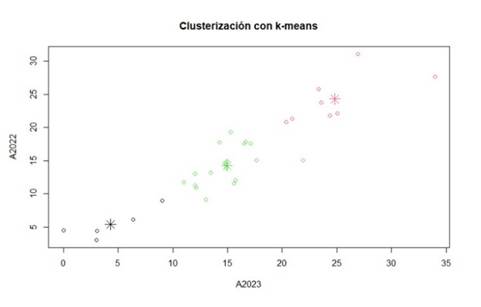
Figure 4: K-means clustering
In the Cartesian plane, the X-axis quantifies the number of traffic accidents that occurred in 2023 (A2023), while the Y-axis represents the incidents recorded in 2022 (A2022). Each point on the graph corresponds to a department, and the color coding indicates cluster membership as defined through the K-means algorithm. Additionally, the asterisks represent the location of each group’s centroid, which serves as the geometric center of each cluster within the analytical space. This facilitates the interpretation of regional trends in road accidentality, revealing marked regional differences that are associated with traffic density and the effectiveness of local road safety policies.
The following three figures analyze the variation in the percentage of accidents by department for the years 2022 and 2023. This analysis is based on the classification of cluster centers 1, 2, and 3, which enables a deeper understanding of the distribution and behavior of accidents in the country. The main objective is to identify patterns and trends at the departmental level. This information is crucial for decision-making regarding road safety.
This article sought to analyze the departments with the highest and lowest percentage of accidents, the trends in accidents, and the impact of socioeconomic factors in this regard. The results have important implications for the design of public policies and academic research in the field of road safety. Although there are limitations in relation to the availability and quality of the data, we expect that this analysis will serve to understand and address the issue of road accidents in Colombia.
Fig. 5 shows the results of the classification performed using cluster analysis, which identified territorial groupings with similar characteristics in terms of variables associated with the occurrence of road accidents. In the specific case of cluster 1, corresponding to the areas or departments with the highest incidence of accidents, a direct relationship is evident between this classification and key variables such as the number of registered vehicles, population density, and vehicular activity. This is observed in Bogotá, as it belongs to this cluster 1 and represents the lowest percentage of accidents in this classification, accounting for approximately 5 % of the total number of recorded accidents. This allows inferring and highlighting the importance of this city, combined with its high population density and level of road activity, reinforcing and consolidating its position within this group. Based on the above, this classification not only responds to the absolute number of accidents; it is also influenced by the behavior of the variables considered in this work, which show greater intensity and correlation in this group when compared to clusters 2 and 3. Therefore, the results suggest that the grouping of these departments is strongly determined by structural and dynamic factors of vehicular traffic, which provides a consolidated technical criterion for interpreting and prioritizing road safety intervention within the analyzed areas.
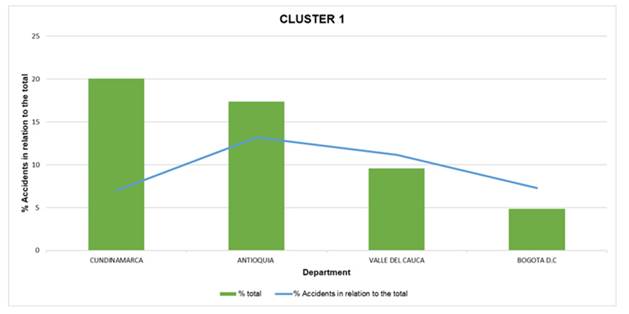
Figure 5: Cluster 1
Fig. 6 presents a comparative representation of the total percentage of records and the percentage of accidents with respect to the total number of registered vehicles for each of the departments in cluster 2. We evidenced a heterogeneous distribution of accidents concerning the proportion of each department within the group. Some departments, such as Santander and Norte de Santander, exhibit higher accident percentages than the cluster average, highlighting that, despite having similar relationships with the total records, their road accident rates are higher in comparison with others in the same group. In contrast, departments such as Boyacá and Tolima show a lower proportion of accidents in relation to their total representation, which suggests a more favorable behavior in terms of relative road safety.
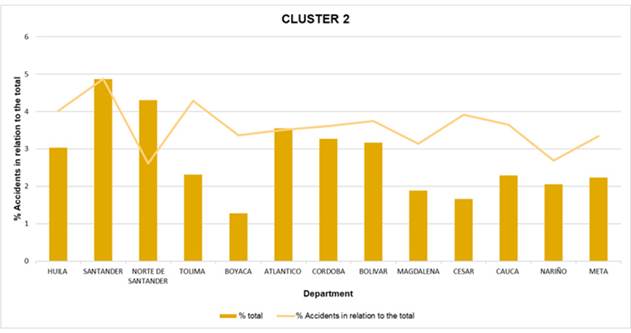
Figure 6: Cluster 2
Fig. 7, representing cluster 3, shows the departments with the lowest levels of road accidents in Colombia. This cluster is particularly notable for its low population density, lower volume of registered vehicles, and lower traffic volumes, which reflects its low percentages regarding both the absolute number of accidents and its relative incidence within the country. Some departments, such as Guainía, Vaupés, Amazonas, and Vichada, have near-zero percentages in both variables, suggesting a rather limited road exposure, attributed to their geographic location. Departments such as Putumayo, Guaviare, and Caquetá also have higher proportions within the cluster, although their percentages are lower than 2 %, which is consistent with the classification. Considering that this cluster corresponds to a low accident rate, its analysis is vital, as the presence of specific events or future territorial growth can alter these conditions, especially in departments with emerging development dynamics. Finally, an approximate prediction of accident behavior was generated through a negative binomial analysis, which initially utilized the analyzed variables. The aim was to consolidate and adjust this analysis by examining the strength of the variables in the prediction.
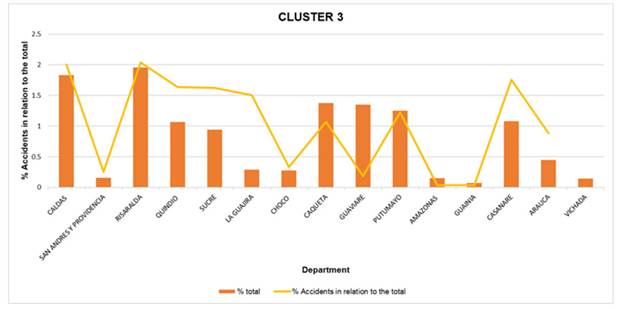
Figure 7: Cluster 3
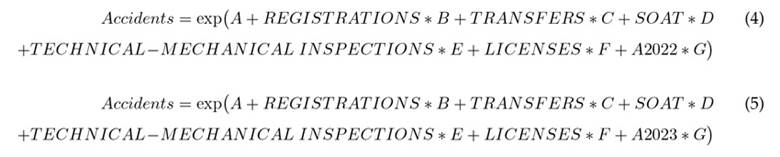
Eq. (4) presents the initial model, which was based on accident data from the year 2022. In contrast, Eq. (5) represents an updated version of the model that incorporates data from 2023 in order to generate an accident prediction for 2024.
According to Table III, we analyzed each of the constants in the mathematical model related to accident prediction. Each constant (A-G) indicates the influence of a variable on the number of accidents. Constant A represents the baseline level of accidents when all other variables are zero. Coefficient B shows that a higher number of registered license plates increases the number of accidents. Conversely, coefficient C indicates that more transfers are associated with fewer accidents, possibly due to vehicle renewal. Coefficient D (SOAT) also shows a slight inverse relationship, suggesting that greater insurance compliance may slightly reduce accidents. The technical-mechanical inspection variable has a positive effect, perhaps because more inspections reflect a greater number of vehicles in circulation. Coefficient F indicates that more licenses mean more drivers and, therefore, a higher risk of accidents. Finally, coefficient G (accidents in 2022) has the greatest influence, showing that accident rates tend to remain similar from one year to the next.
Table III: Accident prediction by department of Colombia
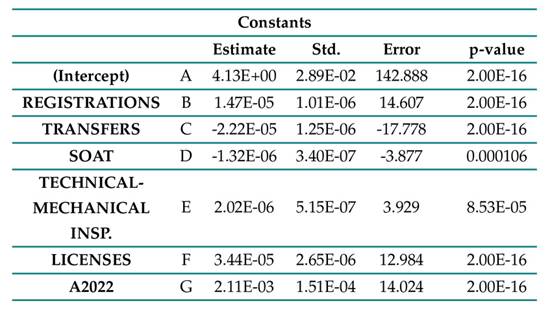
The p-value indicates whether the estimated effect of each variable on accidents is statistically significant. When the p-value is less than 0.05, there is sufficient evidence to indicate that the variable has a real effect on accidents. For example, variables such as transfers, licenses, and A2022 have extremely low p-values (2.00E-16), indicating a high statistical significance. The SOAT variable, although it has a very small coefficient, has a p-value of 0.000106 (also less than 0.05), so its effect, although weak, is statistically significant. It should be noted that a low p-value does not necessarily imply that the variable has a large impact on the equation but rather highlights that its effect is consistent.
Considering the above, it should be highlighted that the prediction model uses the exponential function through a regression equation, as the variables to be analyzed are related to the number of accidents. This ensures that the predictions are always positive values.
Discussion
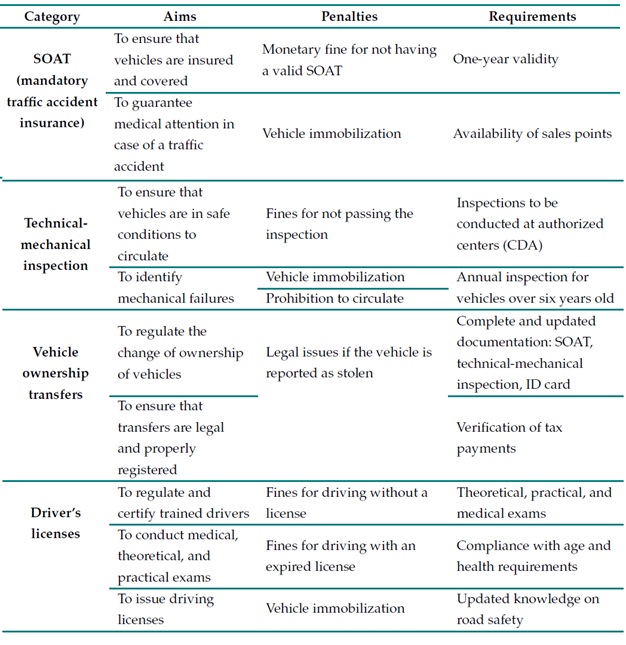
In order to improve road safety, policies aimed at reducing accidents must be designed based on the identification of patterns regarding the factors that influence accident records, driver behavior, and vehicle conditions. With this information, both the Ministry of Health and the Ministry of Transportation, in collaboration with the ANSV, will be able to identify how various variables influence the occurrence of traffic accidents. Key variables to consider include vehicle registration, the number of licenses, technical-mechanical inspections, and the SOAT. This not only optimizes the control of road safety but also contributes to a more efficient and equitable management in the distribution of preventive measures, especially in departments with high accident rates. This allows for policies focusing on specific areas and creates a more robust structure for accident reduction.
In this sense, one possible strategy could be the creation of point-based license types, which would incentivize responsible driving and reduce accidents. With a more effective license allocation system, adapted to the needs of each driver according to their history and performance, which considers and understands the impact of these variables on accidents, public policies can be formulated in order to mitigate the occurrence of accidents in high-risk and critical areas through improvements in the registration and regulation of licenses, the SOAT, and technical-mechanical inspections.
Table IVpresents the public policies considered in this work, as well as their proposed aims, penalties, and requirements.
Table IV: Public policies analyzed in this work
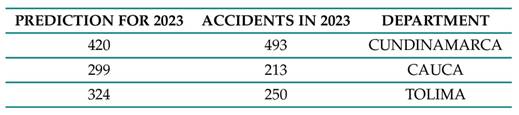
Our model for accident prediction by department in Colombia was tested in Cundinamarca, Cauca, and Tolima, based on data from 167 566 vehicle registrations, 158 595 ownership transfers, 1 242 294 vehicles with SOAT and 795 736 with technical-mechanical inspection, 639 590 driver’s licenses, and 420 accidents during 2022—as well as 493 in 2023 for the department of Cundinamarca. Using these data, the model demonstrated high accuracy. It predicted 458 accidents, and 493 actually occurred in 2023; there was a difference of only 35 accidents compared to the initial figures based on 2022 data.
This analysis validated the robustness of the model and its ability to anticipate the number of accidents with a minimal margin of error. The early prediction of accidents allows authorities and road safety agencies to design and implement more effective prevention and mitigation strategies, as it enables the identification of patterns, trends, and risk factors associated with accidents. With this advance information, resources can be optimized, efforts can be focused on critical areas, and awareness campaigns aimed at reducing the incidence of accidents in each department can be promoted.
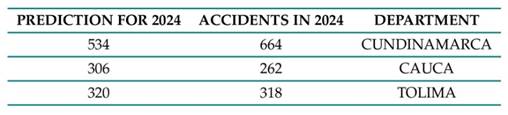
Based on the above, Tables V and VI present a summary of the departments and the years analyzed, confirming the accuracy obtained with respect to an update made for the year 2024. This demonstrates that the prediction model continues to function correctly, as the estimated values closely match the observed data.
Tables V: Accident prediction for 2023
Tables VI: Accident prediction for 2024
It is essential to highlight that this study presents an initial analysis whose purpose is to establish a baseline for understanding the observed conditions. In addition, it incorporates data from the previous year, which makes it easier to identify key trends for a correct interpretation. According to 29, traffic accidents are a major public health issue and the second leading cause of death for individuals aged five to 29. This study examines the application of geosimulation as a means to prevent these accidents. Through computational models that integrate geospatial data and traffic variables, it is possible to simulate various scenarios and evaluate the impact of factors such as road infrastructure and driver behavior. This approach enables the identification of high-risk areas and the planning of more effective interventions to enhance road safety.
The use of advanced tools such as GIS, neural networks, and agent-based models is significantly transforming the analysis and prevention of traffic accidents. These technologies offer a more dynamic and detailed approach, allowing for a deeper understanding of the conditions that contribute to these events and facilitating the design of specific strategies to mitigate them. GIS, for instance, are essential for creating maps that identify areas with the highest incidence of accidents. Moreover, they enable the integration of key information, such as traffic volume, weather conditions, and proximity to high-risk locations. These comprehensive analytical capabilities provide traffic management authorities with a more complete understanding of the factors associated with accidents, thereby facilitating the planning of targeted interventions for each problematic area.
In this research, however, we were unable to apply this method due to its reliance on specific variables such as traffic density, vehicle speed, road characteristics (including geometry and pavement conditions), and driver behavior, all focused on a specific study area. Instead, our data were gathered on a global scale using information from the RUNT and the ANSV, covering all 32 departments of Colombia. Nonetheless, in a more detailed study, it would be feasible to combine these approaches and replicate the method to achieve more accurate results.
A study conducted in Kazakhstan applied K-means clustering analysis to vehicle liability insurance data, classifying claims based on their frequency and severity. This technique allowed insurers to optimize premium pricing and improve risk detection. Although the study was carried out in a different context, the results could be applicable to systems such as the SOAT in Colombia, using equivalent variables to identify accident patterns among policyholders 30.
Similarly, in the city of Medellín, Colombia, a geospatial K-means clustering model was implemented to analyze high-risk areas associated with traffic accidents, grouping zones according to the type of incident (e.g., collisions, pedestrian runovers, etc.). This approach enabled the identification of accident patterns related to specific environmental features, such as proximity to bars or parks. Although the study did not include variables like driver’s licenses or technical-mechanical inspections, it demonstrated that spatial clustering techniques are useful for identifying high-accident zones based on environmental characteristics 31.
In developed countries such as Switzerland and other European nations, latent class clustering (LCC) techniques have been applied for analyzing the severity of pedestrian accidents using contextual and geographic variables. This methodology has allowed researchers to identify specific factors influencing accident severity. By employing LCC, more adaptive and accurate predictive models have been developed to enhance prevention strategies and improve road safety by integrating various factors that affect accident occurrence 32.
Furthermore, studies conducted in the United States and Ethiopia have combined the use of K-means methods with classification algorithms such as random forests and naïve Bayes to improve accident severity predictions. This process involves grouping incidents by shared characteristics and then applying classification models within each group to determine severity levels 33.
Finally, in Italy, researchers have explored the integration of geographic information—such as climate, land use, and points of interest—through machine learning techniques. This combination has significantly improved the prediction of accident risk by considering multiple environmental factors (?).
It should be highlighted that these studies were mostly conducted in highly developed countries, which allows them to rely on advanced road intelligence systems and robust databases. In contrast, developing countries like Colombia are beginning to adopt integrated techniques that combine clustering and classification, although they still face significant challenges related to data availability, quality, and standardization.
Conclusions
In summary, this work confirmed the viability of the classification of groups using the K-means method based on the incidence of accidents from current data. Three clusters were identified: high, medium, and low accident rates. We acknowledge the potential to improve the results through the expansion of the database provided by the RUNT and the ANSV. The inclusion of additional data, especially those related to vehicle records, could significantly enrich the analysis and enhance the accuracy of the initial accident prediction model. This approach could offer valuable insights for traffic safety management by providing a more comprehensive and detailed understanding of the factors contributing to accident incidence.
After identifying the departments with high accident rates based on various records (vehicle registrations, SOAT, and technical-mechanical inspections, among others), the actions to be implemented by the ANSV and other government entities could be more precisely focused. Additionally, by assessing the influence of factors such as driving licenses and technical-mechanical inspections on accident prediction, it can be concluded that increasing the number of issued licenses and improving the review process for said inspections will lead to significant improvements in road safety. These actions can be implemented through educational, preventive, and punitive campaigns.
Moreover, an initial accident prediction model was developed in this work, which, as previously mentioned, considers vehicle parameters such as vehicle registration, SOAT, and ownership transfers, among others. These aspects are essential for enhancing the accuracy and effectiveness of the analysis, as they facilitate targeted actions aimed at establishing sustainable and long-lasting mechanisms for improving road safety and designing safer roadways. Ultimately, it is emphasized that cluster analysis is a tool with significant potential in the field of road engineering, although it has not received the necessary attention, as there are limited references on the subject. This type of analysis can be employed to understand and improve various aspects, such as road safety to prevent traffic accidents, human factors, simulation, and traffic flow on highways. It is also crucial to have a database derived from real information.
References
License
Copyright (c) 2025 karla fernanda mora chacon, Cristian David Rosas Lopez, Mariana Ulchur Ruiz

This work is licensed under a Creative Commons Attribution-NonCommercial-ShareAlike 4.0 International License.
![]()
From the edition of the V23N3 of year 2018 forward, the Creative Commons License "Attribution-Non-Commercial - No Derivative Works " is changed to the following:
Attribution - Non-Commercial - Share the same: this license allows others to distribute, remix, retouch, and create from your work in a non-commercial way, as long as they give you credit and license their new creations under the same conditions.

2.jpg)