DOI:
https://doi.org/10.14483/22484728.7864Published:
2014-06-03Issue:
Vol. 8 No. 1 (2014)Section:
A Case-Study VisionBiomedical instrumentation applications using PSoC microcontrollers
Keywords:
Biomedical Instrumentation, Microcontroller, PSoC, Analog Filter Digital Filter. (es).Downloads
References
De Lorenzo Group, “DL 3155BIO5 Electrocardiograma, Electroencefalograma, Electromiograma”, 2012. Available in:http://goo.gl/5FFdZ.
B . Kropf, Application Note 2104 PSoC Dynamic Reconfiguration.
Cypress Semiconductor, PGA User Module Datasheet PSoC Designer V. 4.4.
Cypress Semiconductor, USB UAR T User
Module Datasheet PSoC Designer V. 4.4.
Cypress Semiconductor, 8-Bit Delta Sigma ADC User Module Datasheet PSoC Designer V. 4.4.
Cypress Semiconductor, Two Pole Low Pass Filter User Module Datasheet PSoC Designer V. 4.4.
W. Urbina y F. Martínez, “Implementación de un electromiógrafo con interfaz USB". Revista Tecnura, vol. 16, nº 33, pp. 117-130, 2012.
C. T. E., Et. al, “EMG Electromiografo”,2012. Available in: http://proton.ucting.udg.mx/expodec/abr99/e53/e_53.html.
M ikroElektronika, “Easy PSoC”, Julio de 2006. Available in: http://es.scribd.com/doc/75347899/Chapter-1-Introductionto-PSoC-Architectureand-Programmingof-
PSoC-Free.
K. Caballero, L. M. Duque, S. Ceballos, J. C. Ramírez y A. Peláez. "Conceptos básicos para el análisis electromiográfico". Revista CES Odontología, vol. 15, nº 1, 2002.
W. Infante, R. Piraján y F. Martínez. Prototipo para la adquisición y visualización del espectro eléctrico del corazón. Universidad de los Andes, Bogotá, 2009.
N . Godoy y M. Montoya Mesa, “Paper EMG - anteproyecto-prótesis-manorobótica”, 2012. Available in: http://goo.gl/YqJTl.
R ochester Electro-Medical Inc, “Electrodos
cardiacos desechables MEDITRACE®”, 2010. Available in: http://www.rochestermed. com/CardiacFrame30Sp.htm.
J. Drake, “Instrumentación electrónica de
comunicaciones. Dpto. de Electrónica y Computadores, Santander”, 2005. Available
in: http://www.ctr.unican.es/asignaturas/instrumentacion_
_IT/IEC_3.pdf.
Care First, 2012. Available in: http://goo.gl/VPr7P.
M. P. Márquez, Electrocardiografía: técnica de interpretación básica, Mérida, Venezuela.
F. B. Lagoa Caridad, P. Montero Manso, C. Pena Lourés, J. Padrón González y I. Teijeiro Flórez, “Interfaces gráficas de usuario”, 2012. Available in: http://sabia.tic.udc.es/gc/Contenidos%20adicionales/ t r abaj o s/Inter faces/enlightment/index.html.
How to Cite
APA
ACM
ACS
ABNT
Chicago
Harvard
IEEE
MLA
Turabian
Vancouver
Download Citation
BIOMEDICAL INSTRUMENTATION APPLICATIONS USING PSOC MICROCONTROLLERS
submitted date: November 2013
received date: February 2014
accepted date: March 2014
Wilson Fabián Urbina Rojas
B.Sc.In Electronic Control, Universidad Distrital Francisco José de Caldas, Bogotá (Colombia). INTEGRA research group, Universidad Distrital Francisco José de Caldas, Bogotá (Colombia). E-mail: wfabian88@hotmail.com
Fernando Martínez Santa
B.Sc. In Electronic Control and Instrumentation, Universidad Distrital Francisco José de Caldas, Bogotá (Colombia). MSc. Electrical and Computer Engineering: Universidad de Los Andes, Bogotá (Colombia). Current position: professor Universidad Distrital Francisco José de Caldas, Technology Faculty, Bogotá (Colombia). E-mail: fmartinezs@udistrital.edu.co
Jorge Eduardo Porras
B.Sc. In Electronic Engineering. Current position: Professor Universidad Distrital Francisco José de Caldas, Bogotá (Colombia), Technologycal Faculty, Bogotá (Colombia). E-mail: jeporras@hotmail.com
Abstract
This article illustrates the benefits of using PSoC microcontrollers for biomedical applications such as: electromyography (EMG), electroencephalography (EEG) and electrocardiography (ECG). The article also describes the steps to be followed for the implementation of biomedical equipment capable of capturing the different types of bio-potentials generated from the human body. These steps include: signal conditioning, filter design, signal digitalization, data communication and visualization. Finally, a low-cost electromyography device design is shown. The design easily serves as a device for either electroencephalography or electrocardiography, always using a lower amount of electronic components than regular equipment.
Key words
Biomedical Instrumentation, Microcontroller, PSoC, Analog Filter, Digital Filter
1. Introduction
Most of the time it is necessary to measure the bioelectric potentials that are generated as a result of electrochemical activity of certain cells; for instance, the cells of nervous, muscular and glandular tissues. The measure of this kind of bioelectric phenomena is used to observe the electrochemical activity of those tissues. There are different common medical tests to analyze these kinds of bioelectric signals, such as: electromyography, electroencephalography and electrocardiography. All these tests involve low voltage signals and high impedance source circuits as their main features [1].
When complex projects are developed, it is often necessary to use additional peripherals such as: instrumentation amplifiers, filters, timers, analog to digital converters, etc. The implementation of such peripherals carries additional difficulties like: the use of new components that require extra room, a more complex board design, an increase in energy consumption, etc. All of these problems can directly affect the final development price of the Project [2].
The PSoC microcontrollers release has been a dream come true for electrical engineers since all the requirements of projects can be covered with only one chip. Thus, these devices combine analog and digital blocks, integrating amplifiers, timers, ADC and DAC converters and communication modules such as RS232, USB, I2C and SPI. Finally PSoC microcontrollers also have a useful resource named re-configurability; this feature is equivalent to having different electronic devices in a single device.
2. Methodology
2.1 PSoC: Programmable System on Chip
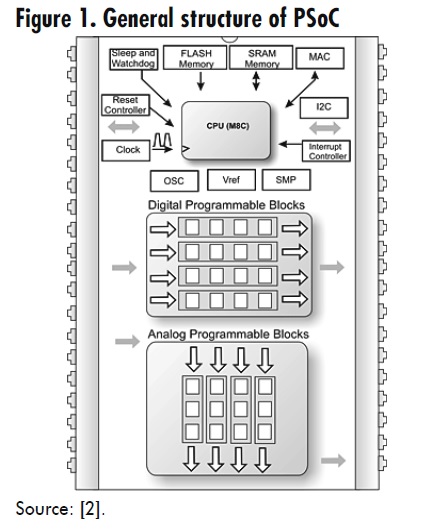
The PSoC represents a new concept in the microcontroller development, besides all elements commonly found in 8-bit microcontrollers; the main feature of PSoC is the programmable analog and digital blocks, which allow the implementation of a lot of different peripherals using the same hardware.
Digital blocks are composed by smaller programmable blocks that can be configured to allow different development options. Analog blocks are used for the analog elements development such as: analog filters, comparators, amplifiers (inverted, non-inverted, instrumentation, etc.), analog to digital and digital to analog converters. There is a large number of PSoC families on which is possible to develop different projects, depending on the requirements of each project. The difference between those families is the amount of programmable blocks and input/output pins [2]. PSoC microcontrollers are based on 8-bit CISC architecture. The general structure with the basic blocks is described in Figure 1. The main characteristics are of these microcontrollers are as follows:
The differential equation known as Euler- Cauchy, in its homogeneous form, is an equation of the form:
- MAC unit, 8x8 hardware multiplication with 32 bit accumulator, adjustable voltage from 3.3 to 5 volts, selectable processor frequency.
The main characteristics of the programmable blocks are:
- 16 K Bytes programmable memory, 256 bytes of RAM memory.
- AD converter with 14 bit of maximum resolution and DA converter with 9 bit of maximum resolution.
- Programmable voltage amplifiers, programmable filters and comparators, counters and timers of 8, 16, 24 and 32 bit, accurate voltage reference, combining blocks option.
- 2 UART’s (Universal Asynchronous Receiver- Transmitter) full duplex, multiple SPI devices. I²C master-slave and multimaster with 400 kHz speed.
- For each pin there are: Pull up, Pull down, High Z, Strong and Open pin states.
- Interruption generation possibility during the state change of any input- output pin [2].
- Frequency generator for the CPU and programmable blocks. With inner or external reference oscillator.
- Reset controller module.
- Watch Dog Timer module to detect software dead loops.
- Sleep timer module to wake up the microcontroller from save energy modes. It can be used as regular time counter.
- Programmable digital and analog blocks.
- Voltage reference module to work along with the programmable analog blocks.
- SMP system. This one works as a part of a voltage regulator. For example, it is possible bring energy to the PSoC just with a 1.5-volt battery.
2.1.1 Programmable Gain Amplifier (PGA)
The PGA module (Figure 2) implements a non-inverted amplifier with configurable gain by the user. This one has high input impedance, large bandwidth and selectable reference.
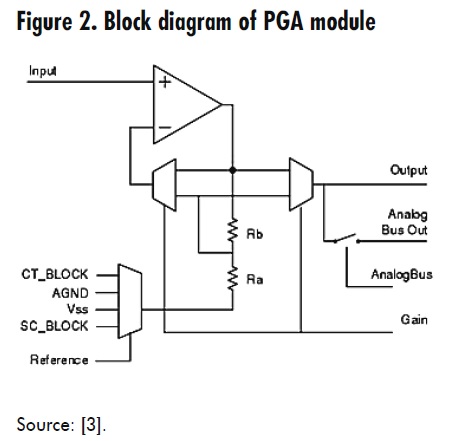
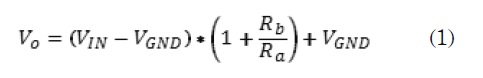
The PGA amplifies either an internal or external signal. This module can be referenced to as analog ground (VSS). For gains higher to one the following holds (1).
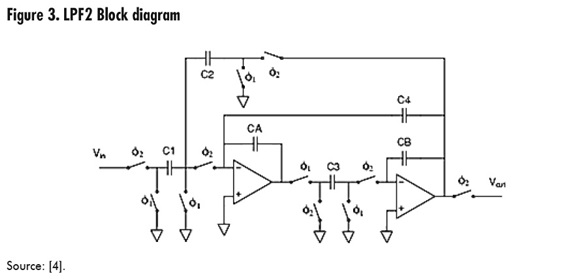
2.1.2 Two-pole low pass filter (LPF2)
This module implements a 2nd order low pass filter also named biquadratic. The cutoff frequency and damping factor are functions of clock frequency and values of the selected capacitors. Any classical configurations such as Butterworth, Bessel or Chebishev can be implemented, all of them with a cutoff frequency that is easily adjustable with accuracy. It is possible to implement 4th order functions or higher (Figure 3), using various LPF2, cascade connected [4].
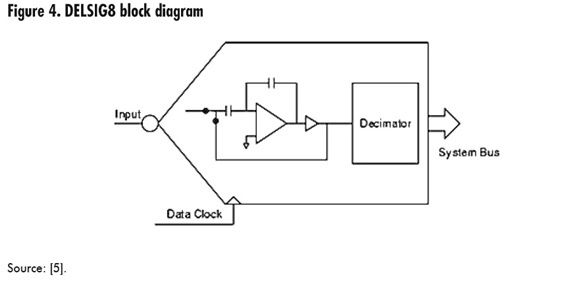
2.1.3 Eight-bit Delta Sigma analog to digital converter (DELSIG8)
This module brings an 8-bit conversion with 2 complements and a 2.6 volts full scale. The signal is referenced to analog ground AGND (Figure 4). Its simple frequencies range from 1.8 Ksps (kilo-samples per second) to 31 Ksps. The sample rate is determined by the sample frequency of the data input. This sort of segmented integration converter needs 127 cycles to generate one output sample [5].
2.1.4 USBUART
A lot of embedded applications use RS-232 interfaces to communicate with external systems such as computers, especially to debug programs. But in the computing world, the RS-232 interface is about to be totally replaced by USB interfaces. The simplest way to migrate a particular device to USB is to emulate an RS-232 communication over a USB port. The main advantage of this method is that the computer uses the USB connection as a RS-232 COM, which makes program development very easy [6].
The USB-CDC (communication device class) is a sort of communication in which the whole protocol is implemented to emulate a serial port over a USB port.
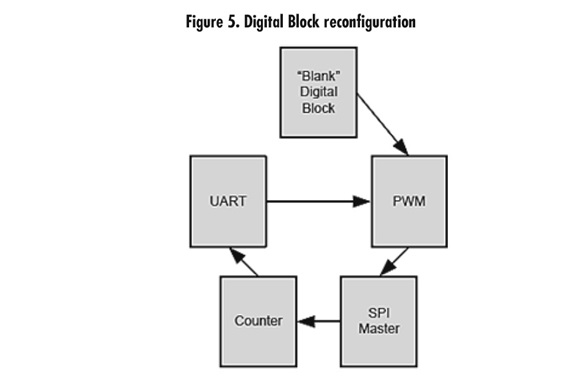
2.1.5 Re-configurability
Dynamic re-configurability is a powerful and exclusive feature of PSoC. This feature allows PSoC modules to reuse the analog and digital resources to reach a higher level of functionality. An example is shown as an electric shave machine, which needs control motors and battery charge functionalities; it is possible to use a cheap PSoC with limited resources to reduce the application cost. Using the dynamic reconfiguration, the analog and digital blocks can be reconfigured to execute a lot of different functions; however, just one function can be activated at the same time. Figure 5 shows how a digital module is reconfigured to execute various digital functions [7].
2.2 Biomedical instrumentation
Various clinical exams require an analysis of the different signals generated by the body. Here, three different types of body signals are shown, all of them require basically the same treatment and instrumentation.
2.2.1 Electromyography (EMG)
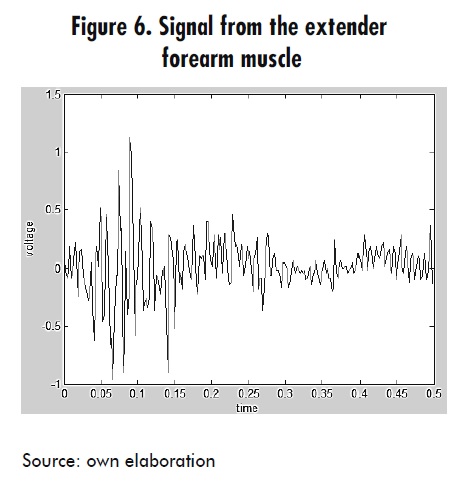
Electromyography (EMG) is the electrophysiological study of the neuromuscular system. This is the logging of electro-potential signals produced in skeletal muscles and captured through electrodes. It serves to evaluate the state of the nerves that control muscles and allows an accurate detection of the compression level of muscles. It also helps to measure the displacement speed of the electric stimulus, voltage variations and the electric noise of muscles or nerves to make a medical diagnostics [8].
EMG signals have amplitudes from 0.1 to 5 mV and important frequency components ranging from 15 Hz to 500 Hz [9]. The characteristic shape of these signal is shown in Figure 6.
EMG can be classified according to the test protocol applied to patients, namely: resting EMG for the base electric activity of muscles, voluntary EMG (that is, the electric activity of the muscle during an activity, e.g. muscular retraction) and EMG of evoked potentials, which occurs by applying electric pulses that stimulate muscle contraction [10].
2.2.2 Electroencephalography (EEG)
It is used to analyze the brain electric waves though electrodes placed on the scalp. Other related procedures measure the evoked potential signals. These procedures are used to analyze the brain electric activity generated by visual, sound and tactile stimulus [11].
The EEG logs the brain activity patterns. The basic types of brain waves are: alpha, beta, theta and delta.
- The alpha waves have frequencies from 8 to 12 hertz with a regular rate. These waves are present only when the patient is awake but with closed eyes. As a rule, the alpha waves disappear when the eyes are opened or the patient starts to focus on something.
- Beta waves have frequencies from 13 to 30 hertz. In general these waves are associated to anxiety, depression and the use of sedatives
- The theta waves have frequencies from 4 to 7 hertz. These are common on children and young adults.
- Delta waves have frequencies from 0.5 to 3.5 hertz. Normally these ones are only present on children during sleep [11].
2.2.3 Electrocardiography (ECG)
Electrocardiography consists in the graphical logging of the heart electric activity. This analysis gives data from cardiac function, heart rate changes, cavity hypertrophy and helps the diagnostic of congenital, infectious, inflammatory, metabolic and ischemic heart diseases [12].
Its most important frequency range occurs from 10 Hz to 100 Hz and waves may reach up to 250 Hz in pediatric patients.
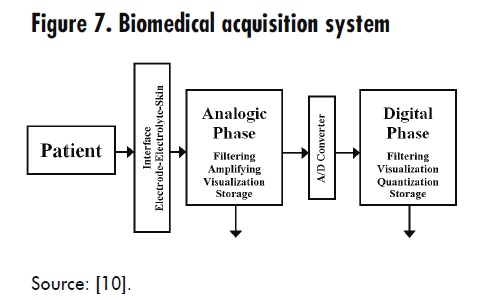
2.2.4 Biomedical signals conditioning
The procedure described here can be applied to EMG, EEG and ECG; it is just necessary to do small modifications (filter frequencies) to adapt the hardware to each exam. Figure 7 shows the block diagram to follow in order to implement a biomedical acquisition system.
2.2.4.1 Electrodes
There are two ways to get bioelectric signals, namely intracellular and extra-cellular. Also, there are two sensor types available, namely the invasive ones (which have a metal plate that is in touch with the skin) and the implantable ones (which are made with biocompatible materials and are long-term unalterable when in touch with organic fluids).
For ECG and EMG signals, non-invasive surface electrodes are used with hydrogel and Ag/AgCl (Silver / Silver chloride). These electrodes are easily stuck to the skin [13].
2.2.4.2 Instrumentation amplifier
An instrumentation amplifier is a voltageto- voltage differential amplifier with a highly accurate voltage gain. This is an essential component of a measurement system, which is assembled as an independent functional block. This is possible due to its accurate functional features that do not suffer modifications when the instrumentation amplifier is assembled along with other components [14].
On the other hand, instrumentation amplifiers have these characteristics:
- They are differential amplifiers with accurate, stable gain, generally in the range from 1 to 1000.
- Their differential gain is controlled through a unique analog element (resistive potentiometer) or digital element (switch), which allows easy adjustments.
- Their common gain mode is lower than the differential one, since the amplifier’s CMRR is extremely high in all the operative frequency range.
- Their impedance is high in order to prevent gain from being affected by the source input impedance. Additionally, the output impedance is low in order to prevent gain from being affected by the load connected to the output.
- Their low voltage offset level allows working with very small voltage level signals
- The rejection rate to curly signals in the power source is significantly high [14]
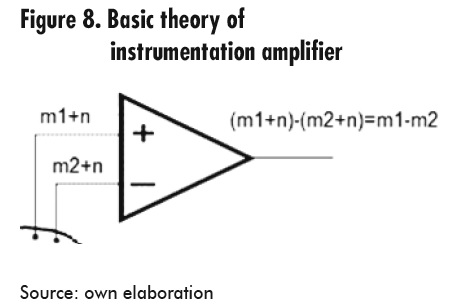
The reference electrode has been located in a totally electric neutral place or with a minimal bioelectric muscle activity; the other two are located on the muscle to be assessed. Both active electrodes are connected to the differential amplifier, for amplifying the difference between two signals and eliminating any environment noise signal.
The basic theory of instrumentation amplifiers, Figure 8, is defined through a simple equation that determines the difference between the signals and eliminates the common signals.
2.2.4.3 Signal filtering
One of the most important phases of signal conditioning is the filtering stage, which determines the circuit bandwidth. If the rejected signals were closed to the target signals it is possible that a second order filter is not enough, and then it is necessary to implement a higher-order filter. Real filters just can approximate real responses. In general, to get a closer approximation it is necessary to increase the order of the filter [15].
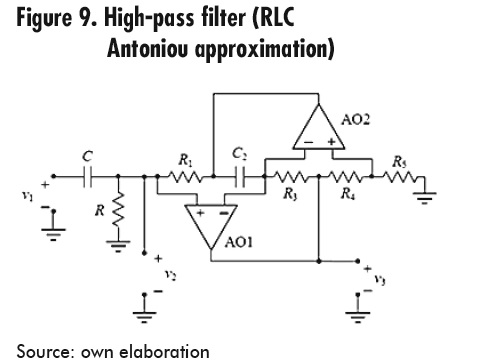
The characteristics of the biomedical signals to be acquired are special. For this reason it is necessary to implement the Antoniou approximation for the high-pass filter and the Butterworth principles for the Notch filter (band-stop) [9].
The high-pass filter is mainly used to eliminate the DC level of electrode signals; it also eliminates movements on the visualization base line.
To design the high-pass filter with a 10 Hz cutoff frequency, an RLC circuit using the Antoniou approximation was chosen (Figure 9) since this circuit presents a fast response, compared to the Butterworth approximation [9].
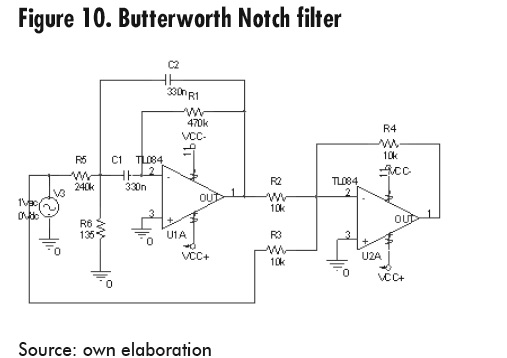
Notch filter design is necessary to eliminate the 60Hz interference produced by the electric source power (Figure 10). A band-stop filter is referred to as Notch when its bandwidth is very small. In this case the bandwidth ranges from 59 to 61 Hz [9].
2.2.4.4 Voltage level shifter
Since the signal from filters is in the range from -5V to 5V, it is necessary to shift the signal until reaching only positive values (i.e. from 0 to 5 volts) for the PSoC to recognize it. The simplest and most effective way to do this is to use two resistances as a voltage divider. For instance: when the input voltage is between -5V to 0V and VCC is 5V, the output voltage will lie between 0V to 2.5V [9].
2.2.4.5 Signal digitalization
To make an original signal digital, a PSoC microcontroller is used. This microcontroller manages the previously explained blocks, in the following order: PGA to get stability of input signal, low-pass filter to limit the higher work frequency; then, an 8-bit ADC conversion takes place, and finally, the signal is sent to a computer using the USBUART module, which emulates an RS232 port through a USB connection.
2.3. Case Study
A 4-channel electromyography device allows visualizing signals generated by the muscles on a computer, using an USB communication port. There were 6 phases to the study [16]. Signal conditioning was conducted using an instrumentation amplifier, two analog filters (high-pass and band-stop previously explained) and the signal processing in the PSoC.
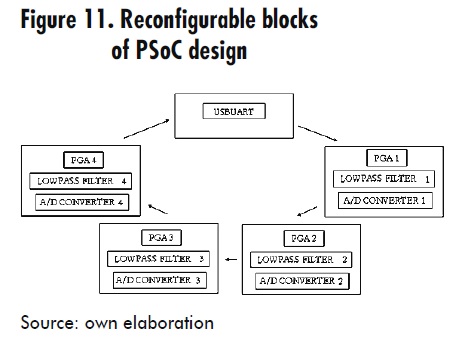
The PSoC program is twofold, namely hardware design and software design. Hardware design uses the most important features of PSoC microcontrollers: i) re-configurability, which allows multiple configurations in the design, and dynamic changes of these configurations at any time while the device is working. This means that it is possible to implement new designs in the same configurable blocks. In this case the hardware design has a main configuration (always available) and other four loadable configurations, since the amount of programmable blocks in the used PSoC might not be enough. The main configuration contains the USBUART communication module to send digitalized data to a computer. The four loadable configurations serve as sample channels. These channels have the same modules and characteristics, although the only difference is the analog input pin. Each configuration has a programmable gain amplifier (PGA) with a gain of 1 to stabilize the input signal, also a low pass filter with 500Hz cutoff frequency and a high speed Delta-Sigma ADC of 8 bits (Figure 11).
3. Results
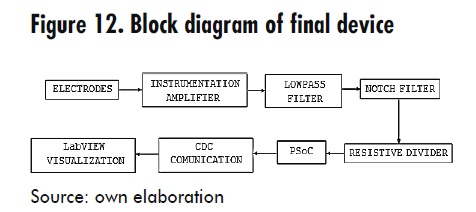
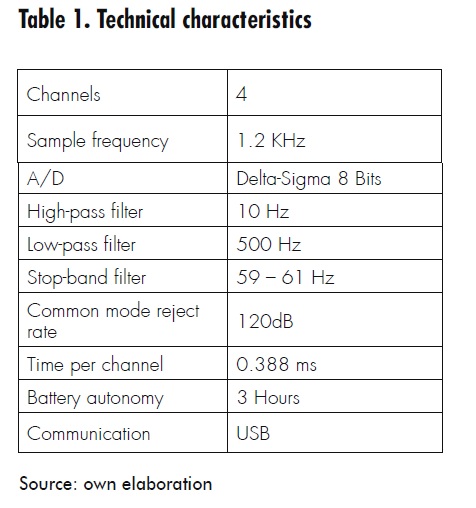
The final prototype is the assembly of all blocks already explained. Figure 12 and Table 1 illustrate the constituent parts together.
One of the main targets of this investigation is to achieve an electromyography competitive device in terms of functionality and price, since there is already a lot of similar equipment (Cadwell Sierra Console, Bitmed EMG Micro, and others). The price of this device is just over forty percent of other devices.
- To obtain the different states of muscles, 50 tests were conducted on biceps. These tests yielded an error of 5% compared with regular electromyography equipment at the Roosevelt Institute (in Bogotá).
- The hardware designed is able to acquire and process EMG surface signals. It is composed basically of instrumentation amplifiers (INA128), analog filters, a PSoC CY8C24894-24LFXI microcontroller and a USB interface, [17]. This assembly also works as a development and testing board because it has multiple inputs and outputs available, namely LEDs, switches, LCD screen, two power sources, etc.
4. Result Analysis
- Biomedical equipment is highly sensitive to any noise source; therefore the quality of internal and external connections is very important to reach a good performance of the device.
- It is advisable to use batteries instead of the electric grid as a power source to avoid any type of noise; however it is possible to use a switched power source for continuous use.
- For instrumentation amplifiers it is better to have a variable Rg (Gain resistance), to allow fine adjustments to take place depending on the needs or on the obtained signal characteristics.
- To obtain a clear and noiseless signal (electromyography case), it is necessary to use three filters: a high-pass filter at 10 Hz to eliminate DC voltage from electrodes and visualization base line movements, a stopband filter at 60 Hz (or 50 Hz) to avoid electric network noise, and a low-pass filter at 500 Hz.
- The use of surface mount PSoC (CY8C24 894-24PXI) allows us to significantly reduce the cost and size of the circuit.
- The implemented software, using Lab- VIEW for electromyography visualization, is designed under a simple graphic environment and is also user-friendly; additionally this software can be modified depending on the particular needs.
- For ECG and EEG it is mandatory to implement a special circuit to electrically isolate patients from the electronic device and reach the lowest electric discharge risk level during measurements.
- It is possible to use new families of PSoC (i.e. PSoC 3 and PSoC 5) with a higher number of programmable blocks so as to implement new electro-potential measurement systems and reduce the amount of external devices needed, e.g. an implementation with all filters inside the PSoC.
- Designers can implement the required filters (either digital or analog) depending on the specific dependences or available resources of the PSoC used.
- By using the re-configurability feature of PSoC microcontrollers, it is easy to obtain a generic bio-potential measurement system in a single device (electromyography, electroencephalography and electrocardiography) using different configurations, with different cutoff frequencies for filters.
6. Conclusions
- Performance and quality of biomedical equipment depends directly on the precision of interpretation of the necessary signals for diagnosis. From this point of view PSoC microcontrollers allow improving the biomedical equipment performance, reducing their sensitivity to harmonic sources and noise; also increasing flexibility through scalable options as well as requiring smaller space and less money.
- The filtering stages are very important to obtain a clear and reliable input signal. This research shows the necessity of implementing these stages through three filters: (1) a high-pass filter at 10 Hz, which eliminates DC signal levels, (2) a Notch stop-band filter of 60 Hz and (3) a low-pass filter of 500 Hz. For electroencephalography and electrocardiography it is necessary to change cutoff frequencies to their own needs.
References
[1] De Lorenzo Group, “DL 3155BIO5 Electrocardiograma, Electroencefalograma, Electromiograma”, 2012. Available in: http://goo.gl/5FFdZ
[2] B.Kropf, Application Note 2104 PSoC Dynamic Reconfiguration.
[3] Cypress Semiconductor, PGA User Module Datasheet PSoC Designer V. 4.4.
[4] Cypress Semiconductor, USB UAR T User Module Datasheet PSoC Designer V. 4.4.
[5] Cypress Semiconductor, 8-Bit Delta Sigma ADC User Module Datasheet PSoC Designer V. 4.4.
[6] Cypress Semiconductor, Two Pole Low Pass Filter User Module Datasheet PSoC Designer V. 4.4.
[7] W. Urbina y F. Martínez, “Implementación de un electromiógrafo con interfaz USB". Revista Tecnura, vol. 16, nº 33, pp. 117-130, 2012.
[8] C. T. E., Et. al, “EMG Electromiografo”, 2012. Available in: http://proton.ucting. udg.mx/expodec/abr99/e53/e_53.html
[9] M ikroElektronika, “Easy PSoC”, Julio de 2006. Available in: http://es.scribd.com/ doc/75347899/Chapter-1-Introductionto- PSoC-Architectureand-Programmingof- PSoC-Free.
[10] K. Caballero, L. M. Duque, S. Ceballos, J. C. Ramírez y A. Peláez. "Conceptos básicos para el análisis electromiográfico". Revista CES Odontología, vol. 15, nº 1, 2002.
[11] W. Infante, R. Piraján y F. Martínez. Prototipo para la adquisición y visualización del espectro eléctrico del corazón. Universidad de los Andes, Bogotá, 2009.
[12] N . Godoy y M. Montoya Mesa, “Paper EMG - anteproyecto-prótesis-manorobótica”, 2012. Available in: http://goo. gl/YqJTl.
[13] R ochester Electro-Medical Inc, “Electrodos cardiacos desechables MEDITRACE®”, 2010. Available in: http://www.rochestermed. com/CardiacFrame30Sp.htm.
[14] J. Drake, “Instrumentación electrónica de comunicaciones. Dpto. de Electrónica y Computadores, Santander”, 2005. Available in: http://www.ctr.unican.es/asignaturas/instrumentacion_ 5_IT/IEC_3.pdf.
[15] Care First, 2012. Available in: http://goo. gl/VPr7P.
[16] M. P. Márquez, Electrocardiografía: técnica de interpretación básica, Mérida, Venezuela.
[17] F. B. Lagoa Caridad, P. Montero Manso, C. Pena Lourés, J. Padrón González y I. Teijeiro Flórez, “Interfaces gráficas de usuario”, 2012. Available in: http:// sabia.tic.udc.es/gc/Contenidos%20 adicionales/ t r abaj o s/Inter faces/ enlightment/index.html.
1.png)


.jpg)