DOI:
https://doi.org/10.14483/23448407.3646Publicado:
2011-12-31Número:
Núm. 5 (2011)Sección:
Artículo de investigación científica y tecnológicaFLEXURAL RIGIDITY OF THE COLOMBIAN ANDES
Rigidez de flexión de los andes colombianos
Palabras clave:
elastic thickness, satellite, flexure, Bouguer anomaly, topography. (en).Palabras clave:
espesor elástico, satélite, anomalía de Bouguer, topografía. (es).Descargas
Referencias
Forsyth, D. (1985). Subsurface loading and estimates of the flexural rigidities of continental lithosphere. Journal of Geophysical Research, 90 (B14), 12.623-12.632.
García, D., Fernández, M. and Torné, M. (1997). Numerical modeling of foreland basin formation: a program relating thrusting, flexure, sediment geometry and lithosphere rheology. Computers & Geosciences, 23 (9), 993-1003.
Karner, G. D., Watts, A. B. (1983). Gravity Anomalies and Flexure of the Lithosphere at Mountain Ranges. Journal of Geophysical Research, 88 (B12), 10.449-10.477.
Kellogg, J., Salvador, M. and Ojeda, G. Y. (1995). Lithospheric structure of the Colombian Andes: Flexure and Crustal Shortening. EOS Transactions, 76, 374.
Ojeda, G. Y. (2000). Analysis of flexural isostasy of the Northern Andes (Ph.D. thesis). Florida International University, Miami, U.S.A.
Turcotte, D. and Schubert, G. Geodynamics: Application of Continuum Physics to Geological Problems. New York: John Wiley & Sons.
Cómo citar
APA
ACM
ACS
ABNT
Chicago
Harvard
IEEE
MLA
Turabian
Vancouver
Descargar cita
FLEXURAL RIGIDITY OF THE COLOMBIAN ANDES
RIGIDEZ DE FLEXIÓN DE LOS ANDES COLOMBIANOS
Ivan F. Casallas1, Remy A. Galan León2
1Universidad Distrital “Francisco José de Caldas” geophysicalthings@gmail.com
2 Universidad Distrital “Francisco José de Caldas” remyalexander@gmail.com
Recibido: 27/04/2011 - Aceptado: 22/06/2011
ABSTRACT
This work mades computes of Flexural Rigidity values, through using Moho deflection models with Bouguer gravity anomaly data and topographical heights over three profiles that pass across and covers the three Andean mountain belts of Colombia. Finally a discussion is made between the obtained results and previous works in the same study area.
Key words:Elastic thickness, satellite, flexure, Bouguer anomaly, topography.
RESUMEN
En este trabajo se realiza el cálculo de valores de rigidez flexural mediante el empleo de modelos de deflexión del moho con datos de anomalía de gravedad de Bouguer y alturas topográficas, en perfiles que cubren las tres cordilleras. Finalmente, se realiza una discusión entre los resultados obtenidos y estudios previos para la misma área de estudio.
Palabras clave: espesor elástico, satélite, anomalía de Bouguer, topografía.
INTRODUCTION
Several Geological phenomena allow that in long term Earth’s lithosphere has an elastic behavior; in fact, Effective Elastic Thickness is a proof of that. The study of the elastic behavior of lithosphere is relevant to determine its stress condition and the analysis of distribution of these in the lithosphere helps in the research of natural phenomena and hazards as earthquakes, because occurrence of these reveals the force loads on which the lithosphere has subjected. Flexural rigidity is the resistance measure that the lithosphere has to the strain, in the same way, the value of Te that best fits at rigidity will be compute, as well as the deflection that lithosphere experiments due to the load that support.
FLEXURAL ANALYSIS
The case of a continental lithosphere which does not support any kind of load over its surface is illustrated in Figure 1a. The crust with density separate of the mantle with density by Mohorivicic layer, commonly known as Moho; now, when the same continental lithosphere is loaded with a mass as the topography, it shows that Moho suffers a downward deflection (figure 1b), the latest is associated with a value of flexural rigidity and a value of elastic thickness.
In flexural analysis must be assumed that continental lithosphere seems to a two-dimensional thin plate with an elastic behavior that rests over a viscous fluid as the mantle. Deflection that the plate holds up because topographic load differs in accordance with the variation of this over the surface. Flexure of an infinite elastic plate loaded with topography is described by the next expression.
In equation (1), expression is the topographical load which is supported by an astenospherical restitution force and the flexural rigidity. Where moreover:
ρm = 3,3= Mantle average density
ρc = 2,8= Crust average density
g = 9,8 = Gravity acceleration
h(x) = Topographical Height
x = Distance along Profile
In this way the flexural rigidity is given by equation (2), where elastic thickness Te controls the flexural rigidity of all system. A numerical solution that employs finite difference technique, which approaches the derivates that integrates the problem of ordinary differential equations where the solution is reduced until a lineal system, this allow computing a deflection profile which is the result of locate values of Te across it.
Where:
E = 10Pa= Young Modulus
Te= Effective Elastic Thickness
ρ= P0.25 = oisson Rate
Bouguer anomaly that commonly has been associated with Moho geometry, it is the fundamental term to get the final values of elastic thickness, is obtained through a comparison between observed Bouguer anomaly in profile and Bouguer anomaly given by the model. So then, several values of are introduced until obtaining the best fit between two quantities. When the final value of effective elastic thickness has been obtained, it is possible to find the value of flexural rigidity as well as a Moho deflection profile. Two kinds of models can be used to quantify the flexure of a plate subjected to a vertical load: Continous plate model which describes a flexure of an infinite elastic plate due to a vertical load, and a broken plate model in which the load makes weight over a bound of the semi-infinite plate (Turcotte, 1982).
METHODOLOGICAL APPLICATION
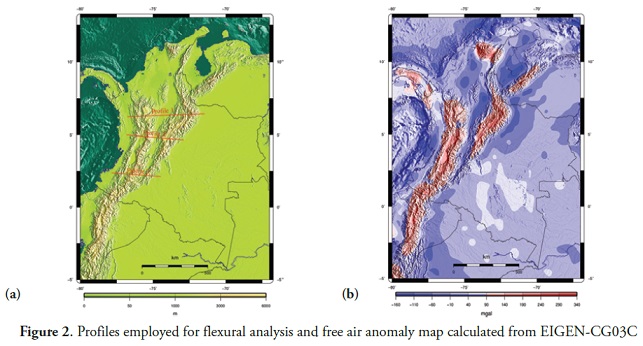
Flexural Analysis was executed over three (3) profiles, these profiles are showed in figure 2a, each one was computed to obtain simple Bouguer anomaly model from Free Air Anomaly map ( figure 2b)calculated from Global Geopotential Models (for this study EIGEN-CG03C) and topographical heights. In this work, the continuous plate model was employed, and all computes of flexural analysis were made with open source software tAo (García, Fernández y Torné, 1997).
Profile 1 flexural analysis
This profile was drawn from coordinates, to ,; over a geographical area that covers mountain regions in Chocó, Antioquia, Boyacá and Santander. In whose geological formations the most important is Sierra Nevada del Cocuy with a height about at 5000 m.
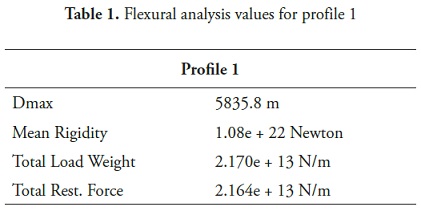
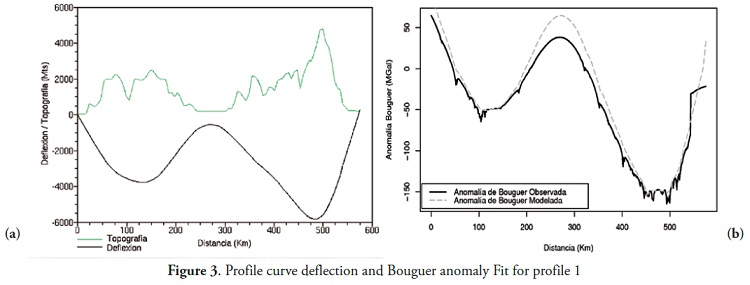
In table 1 are showed the values associated to the deflection determined by the model, figura 3a shows the curve of flexure caused by the topographical load in this profile and the figure 3b shows the fit established with the Bouguer anomaly curves that represents an elastic thickness of 12 km.
Profile 2 flexural analysis
This section was drawn from coordinates , to , ; including a geographical area of mountain regions in Chocó, Huila, Tolima, Cundinamarca, among other Departments (States jurisdictions). In this profile, can be identified the area of the most important geological formations in Colombian Andes, the Nevados region.
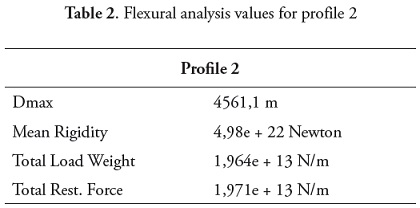
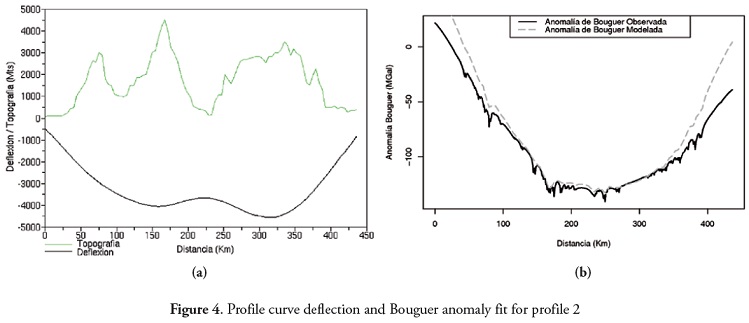
In table 2 were entered the deflection associated values, the figure 4a shows the flexure curve drawn by the load, and figure 4b represents the fixed values of the Bouguer anomaly of the flexure model as well as the observed in the gravity satellital model, that means an effective elastic thickness about 20 km.
Profile 3 flexural analysis
The last profile used in this analysis crosses a geographical area from coordinates, to, he area includes mountain regions in Nariño, Huila and Caquetá. This profile contains the lowest heights of the study, due to that the area covers the origins of the Cauca and Magdalena valleys.
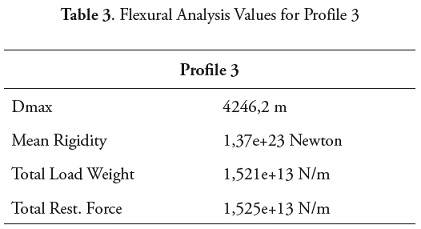
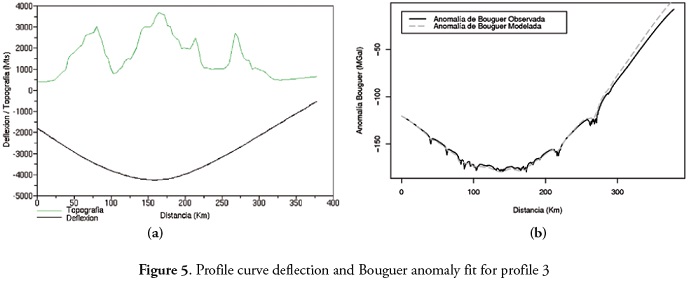
In table 3 are showed the parameters associated with deflection determined by the model, figure 5a shows the curve of flexure caused by the topographical load in this profile and the figure 5b shows the fit established with the Bouguer anomaly curves that represents an elastic thickness of 28 km.
DISCUSSION
The obtained results in this study can be analyzed from three parameters: flexural rigidity, Moho deflection and effective elastic thickness values. For the colombian Andes (Kellogg, Salvador and Ojeda, 1995) shows an estimated mean value for flexural rigidity which is 1E+30 Dina (approximately 1E+25 Newton), but (Karner and Watts, 1983) whose research was developed over Mountain belts as Himalaya, Alpes and Apalachians obtaining values between 1E+25 to 5E+25 Newton; also is important knowing (Forsyth, 1985) got mean values between 1E+22 to 5E+22 Newton. These values compared with the obtained value in this work allow concluding that with the procedures here employed were obtained values that are in the expected limits. In concern with the Moho deflection (Ojeda, 2000) reports a maximum deflection value about 10 km for the eastern mountain belt, while in this work have been obtained maximum values of deflection in the order of 4 km to 6 km, which are directly related with effective elastic thickness values that presents a growing trend from north to south of the Country, but in this topic there are not studies that allow making a direct comparison, hence is difficult to conclude if obtained deflections are higher or are into the normal limits.
CONCLUSIONS
In this work was found a relation among growing trend of effective elastic thickness, flexural rigidity and mean rigidity from north to south of the Colombian Andes. Although this relation and the obtained values are not enough to determine what model represents distribution of strength of the continental lithosphere (Crème Brulle or Jelly Sandwich), the results are a light approximation to understand this phenomena.
ACKNOWLEDGMENTS
Maps were done by GMT Generic Mapping Tools. We thank to P. Wessel and W. H. F. Smith. We thanks specially to Daniel García Castellanos for his collaboration and suggestions about utilization of tAo software.
References
- Forsyth, D. (1985). Subsurface loading and estimates of the flexural rigidities of continental lithosphere. Journal of Geophysical Research, 90 (B14), 12.623-12.632.
- García, D., Fernández, M. and Torné, M. (1997). Numerical modeling of foreland basin formation: a program relating thrusting, flexure, sediment geometry and lithosphere rheology. Computers & Geosciences, 23 (9), 993-1003.
- Karner, G. D., Watts, A. B. (1983). Gravity Anomalies and Flexure of the Lithosphere at Mountain Ranges. Journal of Geophysical Research, 88 (B12), 10.449-10.477.
- Kellogg, J., Salvador, M. and Ojeda, G. Y. (1995). Lithospheric structure of the Colombian Andes: Flexure and Crustal Shortening. EOS Transactions, 76, 374.
- Ojeda, G. Y. (2000). Analysis of flexural isostasy of the Northern Andes (Ph.D. thesis). Florida International University, Miami, U.S.A.
- Turcotte, D. and Schubert, G. Geodynamics: Application of Continuum Physics to Geological Problems. New York: John Wiley & Sons.
Licencia
La revista UD y la Geomática se encuentra bajo una licencia Creative Commons - 2.5 Colombia License.
Atribución - No Comercial - Sin Derivadas

