DOI:
https://doi.org/10.14483/23448393.21003Publicado:
2024-01-17Número:
Vol. 29 Núm. 1 (2024): Enero-AbrilSección:
Ingeniería biomédicaStatistical Analysis by Linear Regression of the Prevalence of Flatfoot in Preschool Children of a Mexican Community
Análisis estadístico por regresión lineal de la prevalencia de pie plano en preescolar de una comunidad de México
Palabras clave:
statistical method, linear regression, flatfoot (en).Palabras clave:
pie plano, método estadístico, regresión lineal (es).Descargas
Referencias
M. Larrosa Pardo and S. Mas Moliné, "Alteraciones de la bóveda plantar," Rev. Esp. Reumatol., vol. 30, no. 9, pp. 489-498, Nov. 2003. https://www.elsevier.es/es-revista-revista-espanola-reumatologia-29-articulo-alteraciones-boveda-plantar-13055069
M. Riera Campillo, "El pie normal y su patología," Pediatría Integral, vol. 23, no. 4, pp. 203-211, 2019. https://www.pediatriaintegral.es/wp-content/uploads/2019/xxiii04/04/n4-203-211_ManoliRiera.pdf
C. González Martin et al., "Variability between Clarke's angle and Chippaux-Smirak index for the diagnosis of flat feet," Colombia Médica, vol. 48, no. 1, pp. 25-31, Jan. 2017. [https://doi.org/10.25100/cm.v48i1.1947 DOI: https://doi.org/10.25100/cm.v48i1.1947
M. R. Espichan, F. C. Gonzales, and E. C. Zavala, "Características epidemiológicas del pie plano y pie cavo en niños de 6 a 9 años de dos colegios nacionales de educación primaria," undergraduate thesis, Universidad Peruana Cayetano Heredia, Peru, 2015. https://hdl.handle.net/20.500.12866/446
J. A. Aco Luna et al., “ Frecuencia de alteraciones de la huella plantar en escolares de una comunidad mexicana," Acta Ortopédica Mexicana, vol. 33, no. 5, pp. 289-291, Sep. 2019. https://doi.org/10.35366/or195e DOI: https://doi.org/10.35366/OR195E
S. Lara Diéguez et al., "Análisis de los diferentes métodos de evaluación de la huella plantar," RETOS. Nuevas Tendencias en Educación Física, Deporte y Recreación, no. 19, pp. 49-53, Jan. 2011. https://doi.org/10.47197/retos.v0i19.34637 DOI: https://doi.org/10.47197/retos.v0i19.34637
J. J. Rodríguez Salvador, "Técnica del radiofotopodograma," Imagen Diagnóstica, vol. 2, no. 1, pp. 38-42, Mar. 2011. https://doi.org/10.1016/S2171-3669(11)70027-0 DOI: https://doi.org/10.1016/S2171-3669(11)70027-0
C. Murat Ӧzer and C. Barut, "Evaluation of the sole morphology of Professional football players," Int. SportMed J., vol. 13, no. 1, pp. 8-17, Mar. 2012.
R. M. Queen et al., "Describing the medical longitudinal arch using footprint indices and a clinical grading system," Foot & Ankle Int., vol. 28, no. 4, pp. 456-462, April 2007. https://doi.org/10.3113/fai.2007.0456 DOI: https://doi.org/10.3113/FAI.2007.0456
C. Ferrin et al., " Sistema de extracción automática de parámetros morfológicos de la huella plantar mediante técnicas de visión por computador en un sistema embebido," Revista Colombiana de Tecnologías Avanzadas, vol. 1, no. 23, pp. 80-86, 2014. https://doi.org/10.24054/rcta.v1i23.1893
A. Rosas Flores, "Diseño de una plantilla ergonómica que regule la presión plantar en jóvenes practicantes de baloncesto femenil: análisis biomecánico y de elemento finito," Master’s thesis, CIATEC, Mexico, 2021. http://ciatec.repositorioinstitucional.mx/jspui/handle/1019/167
S. Koirala et al., "Calculation of Staheli's plantar arch index, Chippaux-Smirak index, Clarke's angle prevalence and predictors of flat foot: A cross sectional study," Austin J. Anatomy, vol. 8, no. 1, pp. 1-6, Jan. 2021. https://doi.org/10.26420/austinjanat.2021.1095 DOI: https://doi.org/10.26420/austinjanat.2021.1095
J. C. Zuil Escobar et al., "Evaluating the medial longitudinal arch of the foot: Correlations, reliability, and accuracy in people with a low arch," Physical Therapy, vol. 99, no. 3, pp. 364-372, 2019. https://doi.org/10.1093/ptj/pzy149 DOI: https://doi.org/10.1093/ptj/pzy149
J. Marouvo et al., "Correlation between different methods to diagnose foot posture condition," Multidisciplinary Sci. J., no. 4, pp. 233-243, 2021. https://doi.org/10.3390/j4030019 DOI: https://doi.org/10.3390/j4030019
R. Mahaffey et al., "Age-related changes in three-dimensional foot motion during barefoot walking in children aged between 7 and 11 years old," Gait & Posture, no. 95, pp. 38-43, 2022. https://doi.org/10.1016/j.gaitpost.2022.04.001 DOI: https://doi.org/10.1016/j.gaitpost.2022.04.001
C. E. Fuentes Venado et al., "Evaluación comparativa de pie plano en preescolares," Med. B. Children's Hospital of Mexico, vol. 77, no. 6, pp. 312-319, 2020. https://doi.org/10.24875/bmhim.20000135 DOI: https://doi.org/10.24875/BMHIM.20000135
V. Bewick et al., “Statistics review 7:Correlation and regression,” Critical care, vol. 7, pp. 1-9. 2003. https://doi.org/10.1186/cc2401 DOI: https://doi.org/10.1186/cc2401
H. A. Miranda Camacho et al., “Interface for contour extraction and determination of morphologic parameters in digital images of footprints based on Hernandez-Corvo protocol,” CLAIB, México, 2019. https://dx.doi.org/10.1007/978-3-030-30648-9_48 DOI: https://doi.org/10.1007/978-3-030-30648-9_48
A. Flores Cu and H. A. Miranda Camacho, "Desarrollo de interfaz para estudio estático de huella plantar en infante utilizando procesamiento digital, con diseño y manufactura de plantilla correctora," undergraduate thesis, TecNM/Irapuato, México, 2020. http://dx.doi.org/10.13140/RG.2.2.32331.77604
M. Cano et al., "Foot computational diagnosis though Hernández Corvo, Clarke and Staheli Chippaux index", unpublished, Int. Conf. Mechat., Elec. Autom. Eng. (ICMEAE).
Cómo citar
APA
ACM
ACS
ABNT
Chicago
Harvard
IEEE
MLA
Turabian
Vancouver
Descargar cita
Recibido: 13 de julio de 2023; Aceptado: 5 de diciembre de 2023
Abstract
Context:
In Mexico’s rural towns, it is essential to generate a culture of studying the prevalence of flat feet in children aged 3 to 5, whose arch is still in development and can be corrected. By means of a computer application, statistical bar graph and correlation studies via linear regression can validate the results obtained regarding the categorization of infants’ footprint type, which are acquired through the Hernández Corvo index (HCI), Clarke’s angle protocol (CA), the Staheli index (SI), the Chippaux index (CI), and the body mass index (BMI).
Methods:
A statistical analysis of the plantar footprint of 95 infants in a rural region of Mexico was carried out, employing a computational technique together with a photo-podoscope. Footprint images were acquired, processed, and classified. The footprint type was categorized with respect to the HCI, CA, and the Staheli-Chippaux index (SCI). The footprint distribution was validated via the linear regression method.
Results:
We evidenced a prevalence of flat foot of 54,7 % in relation to HCI, 58,9 % in relation to CA, and 61,05 % in relation to SCI, where the male gender was shown to be more susceptible (up to 28, 32, and 33 cases, respectively). The best prediction was obtained using the SI and the CI: 90,7 and 87,0 % for the right and left feet, with a positive increase. No dependence on body composition was observed.
Conclusions:
The diagnosis of the type of footstep, in its normal, cavus, and flat categories, shows the prevalence of flat feet among infants aged 3 to 5, with at least 28 cases, mostly male and without dependence on weight. Although it is difficult to perform plantar footprint diagnoses in the rural communities of Mexico, this statistical study highlights the importance of monitoring foot development in preschool infants with the advantages and practicality of computational techniques.
Keywords:
flatfoot, statistical method, linear regression.Resumen
Contexto:
En las comunidades de México, es fundamental generar una cultura de estudiar la prevalencia del pie plano en niños de 3 a 5 años, cuyo arco aún está en desarrollo y se puede corregir. Mediante el uso de una aplicación computacional, los estudios estadísticos de gráficos de barras y correlación por medio de regresión lineal validan los resultados sobre la categorización del tipo de pisada del infante, los cuales se adquieren mediante el índice Hernández Corvo (HCI), el protocolo del ángulo de Clarke (CA), el índice Staheli (SI), el índice Chippaux (CI) y el índice de masa corporal (BMI).
Método:
Se realizó un análisis estadístico de la huella plantar de 95 infantes de una comunidad de México, empleando una técnica computacional junto con un fotopodoscopio. Se adquirió, procesó y clasificó la imagen de la pisada. Se categorizó el tipo de pisada con respecto al HCI, el CA y el índice Staheli-Chippaux (SCI). La distribución de las huellas se validó mediante el método de regresión lineal.
Resultados:
Se evidenció una prevalencia de pie plano de 54,7 % respecto al HCI, 58,9 % respecto al CA y 61,05 % respecto al SCI, donde el sexo masculino fue el más susceptible (hasta 28, 32 y 33 casos). La mejor predicción se obtuvo mediante el SI y el CI: 90,7 y 87,0 % para los pies derecho e izquierdo, con incremento positivo. No se observó dependencia con la composición corporal.
Conclusiones:
El diagnóstico del tipo de pisada, en sus categorías normal, cavo y plano, evidencia la prevalencia del pie plano entre los infantes de 3 a 5 años, con al menos 28 casos, en su mayoría masculinos y sin dependencia del peso. Si bien es difícil realizar diagnósticos de huella plantar en las comunidades rurales de México, este estudio estadístico muestra la importancia de monitorear el desarrollo del pie en infantes de preescolar, con las ventajas y la practicidad de las técnicas computacionales.
Palabras clave:
pie plano, método estadístico, regresión lineal.Introduction
In Mexico, it has become necessary to know the anthropometric characteristics of infants in preschool, especially in regions where it would be difficult to use computational techniques aimed at identifying footprint types. Determining the prevalence of flatfoot and its arch type is an intriguing issue, as this condition can affect children’s posture and walking over the years. To identify the percentage of infants with flatfoot in a Mexican community and to study their statistics, it is necessary to identify the different anthropometric aspects and nutritional information of said community’s infant population. Flat feet are considered to be normal during the first months of life. Starting at two years old, the structure of the foot is adjusted, causing the longitudinal arch to become more pronounced 1. However, most Mexicans do not know that, between four and six years old, it is important to diagnose the child’s footprint type, as any anomaly left untreated will persist, making it difficult to correct the morphology of the foot (1, 2).
The relationship between nutritional status, age, sex, and other aspects and the type of foot in infants has been studied over the years (3-5), obtaining different results depending on the conditions of the selected population, the method used for evaluating the plantar footprint, and the variables considered. It is therefore complicated to determine the conditions that favor the prevalence of flatfoot in a group of people. For example, 5 related the body mass index (BMI) to alterations in the plantar vault associated with flat and cavus feet in children aged 6 to 13. Cavus feet (11 %) were more frequent than flat ones (8 %), and statistical studies did not report a relationship between the nutritional status and the foot type.
There are a variety of anthropometric protocols for foot classification. Some of them are the Hernández Corvo Index (HCI), Clarke’s angle (CA), the Chippaux index (CI), and the Staheli Index (SI) (6-11). The Latin American HCI is regarded as the most widely used for the general study of the plantar footprint since it allows for a better observation of the variability in the longitudinal arch according to each zone of the foot, in addition to being precise. Moreover, CA is widely used to complete the classification of the foot with the assessment of the angle of the plantar arch (3, 6, 16).
Statistical methods involving bar graphs or linear regression are frequently employed to compare the prevalence of foot types against variables such as age, BMI, gender, posture, and load distribution, among others (11, 14), although scatter plots, multiple linear regression 15, maximum and minimum diagrams (16), and other methods have also been considered. Linear regression predicts the behavior of the variables by means of the coefficient of determination (R2). The confidence interval (CI) provides a range of probable values with respect to the mean, while the prediction interval (PI) provides a range of values for an individual response, with which, depending on the percentage, one can be certain that the trend described by the mean will be followed within a specific range 17.
12 studied the footprints of 300 20-year-olds with the CA, SI, and Chippaux-Smirak index (CSI). They established a correlation between BMI and the indices via linear regression, in addition to evaluating the frequency of flat, normal, and cavus feet with bar graphs and according to each protocol 12. On the other hand, 13 studied the longitudinal arch, establishing a correlation between overpronation, the arch angle, the SI, and the CSI by means of linear regression. The studied group included 71 people around 25 years of age. Using footprints, 14 studied the SI and CSI of 37 people aged 18 to 35, correlating the analysis of the calcaneal resting position, the navicular drop test, the arch angle, and the arch index through linear regression.
This work presents a plantar statistical study in a group of 95 infants from the community of Valtierrilla in Salamanca, Guanajuato, Mexico. Computational studies validate the baropodometric and statistical protocols for classifying the prevalence of flatfoot in infants 6. The baropodometric protocols used by the computational system are CA and the Staheli-Chippaux index (SCI), common methods that can be found in similar works (6, 12, 18). Similarly, the Hernández Corvo protocol was used, which is one of the most complete methods to examine the plantar arch and foot type with good accuracy 18,20. Finally, via linear regression, the indices were related to the body composition of each infant.
Methodology
A total of 95 infants (46 males and 49 females) aged 3-5 from the Jaime Torres Bodet preschool in the community of Valtierilla, Salamanca, Guanajuato, Mexico, were evaluated between September 2021 and May 2022. For this study, authorization was requested from the parents and the teaching staff of the institution, clearly explaining the objective and methodology of our work and according to the Helsinki declaration and the Internal Ethics Committee (CIEPCI) of TecNM/ITS Irapuato.
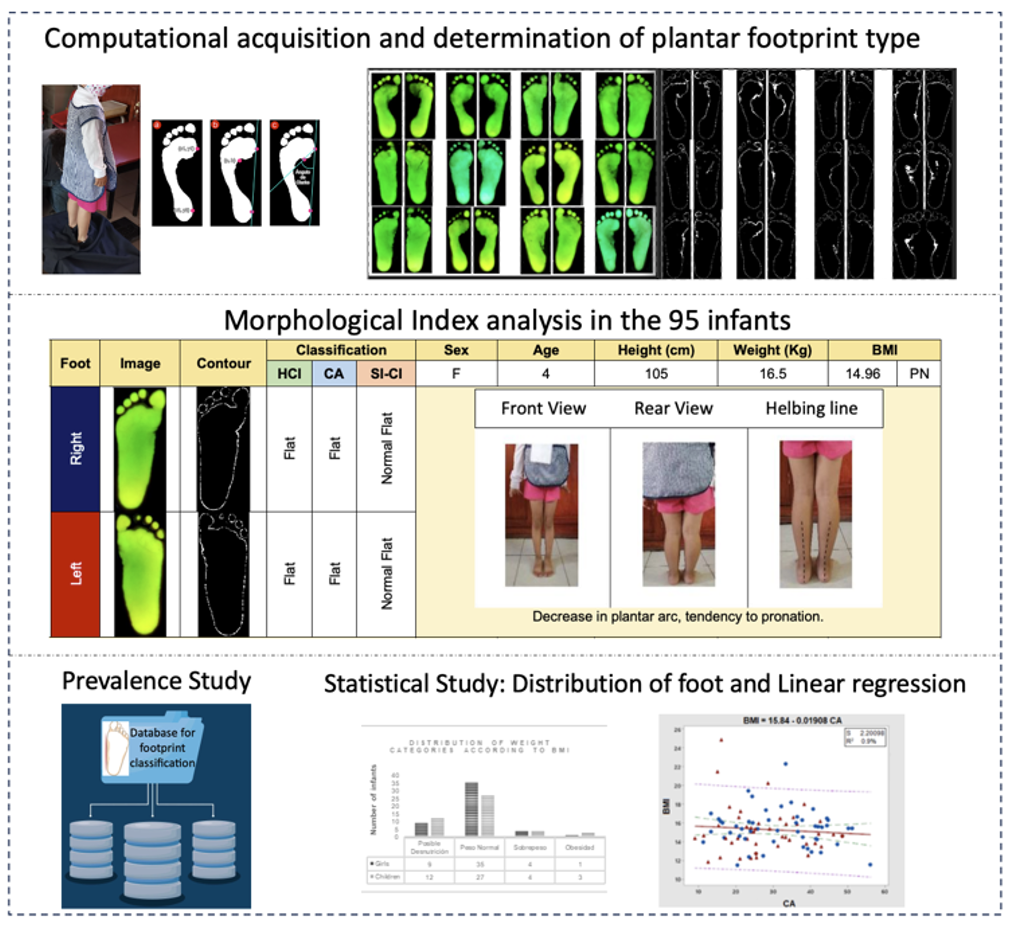
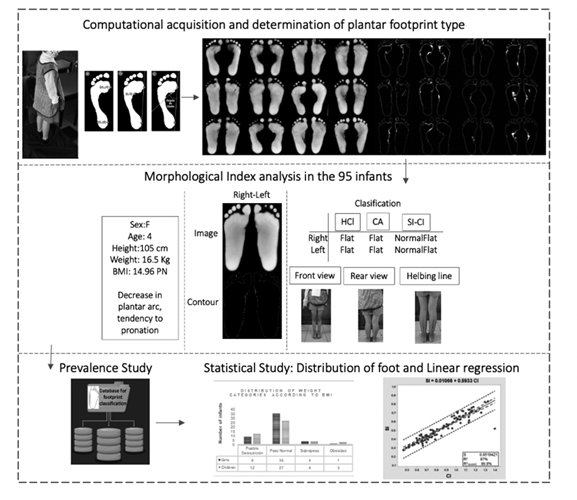
The study required a database of the infant’s body composition, including aspects such as sex, age, height, weight, BMI, Helbing line, in addition to the morphological parameters of their footprint, which were acquired using a photo-podoscope. The processing of the images of the plantar footprint was based on the protocols of Hernández Corvo, CA, and the SCI (Fig. 1) (18-20).
Figure 1: Computational and statistical study on the prevalence of flatfoot in children
Once the data of each infant had been registered, the image of their footprints was captured with the help of a photo-podoscope and white LED strips on the sides. The infant was barefoot, adopting a correct posture without moving their body. The acquired image had a greenish color due to the presence of iron impurities in the glass. In the computing system, the pseudo-color technique was applied, noise was eliminated, and the contour of the plantar prints was acquired on a grayscale. Finally, the values for each footprint (left and right) were recorded according to the aforementioned protocols for later classification (18-20). In addition, a photograph of the back of the legs was taken in order to study the Helbing line and determine the infant’s type of footprint. Once the relevant information and diagnostics were available, they were stored in a database. A categorical distribution was considered in order to determine the volume of cases of infants with flat, normal, and cavus feet, as well as the number of underweight, regular-weight, overweight, and obese children with regard to their BMI weight category. All this, while aiming to have a complete perspective of the infants in this community (Fig. 1). Linear regression was employed to find a relationship between the parameters, with the purpose of explaining why the correction of the plantar arch can be affected or not by gender and nutritional habits.
Statistical análisis
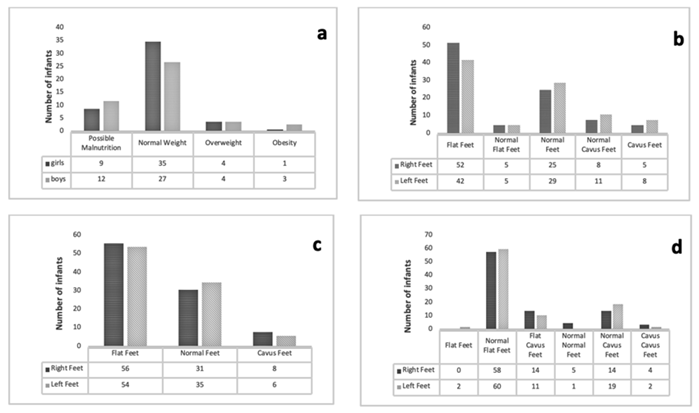
The bar graph statistical method considers the absolute frequency by weight category and the application of the protocols in each foot (r for right, l for left), followed by the percentage of presence. The distribution by weight category according to the BMI (Fig. 2a) shows the highest number of infants with normal weight (62), followed by those at risk of malnutrition (21), with overweight and obese children being a minority. Fig. 2b shows the distribution according to the HCI protocol. The classification is broadened to r: 54,74 % and l: 44,21 % for flat and flat-normal and r: 26,32 % and l: 30,52 % for normal feet, with a prevalence of flatfoot. According to the distribution by CA (Fig. 2 c), flatfoot prevails with r: 58,95 % and l: 56,84 %. CA contributes with particularities in the shape of the arch. Assessing the arch angle of the plantar vault is important among for aged 3-5, as they are in the early stages of development, so the incidence of this pathology is higher 1. As for the SCI (Fig. 2 d), there is a predominance of normal flatfoot, with r: 61,05 % and l: 63,16 %, broadening the classification to flat-flat, flat-normal, and flat-cavus.
Figure 2: a) Distribution of weight categories according to the BMI and foot types according to b) HCI, c) CA, and d) SCI
Flat, normal, and cavus foot
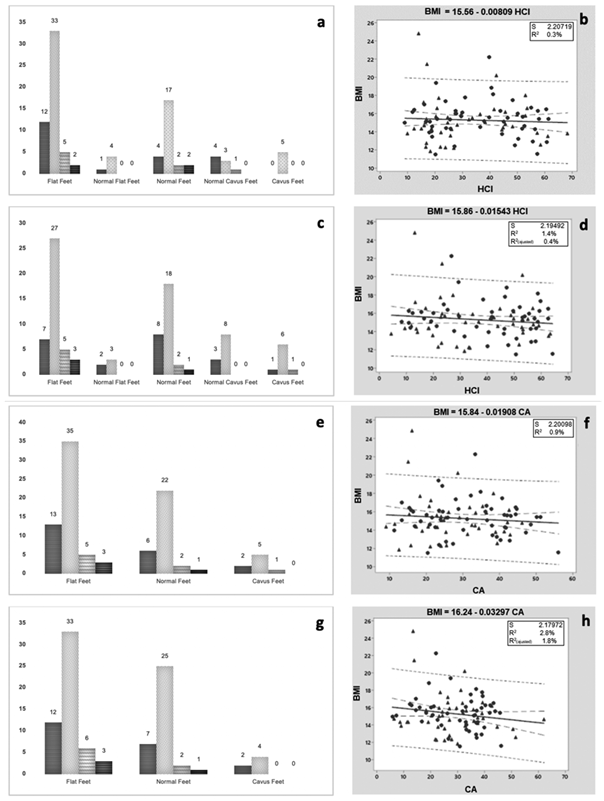
Linear regression analysis allows comparing HCI and CA values against BMI and sex data. Fig. 3 shows the distribution of cases and line plots fitted according to their respective characteristic equation, R 2 values, and standard deviation (S). The green dotted lines represent 95 % confidence intervals, and the purple dotted lines denote 95 % prediction intervals. Red triangles represent male cases, and blue circles represent female cases. Figs. 3a, 3c, 3e, and 3g show the bar distribution, representing posible malnutrition, normal weight, overweight, and child obesity (right to left). A moderate and statistically significant correlation is observed for flat and normal foot types with a prevalence in normal weight. Figs. 3b, 3d, 3f, and 3h show the tendency of each fit equation of the type y = mx + b, representing the point cloud analysis of the male and female cases, which was done via a residual analysis, generating linear prediction regression. The efficacy of the predictions generates the linearity, and the point cloud of cases is parallel to the linearity axis, which maintains a homogeneous axis throughout the distribution. The residuals are normally distributed above and below the line, with the presence of some scattered values. The tendency towards flatfoot in its flat and normal-flat variants is predicted with respect to the HCI and the BMI. These correlations are statistically significant, with a prevalence in males. Based on the R 2 ratio and 17, it can be stated that there is a certain relationship between the BMI and the type of footprint; the higher the BMI value, the greater the tendency towards flatfoot in these children.
Figure 3: Distribution of foot types evaluated via: HCI in relation to the BMI, right foot (a, b) and left foot (c, d); and AC in relation to the BMI right foot (e, f) and left foot (g, h)
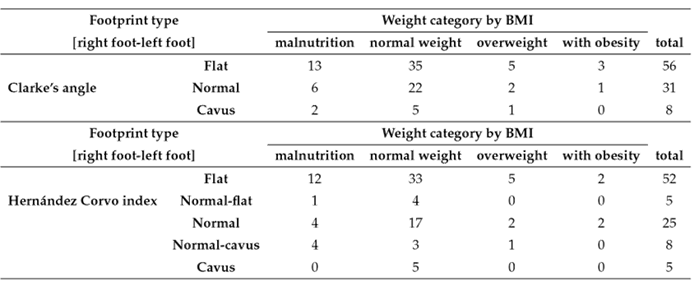
Table I shows the relationship between nutritional status and AC and HCI for children in early childhood. The prevalence of flatfoot in the four weight categories is higher than that of normal and cavus foot. The assessments of 5 in children from 6 to 13 years of age in a Mexican community found a prevalence of cavus foot in the four weight categories. Similarly, the overweight and child obesity categories did not influence the results.
Table I: Relationship of nutritional status and type of footprint
Results
Correlation between the protocols and foot type classification
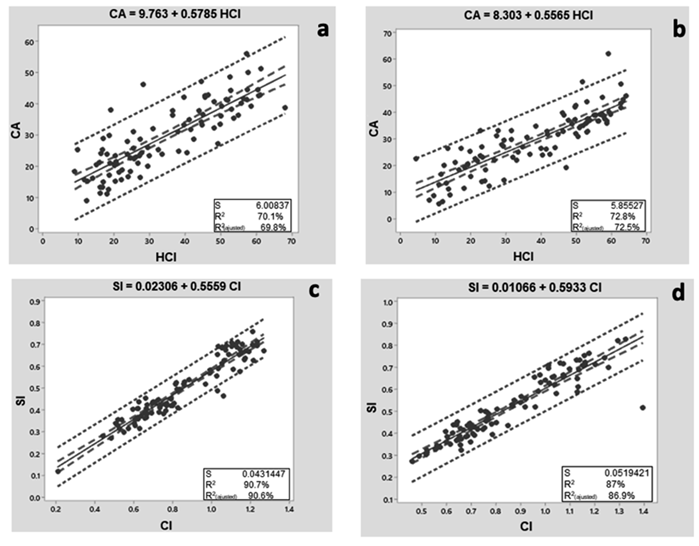
Figs. 4a and 4b show positive correlation lines derived from the equations that relate the values of the CA and HCI protocols for both feet, i.e., r and l : CA(r) = 9, 763 + 0, 5785HCI(r) and CA(l) = 8, 303 + 0, 5565HCI(l). For the right foot, an R 2 of 70,1 % is reported, which indicates that the model can provide predictions with a low error rate and a better distribution. In addition, the R 2 of the left foot is 72,8 %. Figs. 4c and 4d compare the SI and CI values to determine the accuracy of the classification when evaluating both r and l : SI(r) = 0, 02306 + 0, 5559 CI(r) and SI(l) = 0, 01066 + 0, 5933 CI(l). This is done while using the specific flat-flat, flat-normal, flat-cavus, normal-normal, normal-cavus, and cavus-cavus foot categories. There is a prevalence of the flat-normal category, and the relationship between the indices reports an R 2 of 90,7 % for the right foot and 87,0 % for the left one. The prediction of the model maintains the tendency towards a linear relation with positive incremental dispersion and few atypical values.
Figure 4: Correlation between values of HCI and CA for a) the right foot and b) the left foot; and between the SI and CI values for c) the right foot and d) the left foot
For the general group, there is a major tendency towards having a flat right foot (above 54,74 %) and having a flat left foot (above 44,21 %). Statistical analysis via linear regression constitutes a complementary approach to support the values acquired through computational techniques. The prediction of the relationship between the values of the CA and HCI protocols indicates a high R 2 (70,1 %). Moreover, as for the ratio between the SI and CI protocols, the R 2 is higher than 87,0 %. This, in turn, with a positive upward trend and a few atypical values. Finally, the expected results highlight the need to continue studying infant footprint types in the communities of Mexico. It is necessary to raise awareness in order for families to conduct clinical diagnosis of the footprint at an early age and seek corrections of the longitudinal arc and flat feet with the elaboration of custom insoles. In this way, the footstep is corrected, and the posture is improved. It is alarming to consider that, due to the economy of the families in Mexico, very few will continue with a specialist diagnosis.
Discussion
This research studied the prevalence of flatfoot in children in a rural region of Mexico, finding some conditions that likely interfere with plantar arch correction. Several research works have attempted the same, but there are no standards to evaluate the characteristics that hinder plantar arch correction, although, in many cases, a correlation between morphological, nutritional, and footprint parameters is reported, albeit without conclusive results. Via a linear analysis of the distribution and the correlation between the BMI and the foot type, it was found that the weight of children does not necessarily have a direct influence on the prevalence of flatfoot. However, regarding sex, flatfoot is apparently more common in males.
As for the protocols for evaluating footprints, there are works that employ comparisons to find the most comprehensive and easy method to make a correct diagnosis of the foot. There are works that use the SI and the CI with different complementary protocols. CA has been widely used to calculate the plantar arch because it is faster and provides a good degree of confidence. The HCI is one of the most complete and assertive procedures to diagnose footprints, but it can be slow and complicated.
Combining these techniques with computational systems allows for complete evaluations and finding faster correlations that can be used by specialists in medical consultations.
In recent years, computational systems and dynamic studies have become more common and complete, as they allow quickly determining aspects such as foot type, posture, and footprint pressure, as well as diagnosing special conditions like diabetic foot, among others. Because of this, many people can get a better and cheaper medical evaluation of their feet, but there are locations where this kind of technology is not available or where information on the issue is limited.
Conclusion
Statistical analysis via linear regression does not show the prevalence of flatfoot to be clearly supported by the nutritional habits of the infant or by sex. As for the higher number of cases of flatfoot, the age of the infants must be considered. It may be that 3- to 5-year-olds have not completely developed their plantar arch, but they should exhibit a tendency towards normal foot in individual evaluations. To know if children with flatfoot have a real chance at correcting their longitudinal arch, it is necessary to perform a thorough evaluation of the tendency of the arch, which must be performed by a specialist. Unfortunately, the infants of Mexican communities have limited access to appropriate treatment or comfort shoe insoles.
Consequently, with complete information about plantar issues in infants, the rural regions of Mexico could treat discomforts just in time and prevent posture issues, as well as feet, back, or knee pain or the impossibility to exercise. Moreover, habits could be imparted to ensure the correct development of the longitudinal arch, which could be supported by computational studies aimed at eradicating these problems at every socioeconomic level. This implies a wide field of study focusing on the development of new and more efficient computational systems at low costs, with which the evolution of the plantar arch could be predicted
References
Licencia
Derechos de autor 2024 Carlos I. Cabrera-Perez, Juan A. López-Valdez, Horacio Rostro-González, Jatziry S. Cano-Lara, Miroslava Cano-Lara

Esta obra está bajo una licencia internacional Creative Commons Atribución-NoComercial-CompartirIgual 4.0.
A partir de la edición del V23N3 del año 2018 hacia adelante, se cambia la Licencia Creative Commons “Atribución—No Comercial – Sin Obra Derivada” a la siguiente:
Atribución - No Comercial – Compartir igual: esta licencia permite a otros distribuir, remezclar, retocar, y crear a partir de tu obra de modo no comercial, siempre y cuando te den crédito y licencien sus nuevas creaciones bajo las mismas condiciones.



2.jpg)


