DOI:
https://doi.org/10.14483/udistrital.jour.tecnura.2017.2.a04Publicado:
01-04-2017Número:
Vol. 21 Núm. 52 (2017): Abril - JunioSección:
InvestigaciónA quantitative and qualitative performance analysis of compressive spectral imagers
Una comparación cuantitativa y cualitativa de análisis de rendimiento de las cámaras espectrales compresiva
Palabras clave:
Sampling matrix, compressive sampling architectures, spectral image (en).Palabras clave:
Matriz de muestreo, arquitecturas de muestreo compresivo, imágenes espectrales (es).Descargas
Referencias
Arafat, S.M.; Aboelghar, M.A. & Ahmed, E.F. (2013). Crop Discrimination Using Field Hyper Spectral Remotely Sensed Data. Advances in Remote Sensing, 02(02), 63–70. http://doi.org/10.4236/ars.2013.22009
Arce, G.R.; Brady, D.J.; Carin, L.; Arguello, H. & Kittle, D.S. (2014). Compressive coded aperture spectral imaging: An introduction. IEEE Signal Processing Magazine. http://doi.org/10.1109/MSP.2013.2278763
Arguello, H. & Arce, G. (2010). Code aperture design for compressive spectral imaging. In 18th European Signal Processing Conference (pp. 1434–1438). http://doi.org/10.1086/180230
Backhaus, A.; Bollenbeck, F. & Seiffert, U. (2011). Robust classification of the nutrition state in crop plants by hyperspectral imaging and artificial neural networks. In 2011 3rd Workshop on Hyperspectral Image and Signal Processing: Evolution in Remote Sensing (WHISPERS) (pp. 1–4). IEEE. http://doi.org/10.1109/WHISPERS.2011.6080898
Baraniuk, R.G. (2007). Compressive Sensing. IEEE Signal Processing Magazine, 118–124.
Bioucas-Dias, J.M & Figueiredo, M.A.T. (2007). A new TwIST: Two-step iterative shrinkage/thresholding algorithms for image restoration. IEEE Transactions on Image Processing, 16(12), 2992–3004.
Camacho-Velasco, A.; Vargas-García, C.A.; Rojas-Morales, F.A.; Castillo-Castelblanco, S.F. & Argüello-Fuentes, H. (2015). Aplicaciones y retos del sensado remoto hiperespectral en la geologia colombiana Applications and challenges of hyperspectral remote sensing in the colombian geology Aplicações e desafios do sensoriamento remoto hiperespectral na geologia colombiana. Revista Facultad de Ingeniería (Fac. Ing.), 24(40), 17–29.
Correa, C.V.; Argüello, H. y Arce, G.R. (2014). Compressive spectral imaging with colored-patterned detectors. In Acoustics, Speech and Signal Processing (ICASSP), 2014 IEEE International Conference on (pp. 7789–7793).
Donoho, D.L. (2006). Compressed sensing. IEEE Transactions on Information Theory, 52(4), 1289–1306. http://doi.org/Doi 10.1109/Tit.2006.871582
Espitia, M.O.; Mejía, M.Y. & Argüello, F.H. (2016). Tomagrafía computariza: proceso adquisición, tecnología y estado actual. Revista Tecnura, 20(47), 119-135.
Figueiredo, M.A.T.; Nowak, R.D. & Wright, S.J. (2007). Gradient projection for sparse reconstruction: Application to compressed sensing and other inverse problems. IEEE Journal on Selected Topics in Signal Processing, 1(4), 586–597. http://doi.org/10.1109/JSTSP.2007.910281
Foucart, S. & Rauhut, H. (2013). A Mathematical Introduction to Compressive Sensing. New York: Springer.
Golbabaee, M.; Arberet, S. & Vandergheynst, P. (2013). Compressive Source Separation: Theory and Methods for Hyperspectral Imaging. IEEE Transactions on Image Processing, 22(12), 5096–5110. http://doi.org/10.1109/TIP.2013.2281405
Griffin, M.K.; May-Hsu, S.; Burke, H.K.; Orloff, S.M. & Upham, C.A. (2005). Examples of EO-1 Hyperion data analysis. Lincoln Laboratory Journal, 15(2), 271–298.
Grupo de Inteligencia Computacional de la Universidad del País Vasco (UPV/EHU). (2014). Hyperspectral Remote Sensing Scenes. Retrieved from http://www.ehu.eus/ccwintco/index.php?title=Hyperspectral{_}Remote{_}Sensing{_}Scenes
Hayashi, K.; Nagahara, M. & Tanaka, T. (2013). A user’s guide to compressed sensing for communications systems. IEICE Transactions on Communications, E96-B(3), 685–712. http://doi.org/10.1587/transcom.E96.B.685
Indiana’s, A.N.W. (1992). Indiana’s Indian Pines Dataset. Retrieved from https://engineering.purdue.edu/~biehl/MultiSpec/hyperspectral.html
Lelong, C.C.D.; Roger, J.M.; Brégand, S.; Dubertret, F.; Lanore, M.; Sitorus, N.A.; … Caliman, J.P. (2010). Evaluation of oil-palm fungal disease infestation with canopy hyperspectral reflectance data. Sensors, 10(1), 734–747. http://doi.org/10.3390/s100100734
Lin, X.; Liu, Y.; Wu, J. & Dai, Q. (2014). Spatial-spectral encoded compressive hyperspectral imaging. ACM Trans. Graph., 33(6), 233:1–233:11. http://doi.org/10.1145/2661229.2661262
Martin, G.; Bioucas-Dias, J.M. & Plaza, A. (2015). HYCA: A New Technique for Hyperspectral Compressive Sensing. IEEE Transactions on Geoscience and Remote Sensing, 53(5), 2819–2831. http://doi.org/10.1109/TGRS.2014.2365534
Mishne, G.; Talmon, R. & Cohen, I. (2015). Graph-based supervised automatic target detection. IEEE Transactions on Geoscience and Remote Sensing, 53(5), 2738–2754. http://doi.org/10.1109/TGRS.2014.2364333
Morteza, H. (2015). Reducing ADC Sampling Rate with Compressive Sensing. ArXiv Preprint arXiv:1503.00311, 1–8.
Nyquist, H. (1928). Certain Topics in Telegraph Transmission Theory. Transactions of the American Institute of Electrical Engineers, 47, 617–644.
Ozturk, S.; Esin, Y.E. y Artan, Y. (2015). Object Detection in Rural Areas using Hyperspectral Imaging, 96432M. http://doi.org/10.1117/12.2195326
Soydan, H.; Koz, A.; Azebnem Düzgün, H. & Aydin Alatan, A. (2015). Hydrocarbon microseepage mapping using signature based target detection techniques. In SPIE Remote Sensing (pp. 96440I-96440I). International Society for Optics and Photonics. http://doi.org/10.1117/12.2195105
Velasco, A.C.; García, C.A. & Fuentes, H.A. (2016). Un estudio comparativo de algoritmos de detección de objetivos en imágenes hiperespectrales aplicados a cultivos agrícolas en Colombia. Revista Tecnura, 20(49), 86-99.
Wright, S.J.; Nowak, R.D. & Figueiredo, M.A.T. (2009). Sparse reconstruction by separable approximation. IEEE Transactions on Signal Processing, 57(7), 2479–2493.
Zare, A.; Bolton, J.; Chanussot, J. & Gader, P. (2014). Foreword to the Special Issue on Hyperspectral Image and Signal Processing. Selected Topics in Applied Earth Observations and Remote Sensing, IEEE Journal of, 7(6), 1841–1843. http://doi.org/10.1109/JSTARS.2014.2341811
Cómo citar
APA
ACM
ACS
ABNT
Chicago
Harvard
IEEE
MLA
Turabian
Vancouver
Descargar cita
DOI: http://dx.doi.org/10.14483/udistrital.jour.tecnura.2017.2.a04
A quantitative and qualitative performance analysis of compressive spectral imagers
Una comparación cuantitativa y cualitativa de análisis de rendimiento de las cámaras espectrales compresiva
Ferley Medina Rojas1, Henry Arguello Fuentes2, Cristina Gómez Santamaría3
1 Systems engineer, agricultural engineer, specialist in regional development management, specialist in telecommunication networks, master in telematics, candidate for doctor in engineering. Professor of the Universidad Cooperativa de Colombia. Neiva, Colombia. Contact: ferley.medina@campusucc.edu.co
2 Electronic engineer, master in engineering, doctor in engineering. Professor of the Universidad Industrial de Santander. Bucaramanga, Colombia. Contact: henarfu@uis.edu.co
3 Electronic engineer, master in engineering, doctor in engineering. Professor of the Universidad Pontificia Bolivariana. Medellín, Colombia. Contact: cristina.gomez@upb.edu.co
Fecha de recepción: 22 de septiembre de 2016 Fecha de aceptación: 15 de febrero de 2017
Cómo citar: Ferley Medina Rojas; Henry Arguello Fuentes y Cristina Gómez Santamaría. (2017). A quantitative and qualitative performance analysis of compressive spectral imagers. Revista Tecnura, 21(52), 53-67. doi: 10.14483/udistrital.jour.tecnura.2017.2.a04
Abstract
Context: Spectral images (SI) contain spatial-spectral information about a scene arranging in a data cube, which often comprises a significant amount of data. However, traditional (SI) systems acquire data ignoring the high correlation between the measurements and the samples are redundant. Compressive spectral imaging systems compress spectral data in the acquisition step, so it allows reducing redundancy and the data amount. Recently, several spectral imaging systems have become available, providing new functionality for users and opening up the field to a wide array of new applications. For instance, the CASSI, SCSI, SSCS, and HYCA systems are four of the most outstanding systems.
Methods: Some review works have provided comprehensive surveys of the available technologies and have shown how the new capabilities of spectral imaging approaches can be utilized. However, selecting a specific architecture requires a quantitative and qualitative comparison of these systems in the same scenarios.
Results: This paper analyzes the qualitative and quantitative performance of these four compressive spectral imaging systems to evaluate them in the same scenarios. For that, the architectures are modeled as a system of linear equations; then, image reconstructions are accomplished through the same optimization approach, transmittance, coded aperture, and shot numbers.
Conclusion: Results show that the performance of the SSCSI system attains better quality reconstruction in terms of PSNR.
Keywords: sampling matrix, compressive sampling architectures, spectral image.
Resumen
Contexto: Las imágenes espectrales (SI) contienen información espacio-espectral acerca de una escena disponible en un cubo de datos que usualmente comprende una cantidad significativa de éstos. Los sistemas tradicionales de (SI) adquieren datos redundantes ignorando la alta correlación entre las mediciones y las muestras redundantes. Los sistemas de compresión de imágenes espectrales comprimen los datos espectrales en la etapa de adquisición, lo que permite reducir la cantidad de datos y la redundancia. Actualmente, existen varios sistemas de imágenes espectrales disponibles que proporcionan nuevas funciones para los usuarios y abren un amplio campo de nuevas aplicaciones. Por ejemplo, los sistemas de CASSI, SCSI, SSCS, y HYCA son cuatro de los más destacados.
Método: La revisión de algunos trabajos provee amplios estudios de tecnologías disponibles y muestra cómo se pueden utilizar las nuevas capacidades de los enfoques de formación de imágenes espectrales. Sin embargo, para la selección de una arquitectura específica se requiere una comparación cuantitativa y cualitativa de estos sistemas en los mismos escenarios.
Resultados: En este trabajo se analiza el rendimiento cualitativo y cuantitativo de estos cuatro sistemas de compresión de imágenes espectrales para evaluarlos en los mismos escenarios. Para ello, cada arquitectura se modela como un sistema de ecuaciones lineales y el proceso de reconstrucción de las imágenes se logra con el mismo enfoque de optimización transmitancia, código de apertura y número de proyecciones.
Conclusión: Se muestra que el sistema SSCSI alcanza el mejor rendimiento en la reconstrucción con el valor más alto PSNR.
Palabras clave: matriz de muestreo, arquitecturas de muestreo compresivo, imágenes espectrales.
INTRODUCTION
Remote-sensed spectral images (SI) contain high-resolution spectral information about materials or vegetation present over the earth (Griffin, May-Hsu, Burke, Orloff, & Upham, 2005), which corresponds to the surface radiance and reflectance. SI images are used in areas such as environment (Mishne, Talmon, & Cohen, 2015), mining (Soydan, Koz, Azebnem Düzgün, & Aydin Alatan, 2015), geology (Camacho-Velasco, Vargas-García, Rojas-Morales, Castillo-Castelblanco, & Arguello-Fuentes, 2015), and soil characterization (Ozturk, Esin, & Artan, 2015), (Backhaus, Bollenbeck, & Seiffert, 2011). Specifically, in the agricultural area for monitoring, tracking and controlling the growth of the crop, and identifying weeds, pests, diseases, and nutrient deficiencies (Arafat, Aboelghar, & Ahmed, 2013; Lelong et al., 2010), (Velasco, García, & Fuentes, 2016). Each pixel in an SI can be expressed as a vector  which contains one or more mixed spectra from different materials of a scene (Golbabaee, Arberet, & Vandergheynst, 2013). Therefore, it is possible to measure the similarity between two spectra or detect a target by exploring the data contained in the L-dimensional space by applying detection and classification algorithms (Zare, Bolton, Chanussot, & Gader, 2014).
Spectral remote sensing is a task that contains a large volume of data, regularly redundant. This volume of information demands memory, transmission bandwidth, and information recovery. Recently, compressive sampling (CS) theory has been developed to make efficient signal sampling and reduce redundancy by taking advantage of the correlation between measurements (Baraniuk, 2007).
CS establishes that the Nyquist criteria can be overcome (Morteza, 2015; Nyquist, 1928) by compressing and sampling simultaneously (Hayashi, Nagahara, & Tanaka, 2013). This theory is based on the principles of sparseness and incoherence (Arce, Brady, Carin, Arguello, & Kittle, 2014), (Espitia, Mejía, & Arguello, 2016). In this way, calculating a set of sparse coefficients in some basis (e.g. Wavelet), corresponding to a vector  , that represents the spectral image where M and N represent the spatial dimension and L the spectral dimension), allows to recover the signal without distortion (Baraniuk, 2007). The vector f can also be expressed by
  s where
  contains only
  non-zero elements and
  is a sparseness operator. The measurements vector
  is obtained as g=Hf, where
  is a sensing matrix. By choosing q projections of H and assuming sparseness of f in the ψ domain, the signal f can be recovered from model
  s (Donoho, 2006).
In recent years, CS was adopted as an SI sampling protocol. The following architectures were selected because they are widely used in CS studies such as Coded Aperture Snapshot Spectral Imaging system (CASSI) (Arguello & Arce, 2010). In this case, the main elements are coded aperture, a dispersive element, and the sensor responsible for capturing the energy of the encoded scene, the coded apertures are matricial arrays composed by translucent optical elements that block or unblock the path of light through the system. Another well-know system is the Spatial Spectral encoded Compressive hyper-Spectral Imaging system (SSCSI) (Lin, Liu, Wu, & Dai, 2014). In this system the spatial-spectral sampling encoded scheme modulates the RGB bands achieving a spatially changing spectral coding that provides a higher degree of randomness in the measured projections, and a coding mask that encodes each spectral channel independently. On the other hand, a recent architecture is the Snapshot Colored Compressive Spectral Imager system (SCCSI) (Correa, Arguello, & Arce, 2014). In this architecture, an array of optical filters encodes the input source, and then a dispersive element disperses it; both processes are integrated along the spectral range sensitivity of the detector. The last architecture presented in this paper is the Hyper-spectral Coded Aperture system (HYCA) (Martin, Bioucas-Dias, & Plaza, 2015), which is a theoretical architecture based on compression blocks of pixels in the spectral bands according to the compression window size, which allows simultaneous sampling and compression of SI.
This paper analyzes qualitative and quantitative performance of these four compressive spectral imaging systems in the same conditions. For that, the architecture are modeled as a system of linear equations, and then image reconstructions are accomplished with the same optimization approach. This paper is organized as follows: section II shows the formulation of the sampling model for each system, section III presents the description of the reconstruction algorithm; simulation results are presented in section IV. Finally, conclusions are described in section V.
COMPRESSIVE SAMPLING ARCHITECTURES
Compressive sampling architectures can be modeled by the system as g = hf, where H is the sampling matrix that characterizes the system. The parameters of the sampling matrices depend on the specific architecture (CASSI, SSCSI, SCCSI, or HYCA). In this section, the formulation of the sampling model of each system is shown by characterizing sampling matrices, correlation between the spectral and spatial dimensions of the data cube components, coded aperture pattern, and dispersive elements.
Coded aperture snapshots spectral imaging, CASSI
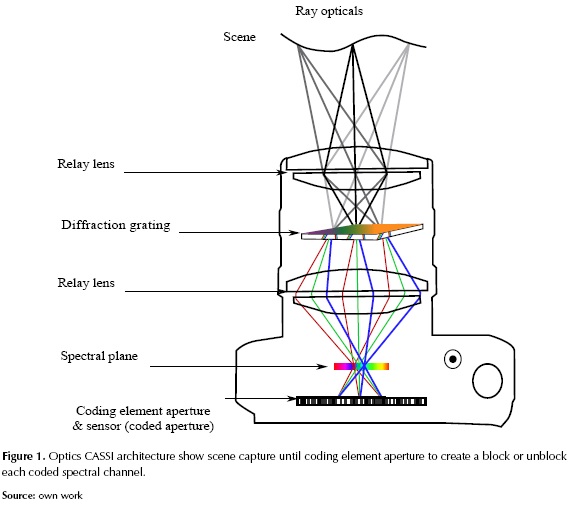
Figure 1 shows the Compressive Spectral Imaging Acquisition system (CASSI) based on coded apertures, represented by T(x,y), which modulates a spatial-spectral scene f0 (x,y,λ). The resulting coded field f1 (x,y,λ) is dispersed by a dispersive element, resulting in equation (1).
Where T(x',y') represents the transfer function of the coded aperture,  is the impulse response of the optical system, and s1λ is the dispersion induced by the dispersive element, assumed as linear dispersion. Compressed measurements are acquired when the field
  is integrated into the detector (Arguello & Arce, 2010).
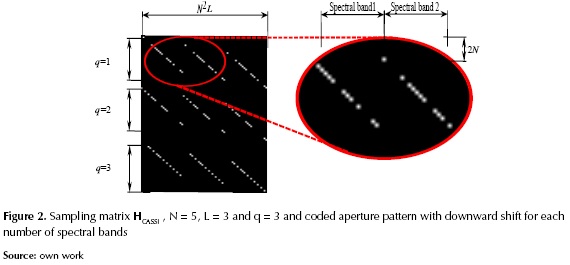
Equation (1) can be expressed as a system of linear equation g = HCASSIf where HCASSI represents the CASSI sensing matrix. The matrix HCASSI accounts for the effects of the coded aperture and the dispersive element. Figure 2 shows the CASSI sampling matrix  , where q is the number of coded projections (shots) for N = 5, L = 3 and q = 3. The number of measurements is
  . The diagonal patterns that show in the horizontal direction are the coded aperture pattern, each time with an N unit downward shift, as many times as the quantity of spectral bands.
Spatial-spectral encoded compressive HS imager, SSCSI
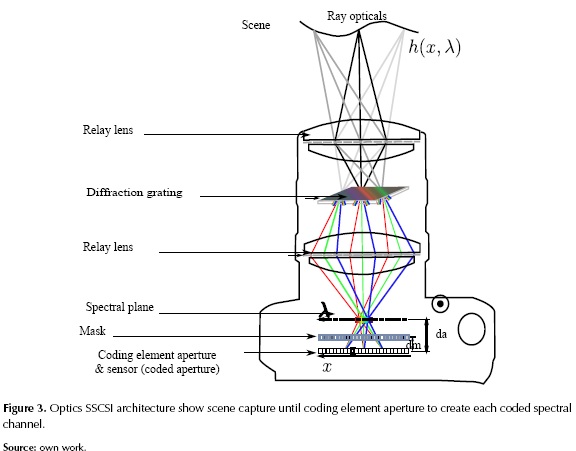
The Spatial-Spectral encoded Compressive HS imager (SSCSI) is illustrated in figure 3. This system allows the reconstruction of a high-resolution spectral image from a single sensor, due to the design of the optical camera being based on the sampling of spatial-spectral encoded image, which is given by  for three-dimensional hyper-spectral images (Lin et al., 2014). The image is formed by the projection of the hyper-spectral image through the spectral dimensions Ωλ; it can be expressed as equation (2).
The coded sensor image can be expressed as equation (3).
Figure 3 shows the calibration parameter for converting spectral coordinate to spatial coordinate; and b is the distance relation between mask to sensor and between spectral planes to sensor. The equation (2) can be modeled as the matrix system SSCSI g = HSSCSIf where  . The number represents the SSCSI sensing matrix. The matrix
  accounts for the effects of the coding mask that encodes each spectral channel independently.
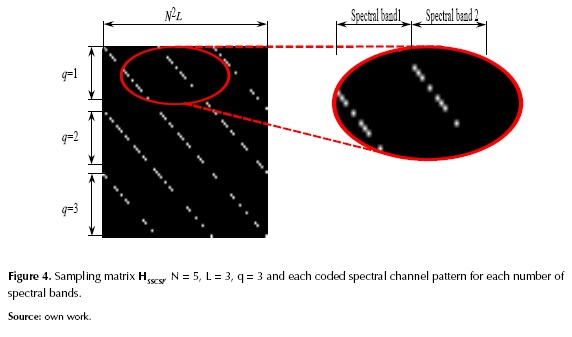
Figure 4 shows the SSCSI sampling matrix  The number of measurements is
  . The diagonal patterns repeated in the horizontal direction correspond to each coded spectral channel pattern independently, as many times as the quantity of spectral bands.
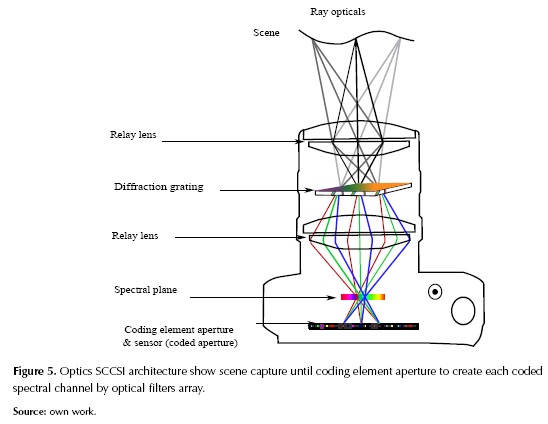
Snapshot colored compressive spectral imager, SCCSI
Figure 5 Optics SCCSI architecture shows that the Snapshot Colored Compressive Spectral Imager (SCCSI) replaces the traditional focal plane array (FPA) by sensors with patterns of optical filters. Furthermore, a dispersive element allows capturing both spatial and spectral information from the spectral image in only one shot. This architecture has an arrangement of optical filters in the detector, with different spectral response, which allows obtaining specific spectral components in each pixel. In this way, the coding scheme is enriched, allowing the reconstruction problem to be better conditioned. The small number of optical elements makes a compact system that generates a considerable cost reduction and helps its implementation (Correa et al., 2014).
In the SCCSI system, a dispersive element spectrally disperses the multispectral image  is spectrally dispersed by, generating the field
  given by equation (4).
Where  is the dispersion and h is the impulse response of the system, f1 is encoded by the optical filters array
  located in the FPA detector, to obtain a coded and dispersed version of the original signal, expressed as equation (5).
Where the system output  is obtained by integrating product of f1. The equation (5) can be expressed as g = HSCCSIf where HSCCSI represents the SCCSI sensing matrix. The matrix HSCCSI is determined by the spectral response of the optical filter matrix structure and represents the proper operation of dispersive elements.
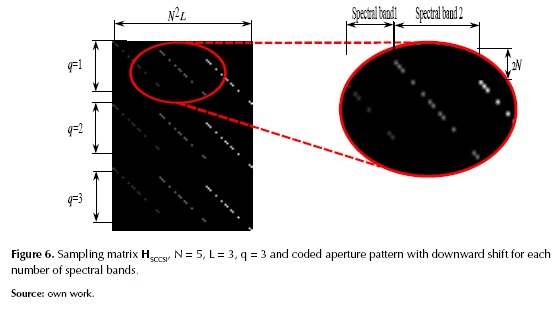
Figure 6 shows the sensing matrix of the SCCSI system  , for N = 5, L = 3 and q = 3. The number of measurements is
  The diagonal patterns that repeat in the horizontal direction correspond to spectral response of the optical filter matrix structure pattern every time with a unit N downward shift, as many times as the quantity of spectral bands.
Hyper-spectral coded aperture, HYCA
The methodology based on Hyper-spectral Coded Aperture (HYCA) relies on two characteristics of hyper-spectral images: first, the low dimensional space where the hyper-spectral vector belongs; second, the high correlation between the spectral and spatial dimensions of the data cube components. The vectored data cube is defined as  , and the measurement vector
  is modeled as equation (5).
Where  is an operator that calculates M inner products between the hyper-spectral vector and f, and w represents the noise level. As H is a linear operator, then H(f) can be rewritten as HHYCAf where
  is the matrix modeling the linear operator H.
The matrix H is constructed as equation (7).
Where  is the block diagonals, and
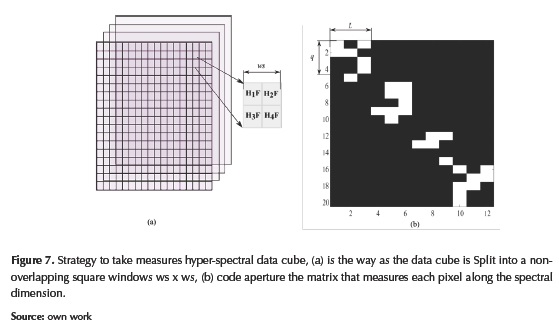
  is the matrix that measures each pixel along the spectral dimension (Martin et al., 2015). In contrast to other architectures, HYCA measurement process selects sub-compression matrices using Gaussian or Bernoulli i.e. random projections
  as illustrated in figure 7, where the data cube is split into a non-overlapping square window ws x ws, and ws is the window size.
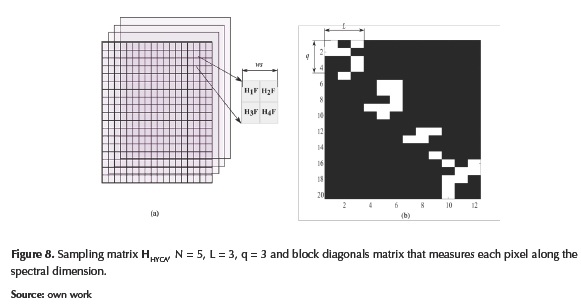
Figure 8 shows the sensing matrix of the HYCA system  , for N = 5, L = 3 and q = 3. The number of measurements is
  . The diagonal patterns that repeat correspond to equation (7).
Coded aperture and transmittance
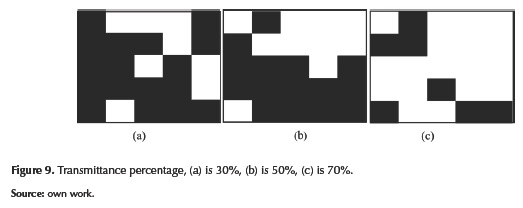
The coded aperture and transmittance define the information that the architecture has on each scene. Each one of the architectures has their self-definition of these elements. The coded aperture is an element that encodes the light before it is integrated with the detector. The amount of light that passes is given by the transmittance, as illustrated in figure 9 with different transmittance percentages. Transmittance can be written as equation (8).
Where is tth element of the coded aperture and, Q is the amount of total elements in the coded aperture. CASSI has values xi ϵ {0,1} (Arguello & Arce, 2010); SSCSI, xi ϵ {0,1} (Lin et al., 2014); SCCSI, xi ϵ {0,...,1} (Correa et al., 2014), and HYCA, xi ϵ {0,...,1} (Martin et al., 2015).
Summary of architectures
Table 1 shows the characteristics of the different architectures, such as the compression, matrix H and the way each element is coded. Furthermore, the architectures with the best compression rate are SSCSI and, HYCA. However, HYCA is not a real architecture, but a theoretical method.
Image reconstruction
The reconstruction is based on responding a linear undetermined system of equations from estimating f with a minimization function, which is expressed as equation (9).
Where the parameter τ is regularization constant and H can be the mentioned sensing matrices in table 1. The reconstruction requires using algorithms to converge quickly such problems. For example the GPSR algorithm (Figueiredo, Nowak, & Wright, 2007); the TWIST algorithm, which uses an implicit dispersed dictionary as total variation to solve the optimization problem (Bioucas-Dias & Figueiredo, 2007); the SPARSA algorithm, designed to solve optimization problems on a large scale, and it involves the sum of a term of soft error and a regularizing term correlated to the GPSR that is not limited to the regularization l1 (Wright, Nowak, & Figueiredo, 2009).
METHODOLOGY
The simulations for this paper were developed on two test datasets and several experiments with measurements obtained from datasets with different compression rates from 12,50% to 52,73%, in order to analyze the reconstruction performance of each architecture. We used the Indian Pines and Salinas datasets from AVIRIS sensor for the simulations (Indiana's, 1992). Indian Pines dataset had 145 x 145 pixels, 220 spectral bands ranging from 0.2 to 2.4 mm with a spatial resolution of 20 m. Salinas dataset had 512 x 217 pixels, 224 spectral bands, and spectral resolution of 3.7 m. (Grupo de Inteligencia Computacional de la Universidad del País Vasco (UPV/EHU), 2014). We used 8 spectral bands with 128x128 pixels from each dataset. The reconstruction algorithm used was GPSR (Wright et al., 2009) with up to 200 iterations; the transmittance in the random matrices was 50%, and shots up to q = 4.
RESULTS
For simulations, sensing matrices depicted in table 1 performed the compressive measurements. Table 2 details the PSNR as a function of the number shots, the data compression, and the PSNR values obtained in the reconstruction for CASSI, SSCSI, SCCSI, and HYCA measurements. It also shows that SSCS from 1 to 2 shots has the highest value reached (32,91 [dB] and 35,05 [dB]), while HYCA from 3 to 4 shots has the highest value reached (37,65 [dB] and 37,59 [dB]). Additionally, in all architectures the higher the number of shots, the higher the PSNR of reconstructed images.
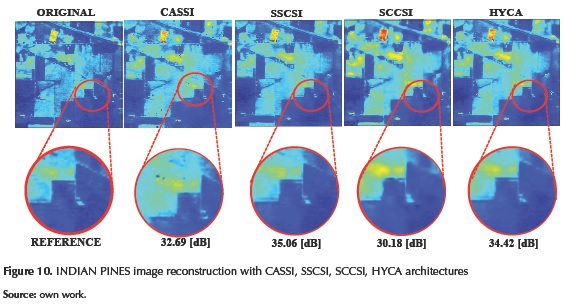
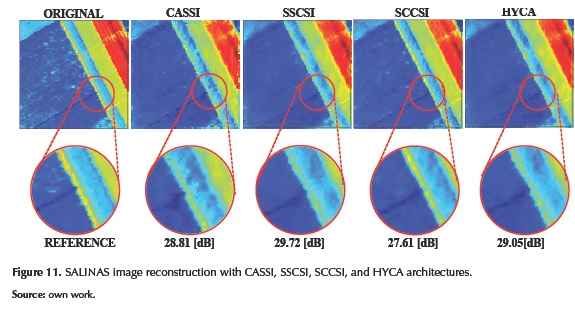
Figure 10 and figure 11 show the Indian Pines and Salinas data cube reconstructions for CASSI, SSCSI, SCCSI and HYCA architectures, with their respective PSNR. In addition, the best reconstruction was 35,06 [dB], performed with a 25% compression of the SSCSI data measurements.
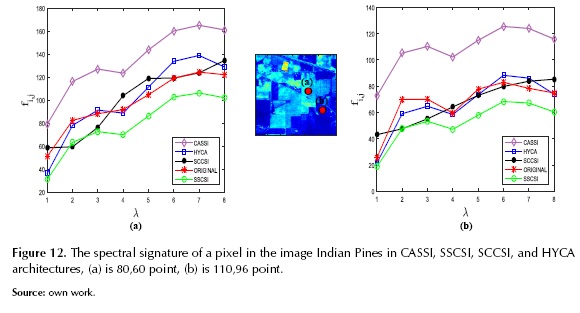
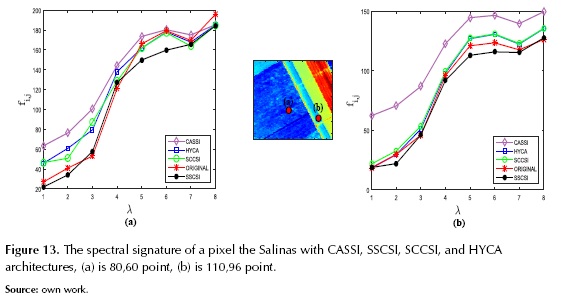
Figure 12 and figure 13 show the spectral signatures of the pixels in the spatial coordinates (80, 60) and (110, 96) generated for CASSI, SSCSI, HYCA, and SCCSI architectures of the Salinas and Indian Pines images. CASSI spectral signature has a starting point value at 60% above Indian Pines spectral signature and ends up at 33% above; HYCA spectral signature has intensity value at 20% below and finishes at 11% above; and SSCSI follows that behavior. In the case of spectral signature of the SALINAS, spectral signature of the CASSI starting point value was 140% above and ends at 10% below; HYCA spectral signature has intensity value at 80% above and finishes at 10% below. This can be generalized for both pixels in both images.
CONCLUSIONS
In this work, we presented a coded aperture pattern, data compression, peak signal-to-noise ratio (PSNR) and dispersive elements analysis of CASSI, SSCSI, SCCSI, and HYCA compressive sampling systems. In order to compare qualitatively, the sampling matrices of each architectures were depicted. The main difference between the architectures is the way to compress the image; CASSI spatially encodes each spectral band equally, and the measurements are the integration on the detector of a coded and shifted version of the spectral bands. On the contrary, SCCSI codes in a space-spectral way, so coding each band is different. The SSCSI measurements are multiplexed without a shift; and HYCA is a theoretical compression method that poses the spectral attenuation of pixels multiplexed without a shift in the spectral bands.
The construction of the measurements affects the quality of the reconstruction in each architecture, and this is proved in the results of the simulations, in which the same parameters are set up while comparing the different architectures. SSCSI reaches the highest PSNR value (35.06 [dB]) with the 25 % of data compression.
REFERENCES
Arafat, S.M.; Aboelghar, M.A. & Ahmed, E.F. (2013). Crop Discrimination Using Field Hyper Spectral Remotely Sensed Data. Advances in Remote Sensing, 02(02), 63-70. http://doi.org/10.4236/ars.2013.22009
Arce, G.R.; Brady, D.J.; Carin, L.; Arguello, H. & Kittle, D.S. (2014). Compressive coded aperture spectral imaging: An introduction. IEEE Signal Processing Magazine. http://doi.org/10.1109/MSP.2013.2278763
Arguello, H. & Arce, G. (2010). Code aperture design for compressive spectral imaging. In 18th European Signal Processing Conference (pp. 1434-1438). http://doi.org/10.1086/180230
Backhaus, A.; Bollenbeck, F. & Seiffert, U. (2011). Robust classification of the nutrition state in crop plants by hyperspectral imaging and artificial neural networks. In 2011 3rd Workshop on Hyperspectral Image and Signal Processing: Evolution in Remote Sensing (WHISPERS) (pp. 1-4). IEEE. http://doi.org/10.1109/WHISPERS.2011.6080898
Baraniuk, R.G. (2007). Compressive Sensing. IEEE Signal Processing Magazine, 118-124.
Bioucas-Dias, J.M & Figueiredo, M.A.T. (2007). A new TwIST: Two-step iterative shrinkage/thresholding algorithms for image restoration. IEEE Transactions on Image Processing, 16(12), 2992-3004.
Camacho-Velasco, A.; Vargas-García, C.A.; Rojas-Morales, F.A.; Castillo-Castelblanco, S.F. & Argüello-Fuentes, H. (2015). Aplicaciones y retos del sensado remoto hiperespectral en la geologia colombiana Applications and challenges of hyperspectral remote sensing in the colombian geology Aplicações e desafios do sensoriamento remoto hiperespectral na geologia colombiana. Revista Facultad de Ingeniería (Fac. Ing.), 24(40), 17-29.
Correa, C.V.; Argüello, H. y Arce, G.R. (2014). Compressive spectral imaging with colored-patterned detectors. In Acoustics, Speech and Signal Processing (ICASSP), 2014 IEEE International Conference on (pp. 7789-7793).
Donoho, D.L. (2006). Compressed sensing. IEEE Transactions on Information Theory, 52(4), 1289-1306. http://doi.org/Doi 10.1109/Tit.2006.871582
Espitia, M.O.; Mejía, M.Y. & Argüello, F.H. (2016). Tomagrafía computariza: proceso adquisición, tecnología y estado actual. Revista Tecnura, 20(47), 119-135.
Figueiredo, M.A.T.; Nowak, R.D. & Wright, S.J. (2007). Gradient projection for sparse reconstruction: Application to compressed sensing and other inverse problems. IEEE Journal on Selected Topics in Signal Processing, 1(4), 586-597. http://doi.org/10.1109/JSTSP.2007.910281
Foucart, S. & Rauhut, H. (2013). A Mathematical Introduction to Compressive Sensing. New York: Springer.
Golbabaee, M.; Arberet, S. & Vandergheynst, P. (2013). Compressive Source Separation: Theory and Methods for Hyperspectral Imaging. IEEE Transactions on Image Processing, 22(12), 5096-5110. http://doi.org/10.1109/TIP.2013.2281405
Griffin, M.K.; May-Hsu, S.; Burke, H.K.; Orloff, S.M. & Upham, C.A. (2005). Examples of EO-1 Hyperion data analysis. Lincoln Laboratory Journal, 15(2), 271-298.
Grupo de Inteligencia Computacional de la Universidad del País Vasco (UPV/EHU). (2014). Hyperspectral Remote Sensing Scenes. Retrieved from http://www.ehu.eus/ccwintco/index.php?title=Hyperspectral{_}Remote{_}Sensing{_}Scenes
Hayashi, K.; Nagahara, M. & Tanaka, T. (2013). A user's guide to compressed sensing for communications systems. IEICE Transactions on Communications, E96-B(3), 685-712. http://doi.org/10.1587/transcom.E96.B.685
Indiana's, A.N.W. (1992). Indiana's Indian Pines Dataset. Retrieved from https://engineering.purdue.edu/~biehl/MultiSpec/hyperspectral.html
Lelong, C.C.D.; Roger, J.M.; Brégand, S.; Dubertret, F.; Lanore, M.; Sitorus, N.A.; ... Caliman, J.P. (2010). Evaluation of oil-palm fungal disease infestation with canopy hyperspectral reflectance data. Sensors, 10(1), 734-747. http://doi.org/10.3390/s100100734
Lin, X.; Liu, Y.; Wu, J. & Dai, Q. (2014). Spatial-spectral encoded compressive hyperspectral imaging. ACM Trans. Graph., 33(6), 233:1-233:11. http://doi.org/10.1145/2661229.2661262
Martin, G.; Bioucas-Dias, J.M. & Plaza, A. (2015). HYCA: A New Technique for Hyperspectral Compressive Sensing. IEEE Transactions on Geoscience and Remote Sensing, 53(5), 2819-2831. http://doi.org/10.1109/TGRS.2014.2365534
Mishne, G.; Talmon, R. & Cohen, I. (2015). Graph-based supervised automatic target detection. IEEE Transactions on Geoscience and Remote Sensing, 53(5), 2738-2754. http://doi.org/10.1109/TGRS.2014.2364333
Morteza, H. (2015). Reducing ADC Sampling Rate with Compressive Sensing. ArXiv Preprint arXiv:1503.00311, 1-8.
Nyquist, H. (1928). Certain Topics in Telegraph Transmission Theory. Transactions of the American Institute of Electrical Engineers,47, 617-644.
Ozturk, S.; Esin, Y.E. y Artan, Y. (2015). Object Detection in Rural Areas using Hyperspectral Imaging, 96432M. http://doi.org/10.1117/12.2195326
Soydan, H.; Koz, A.; Azebnem Düzgün, H. & Aydin Alatan, A. (2015). Hydrocarbon microseepage mapping using signature based target detection techniques. In SPIE Remote Sensing (pp. 964401-964401). International Society for Optics and Photonics. http://doi.org/10.1117/12.2195105
Velasco, A.C.; García, C.A. & Fuentes, H.A. (2016). Un estudio comparativo de algoritmos de detección de objetivos en imágenes hiperespectrales aplicados a cultivos agrícolas en Colombia. Revista Tecnura, 20(49), 86-99.
Wright, S.J.; Nowak, R.D. & Figueiredo, M.A.T. (2009). Sparse reconstruction by separable approximation. IEEE Transactions on Signal Processing, 57(7), 2479-2493.
Zare, A.; Bolton, J.; Chanussot, J. & Gader, P. (2014). Foreword to the Special Issue on Hyperspectral Image and Signal Processing. Selected Topics in Applied Earth Observations and Remote Sensing, IEEE Journal of, 7(6), 1841-1843. http://doi.org/10.1109/JSTARS.2014.2341811.
Licencia
Esta licencia permite a otros remezclar, adaptar y desarrollar su trabajo incluso con fines comerciales, siempre que le den crédito y concedan licencias para sus nuevas creaciones bajo los mismos términos. Esta licencia a menudo se compara con las licencias de software libre y de código abierto “copyleft”. Todos los trabajos nuevos basados en el tuyo tendrán la misma licencia, por lo que cualquier derivado también permitirá el uso comercial. Esta es la licencia utilizada por Wikipedia y se recomienda para materiales que se beneficiarían al incorporar contenido de Wikipedia y proyectos con licencias similares.

