DOI:
https://doi.org/10.14483/udistrital.jour.tecnura.2016.3.a06Publicado:
01-07-2016Número:
Vol. 20 Núm. 49 (2016): Julio - SeptiembreSección:
InvestigaciónA comparative study of target detection algorithms in hyperspectral imagery applied to agricultural crops in Colombia
Un estudio comparativo de algoritmos de detección de objetivos en imágenes hiperespectrales aplicados a cultivos agrícolas en Colombia
Palabras clave:
Hyperspectral Imaging, Remote Sensing, Spectral Properties of Vegetation, Target Detection Algorithms. (en).Palabras clave:
Algoritmo de Detección de Objetivos, Imágenes hiperespectrales, Propiedades Espectrales de la vegetación, Sensado Remoto (es).Descargas
Referencias
Armesto Arenas, A., Angarita, W., & Lobo Jácome, R. (2015). Efectos de la radiación electromagnética sobre la germinación del maíz. Tecnura, 19(45), 65-73.
Bioucas-Dias, J., Plaza, A., Camps-Valls, G., Scheunders, P., Nasrabadi, N., & Chanussot, J. (2013). Hyperspectral Remote Sensing Data Analysis and Future Challenges. IEEE Geoscience and remote sensing magazine, 6-36.
Céspedes, J. E. S., Avellaneda, J. C., & Henríquez, A. G. (2012). Diseño e implementación de un módulo de gestión de energía para un pico-satélite tipo CUBESAT. Revista Tecnura, 16, 55-67.
Chang, C.-I., Liu, J.-M., Chieu, B.-C., Ren, H., Wang, C.-M., Lo, C.-S., & Ma, D.-J. (2000). Generalized constrained energy minimization approach to subpixel target detection for multispectral imagery. Optical Engineering, 1275-1281.
Du, Q., Ren, H., & Chang, C.-I. (2003). A Comparative Study for Orthogonal Subspace Projection and Constrained Energy Minimization. IEEE Transactions On Geoscience And Remote Sensing, 1525-1529.
Jin, X., Paswaters, S., & Cline, H. (2009). A comparative study of target detection algorithms for hyperspectral imagery. In SPIE Defense, Security, and Sensing. International Society for Optics and Photonics. 73341W-73341W.
Kruse, F., Lefkoff, A., & Boardman, J. (1993). The spectral image processing system (SIPS) interactive visualization and analysis of imaging spectrometer data. Remote Sensing Environmental, 145-163.
Manolakis, D., & Shaw, G. (2002). Detection algorithms for hyperspectral imaging applications. Signal Processing Magazine, IEEE, 29-43.
Manolakis, D., Truslow, E., Pieper, M., Cooley, T., & Brueggeman , M. (2014). Detection Algorithms in Hyperspectral Imaging Systems. IEEE Signal Processing Magazine, 24-33.
Thenkabail, P. S., Smith, R., & De Pauw, E. (2000). Hyperspectral Vegetation Indices and Their Relationships with Agricultural Crop Characteristics. Remote Sensing Enviroment, 71, 158-182.
Velasco, A. C., García, C. A. V., Morales, F. A. R., Castelblanco, S. F. C., & Fuentes, H. A. (2015). Aplicaciones y retos del sensado remoto hiperespectral en la geología colombiana. Facultad de Ingeniería, 24(40), 17-29.
Ramirez, A., Arguello, H., Arce, G. R., & Sadler, B. M. (2014). Spectral image classification from optimal coded-aperture compressive measurements. Geoscience and Remote Sensing, IEEE Transactions on, 52(6), 3299-3309.
Cómo citar
APA
ACM
ACS
ABNT
Chicago
Harvard
IEEE
MLA
Turabian
Vancouver
Descargar cita
DOI: http://dx.doi.org/10.14483/udistrital.jour.tecnura.2016.3.a06
A comparative study of target detection algorithms in hyperspectral imagery applied to agricultural crops in Colombia
Un estudio comparativo de algoritmos de detección de objetivos en imágenes hiperespectrales aplicados a cultivos agrícolas en Colombia
Ariolfo Camacho Velasco1, César Augusto Vargas García2, Henry Arguello Fuentes3
1 System Engineer, Master in Computer and Informatics Engineering. Member of High Dimensional Signal Processing Research Group-HDSP Universidad Industrial de Santander, Bucaramanga, Colombia. Contact: ariolfo.camacho@correo.uis.edu.co
2 Computer Science Engineer, Master in Computer Science and Informatics, Student at doctorate in Electrical and Computer Engineering at University of Delaware, Newark, DE, United States. Contact: cavargar@udel.edu
3 Electrical engineer, Master in Electrical Power, Doctor in Electrical and Computer Engineering. Titular professor at Universidad Industrial de Santander, Bucaramanga, Colombia. Contact: henarfu@uis.edu.co
Fecha de recepción: 10 de noviembre de 2015 Fecha de aceptación: 15 de mayo de 2016
Cómo citar: Camacho Velasco, A., Vargas García, C. A., & Arguello Fuentes, H. (2016). A comparative study of target detection algorithms in hyperspectral imagery applied to agricultural crops in Colombia. Revista Tecnura, 20(49), 86-99. doi: 10.14483/udistrital.jour.tecnura.2016.3.a07
Abstract
Background: (HSI) Hyperspectral Images contain high spectral resolution information, in hundreds of contiguous bands over a specific range of the electromagnetic spectrum. In science and industry, hyperspectral information is exploited by means of classification, anomaly and target detections algorithms. Specifically, in the last two decades a wide variety of hyperspectral target detection algorithms have been proposed. However, an optimal target detection algorithm with a remarkable performance over different kinds of targets and scenarios is still an active matter of research, due to the high spectral variability and diversity of real-world scenarios.
Aim: This work presents a comparative study of target detection algorithms in hyperspectral imagery applied to agricultural crops in Colombia for evaluate performance in different scenarios.
Method: The evaluations were performed on 20 real HSI acquired by the satellite Hyperion sensor, and 6 synthetic HSI with different noise levels. 5 synthetic targets were implemented; more than 115 spectral real signatures were extracted, 11 of those signatures were used as target in the testing process, allowing to characterize 5 agricultural crops of Colombian northeastern in 5 different areas.
Results: The results show that the Adaptive Coherence Estimator (ACE) algorithm has a better performance in terms of detection probabilities PD > 90% for different scenarios and targets of agricultural type, in both synthetic and real images.
Conclusions: In applications for target detection in HSI, it is critical to find an algorithm to have optimal performance for different scenarios and targets, due to the spectral variability generated by the geographical conditions countrywide. On the other hand, this work shows that is possible the development of new research fields and applications at the national level, taking advantage of hyperspectral imaging techniques for spectral detection, specifically for Colombian agriculture.
Keywords: Hyperspectral Imaging, Remote Sensing, Spectral Properties of Vegetation, Target Detection Algorithms.
Resumen
Contexto: Las imágenes hiperespectrales (HSI) contienen información en alta resolución espectral, en cientos de bandas contiguas sobre un rango del espectro electromagnético. Se ha tomado ventaja de la información espectral mediante algoritmos de clasificación, detección de cambios, de anomalías o detección de objetivos. Específicamente, en las dos últimas décadas han sido propuestos diferentes algoritmos para detectar objetivos en HSI. Sin embargo, encontrar un algoritmo de detección con un desempeño óptimo para diferentes escenarios y objetivos, aún es materia de investigación, debido a la alta variabilidad espectral y diversidad de escenarios del mundo real.
Objetivo: La presente investigación realiza un estudio comparativo de algoritmos de detección de objetivos en imágenes hiperespectrales aplicados a la agricultura colombiana.
Método: Las evaluaciones se realizaron sobre 20 HSI reales adquiridas por el sensor satelital Hyperion y 6 HSI sintéticas con diferentes niveles de ruido. En el desarrollo de la investigación se implantaron 5 objetivos sintéticos; y se extrajeron más de 115 firmas espectrales reales, 11 de ellas fueron usadas como objetivo en la evaluación de los algoritmos, permitiendo la caracterización de 5 cultivos agrícolas del nororiente colombiano en 5 áreas de estudio diferentes. Los resultados muestran que el algoritmo de Estimación de Coherencia Adaptativo (ACE) presenta un mejor desempeño con probabilidades de detección PD > 90% para diferentes escenarios y objetivos de tipo agrícola, tanto en imágenes sintéticas como reales.
Conclusiones: En aplicaciones de detección de objetivos en HSI, es crítico encontrar un algoritmo que presente un rendimiento óptimo para diferentes escenarios y objetivos, debido a la variabilidad espectral generada por las diferentes condiciones geográficas de Colombia. Por otra parte, este trabajo permite mostrar que es posible realizar nuevas investigaciones y aplicaciones a nivel nacional tomando ventaja de las técnicas de imágenes hiperespectrales y algoritmos de detección espectral; específicamente en el sector de la agricultura colombiana.
Palabras Clave: Algoritmo de Detección de Objetivos, Imágenes hiperespectrales, Propiedades Espectrales de la vegetación, Sensado Remoto.
INTRODUCTION
Hyperspectral imaging (HSI) allows the spectral characterization of materials or vegetation present on the surface of the Earth (Manolakis & Shaw, 2002). A HSI has radiance or reflectance information of the surface, which can be modeled as a dispersion of points in a K-dimensional Euclidean space, where K is the number of spectral bands. Each band corresponds to a spatial axis. The axes are orthogonal to each other. Since each pixel in an HSI can be considered as a vector  , which behaves as a “fingerprint” or spectral signature of the material at a spatial point of the image. The spectral signature is an important element in classification, identification and target detection of algorithms (Ramírez, Arguello, Arce, & Sadler, 2014). The purpose of a detection algorithm in HSI is to detect a target within a HSI with the fewest false alarms (FA). During last decade, target detection algorithms have received a special interest in the scientific community (Bioucas-Dias, and other, 2013). However, a detection algorithm that performs optimally regardless different scenarios and targets, is still researched, due to the complexity and diversity of real-world scenarios. Likewise, the high spectral variability difficult to predict signature spectral target in situ.
Detection algorithms and HSI are used in areas such as environment monitoring, mining, geology, soil and vegetation cover characterization (Camacho, Vargas, Rojas, Castilllo & Arguello, 2015), specifically, in agriculture. Agriculture is an essential economic activity for humans. Optimal agricultural production requires precise measurements of biochemical and biophysical characteristics of crops. However, tasks such as mapping, monitoring, and data collection (on site) are expensive and consume large resources (costs, time, human, among others). The development of techniques such as remote sensing and optical spectroscopy allowed significant improvements in the estimation of biophysical or biochemical variables in crops. Specifically, in Colombia, it is important to have alternatives that allow acquiring information about the electromagnetic radiation that receives and reflects different crops (Armesto, Angarita, & Lobo, 2015). On the other hand, Colombia is doing research to enter in the space satellite with future developments. For instance, the construction of a picosatellite called the CubeSat UD Colombia 1 (Salamanca, Castro & Grajales, 2012), opening the development remote sensing applications. In particular, the use of hyperspectral images satellite has been widely used to study the spectral behavior of vegetation.
HSI measure the amount of energy reflected by the plants along the electromagnetic spectrum (400 nm - 2500 nm) (Thenkabail, Smith, & De Pauw, 2000). Spectral signatures of vegetation allows monitoring, tracking and controlling of crops health (stress by pests, diseases and nutrient deficiencies) for large lands. It is possible to detect targets in HSI of crops by using spectral signatures. However, targets and background have a high level of spectral variability in agriculture. Specifically, Colombia is an agricultural country which has geographical landscapes with many different characteristics, different ecosystems, geographical reliefs and weather conditions, allowing to cultivate different crops that allows the evaluate performance of detection algorithms for different scenarios and targets of agricultural type.
This work makes a comparative study of target detection algorithms in HSI applied to crops scenarios in Colombia from images acquired by hyperspectral satellite sensor Hyperion. The tested algorithms were: Adaptive Coherence Estimator - ACE (Manolakis & Shaw, 2002), Constrained Energy Minimization - CEM (Chang et al., 2000), Matched Filter-MF (Manolakis, Truslow, Pieper, Cooley, & Brueggeman , 2014; Bioucas-Dias et al., 2013), Orthogonal Subspace Projection-OSP (Du, Ren, & Chang, 2003), Spectral Angle Mapper - SAM (Kruse, Lefkoff, & Boardman, 1993). For the evaluation of the algorithms (ACE, CEM, MF, SAM and OSP), a data set with 20 real HSI was used; additionally, synthetic images were created with different levels of noise (SNR = 10 dB, 15 dB, 20 dB, 25 dB, and 30 dB); and 5 synthetic target were implanted. The synthetic target were created from the pure spectral signature of alunite mineral with different degrees of mixing (f= 10%, 20%, 30%, 40%, y 100%).
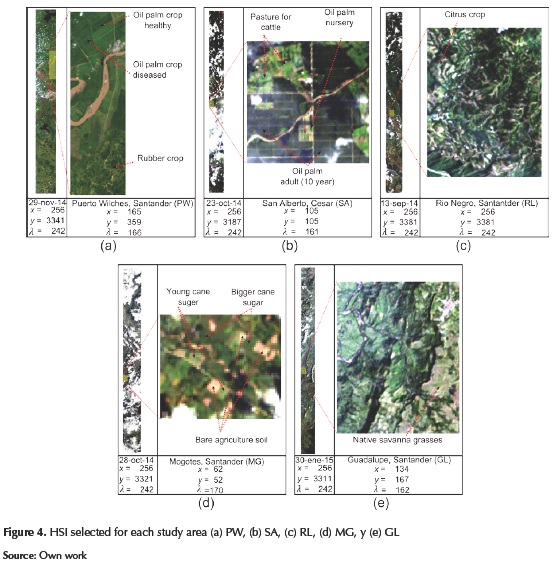
For the selection of spectral signatures procedure, more than 115 real spectral signatures were extracted, 11 of those signatures were used as target in the evaluation of algorithms, allowing the characterization of 5 crops of the Colombian northeast, including oil palm, rubber, grass for grazing, citrus and sugar cane. This research is one of the first to be developed from hyperspectral satellite images, applied to Colombian agriculture, and it is the first in Colombia performed by using the Hyperion sensor to evaluate the performance of detection algorithms with agricultural targets. For the acquisition of real HSI, it requested to the Goddard Space Flight Center-NASA taking HSI on a set of five municipalities in Colombia. Hyperion acquired HSI for the next five municipalities: Puerto Wilches (PW), Rio Negro-Lebrija (RL), Mogotes (MG) and Guadalupe (GL), located in the department of Santander, Colombia and San Alberto (SA), located in the department of Cesar, Colombia.
The results show that the ACE algorithm has a better performance with probabilities detection PD > 90% for diverse HSI and agricultural targets, in both synthetic and real images, followed by CEM and MF algorithms that exhibit acceptable performance with averages detection probabilities PD = 80%. In contrast, the OSP and SAM algorithms are able to detect targets with average PD = 45% however, the number of false alarms (FA) is high and their performance decreases. Finally, this work shows that from the technological and scientific transfer, the use and application of HSI and target detection algorithms, it is possible to research in Colombian crops under specific variables and geographical factors.
METHODOLOGY
This section describes the conceptual framework of detection algorithms, the metrics used to evaluate performance, and the real and synthetic data sets.
Target detection algorithms in hyperspectral imaging
A detection algorithm seeks to detect in the pixels of a hyperspectral data cube the presence of a specific material (target). Theoretically, a detection algorithm is considered a problem of binary hypothesis test, that determines whether a hypothesis about the presence of a target is true or not (Bioucas-Dias et al., 2013; Manolakis et al., 2014). Given an observed spectrum, the algorithm decides between the following two hypotheses:
Several target detection algorithms have develop to provide better results. However, according to the way of modeling the spectral variability problem, there are two approaches, geometric models and statistical models (Manolakis & Shaw, 2002). In this work were selected five algorithms with the biggest number of scientific citations, according to the state of the art detection algorithms, to make a comparative study of the algorithms performance. These algorithms are: ACE, CEM, MF, OSP, and SAM. In the first group of algorithms, are ACE, CEM and MF which describe the background patterns statistically, the second group, are describe the background geometrically, there are the OSP and SAM algorithms.
HSI detection algorithms must overcome difficulties such as: (1) the size of images, generally, the number of pixels of a hypercube exceeds the order of 105, with the limitation that the estimation of probability of false alarm PFA is less than 10-4 by each hypercube; (2) the number of target of a type or class, in particular, a scene is often very small and limits the detection performance; (3) the ground truth is very limited for the overall scene, hampering the validation; (4) the existence of mixed pixels (subpixel) a pixel observed by the sensor can receive information of the target and background; and (5) the high spectral variability, which is evidenced by the fact that a spectrum unique and fixed, theoretically perfect, does not exist for any material. The spectra observed from samples of the same material are not identical, even in laboratory experiments, due to variations in the surface of the material. The variability is significant in Remote Sensing (RS) due to the weather, noise of the sensor, the composition of the material, the location of the sensor and the sample, surrounding materials, and other factors.
Adaptive Coherence Estimator (ACE)
ACE is derived from The Generalised Likelihood Ratio Test (GLRT), based on the assumption that the background covariance matrix is known.
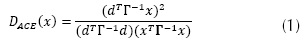
Where d is the target spectrum, x is the spectrum of the evaluated pixel, and Γ is the background covariance matrix. In equation (1) the ACE algorithm estimates detection statistics in a different way, and achieves a greater separation between target and background. In addition, ACE allows to set a constant threshold of PFA. ACE provides a faster detection of signature target based on comparisons between a spectral library signature, and the HSI spectral information. In previous study, the ACE algorithm has offered the best performance against the other algorithms (Manolakis & Shaw, 2002).
Constrained Energy Minimization (CEM)
CEM is a filter with finite impulse response that slice through the desired target and minimize the energy of the resulting output generated by the background with the exception of the desired target (Chang et al., 2000), equation (2) describes the CEM algorithm. The covariance of the correlation matrix is used to characterize the composition of the unknown background.
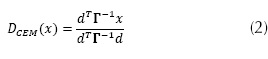
where d is the target spectrum, x is the spectrum of the pixel to be evaluated, and Γ is the background covariance or the correlation matrix. CEM belongs to the algorithms based on a structured approach which uses statistics to describe the background, for this reason it is included in this paper.
Matched Filter (MF)
The Matched Filter and its different variations have been widely used in applications for targets detection in HSI (Manolakis, Truslow, Pieper, Cooley, & Brueggeman, 2014), equation (3.a and 3.b) describes the MF algorithm. MF is based on the binary hypothesis test.
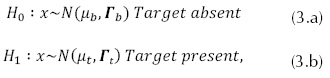
If it is assumed that the two hypotheses have equal covariance matrix, Γb = Γt = Γ, and that the selection of the normalization factor does not affect the performance of the MF. MF method uses the equation (4).
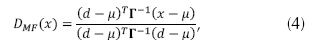
Where d is the target spectrum, x is the spectrum of the evaluated background pixel, u is the vector containing the mean background, and Γ is the covariance matrix.
Orthogonal Subspace Projection (OSP)
OSP algorithm is the first designed a projector of orthogonal subspace to delete the response pixels non-targets, then, apply a filter of matched to find the match of the desired target within data. OSP is expressed in equation (5).
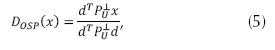
Where d is the vector of spectrum target, x is the pixel to be evaluated, and 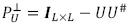 is the orthogonal subspace, such that L is the number of bands, U is the matrix of spectra non-target, and
  is the pseudoinverse of U (Jin, Paswaters, & Cline, 2009). The OSP is an algorithm that uses a structured background model to characterize the spectral variability and it is the first geometric filter matched algorithm different from the previous algorithms used in this research.
Spectral Angle Mapper (SAM)
SAM is an algorithm used to determine how similar are two spectra, from the calculation of the angle between two vectors (target vector and pixel evaluate vector). The SAM algorithm has lower computational complexity, lower computational cost, and it is faster than the other algorithms described above. It also does not require any statistical information from the scene (Kruse, Lefkoff, & Boardman, 1993). Any pixel in the HSI is treated as a vector with dimensionality equal to the number of bands of the HSI. SAM may also be performed by matrix multiplication and is expressed in equation (6) as
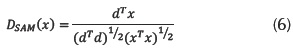
SAM is included in this work as a traditional algorithm, it is compared with more robust algorithms.
Performance metrics for target detection algorithms in HSI
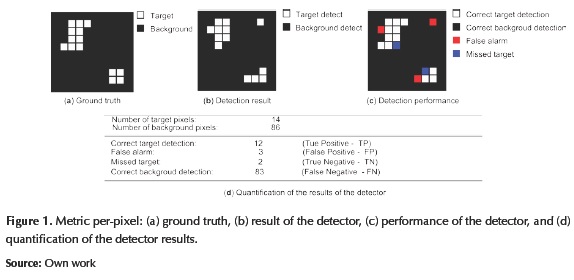
There are different metrics to evaluate the performance of the algorithms of target detection, such as visual metrics, per pixel, confusion matrices, and ROC curves (Operational Characterization of the Receiver). The visual metric is a graphical representation in two dimensions (x, y) the result of the detection algorithm. The representation shows a detection map where the brighter pixels (whites) corresponding to possible targets. The brightest outputs can be compared with the ground truth map to determine if the pixel was correctly classified as a target, otherwise it is a false alarm. The pixel-per-pixel metric puts a label to each pixel as a target or background (background refers to any pixel located in a scene that is non-target) for each output of the detector. This metric is simple and allows to quantify the performance of algorithms based on creating binary confusion matrix, it is composed of true positives (TP), false positives (FP), true negative (TN), and false negatives (FN). From these matrices, true positive rate (VPR), false positive rate (FPR) and accuracy (ACC) can be estimated and related. Figure 1 illustrates the performance of an algorithm evaluated pixel-per-pixel. For a total of 100 pixels, Figure 1(a) shows the ground truth where the target is formed by 14 pixels, Figure 1(b) shows the result of the algorithm, and Figure 1(c) classifies each pixel output detector, allowing to quantify and give inputs for confusion matrices.
Finally, the most commonly used metric in the scientific community to evaluate the performance of target detection algorithms are the ROC curves. ROC curves plot the relationship between the probability of detection (PD) of the target and the probability of false alarm (PFA), thus determining the performance of an algorithm. An optimal algorithm is one that manages to detect targets with high PD and low PFA.
Data sets
Hyperspectral Imaging Data and Ground Truth
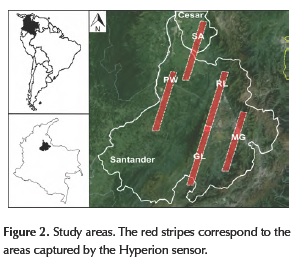
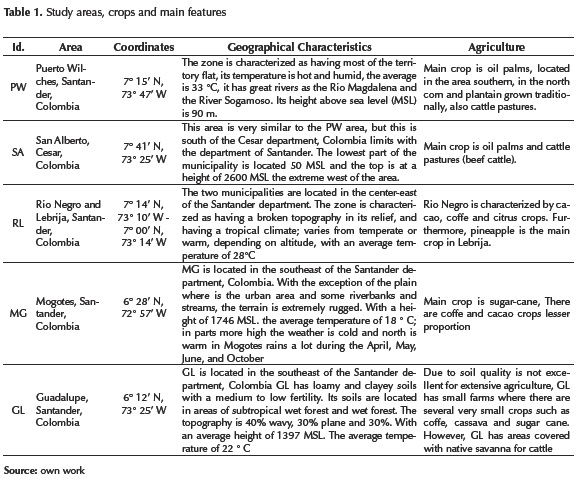
For the development of this research the Hyperion sensor acquired 20 real hyperspectral images between February 2014 and February 2015. The HSI were acquired on five municipalities located in the northeast of Colombia, specifically in the Santander and Cesar departments. These Colombian regions have different climatic and geographical characteristics, allowing acquire spectral information of various agricultural crops in different scenarios. Figure 2 shows the location of the study areas and Table 1 summarizes the characteristics and main agricultural crops present in the study areas.
Synthetic data set and implementation fractionated targets
In order to have different criteria for evaluating performance of the algorithms in this study, synthetic target were created from the pure spectral signature of alunite with various degrees of mixture (f= 10%, 20%, 30%, 40%, y 100%). Alunite is a mineral which is not present in the study areas and their spectral signature differs from the signatures of agricultural target used in this research. Additionally, to simulate the behavior of the algorithms to real operating conditions of the system, white Gaussian noise was added. Finally, one synthetic HSI noiseless and 5 synthetic HSI with different noise level were created with 10 dB, 15 dB, 20 dB, 25 dB and 30 dB. The noise being measured in terms of signal-to-noise ratio (SNR), the SNR corresponds to the rate of the signal energy over noise energy, mathematically defined as  , the SNR can be expressed in decibels
 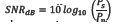 .
.
The method used for the creation and implementation of targets within a HSI is based on creating a new target pixel dimp formed by a background fraction f and synthetic spectral signature fraction f implement, the implant pixel is expressed in equation (7).
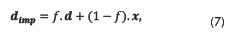
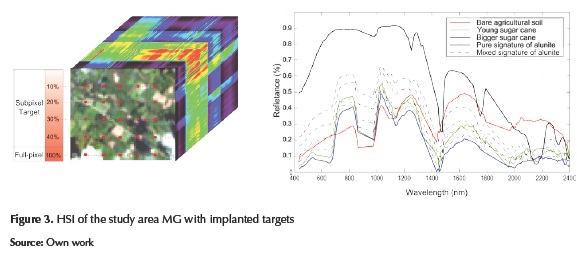
Where d is k x 1 vector, it contains pure spectral signature alunite, its abundance varies from a fraction f, and mixed with the spectral signature of background x. In HSI, a 5 x 5 target grid with different implanted fraction f = 0.1 (10%), f = 0.2 (20%), f = 0.3 (30%), f = 0.4 (40%), and f = 1 (100%) is generated for sub-píxel and full-pixel target. Figure 3 shows the location of each implanted fraction f, in each target, similarly, shows the main firms within the HSI.
Extraction of spectral signatures and target to detect in real HSI
115 spectral signatures were extracted from HSI real data set, 11 were used as target in the experiments assessment of the algorithms. The data set covers five crops of northeast Colombia (african oil palm, rubber, pastures cattle farming, citrus and sugar cane). The spectral variability affects the extraction of the spectral signatures. In order to avoid spectral variability, 15 spectral signatures were taken from each selected crop HSI or subarea. Through the determination coefficient R2 estimate each signature spectral with respect to the average for all signatures, were removed the signatures spectral with lower R2. Finally, 11 signatures are used as targets in the comparison of five detection algorithms.
RESULTS
Five target detection algorithms are compared in the experiments, using synthetic and real datasets. From the 20 images acquired by Hyperion, five were selected for the simulations, one for each area of study, shown in Figure 4. The results are analyzed and discussed by using different metrics, described in section 2.2. First, the results obtained with the synthetic data set are shown and then the results from the real data set.
Results with synthetic data
Results for noise-free synthetic data for implanted target detection
Implantation of targets with different levels of mixture allows target detection algorithms to identify two types of targets. Sub-pixel targets for fractions ƒ = 0.1, 0.2, 0.3 and 0.4, and full-pixel target for fractions of ƒ = 1, ROC curves were used to evaluate the target detection performance. Figures 5 (a)-(d) show the ROC curves of the detection results, with a mix levels for sub-pixel targets. The algorithms ACE, CEM and MF achieve the best performance increasing the PD rate a 10% as the ƒ target mixing level increases. ACE had the best performance with a PD > 95% for all mixing levels.
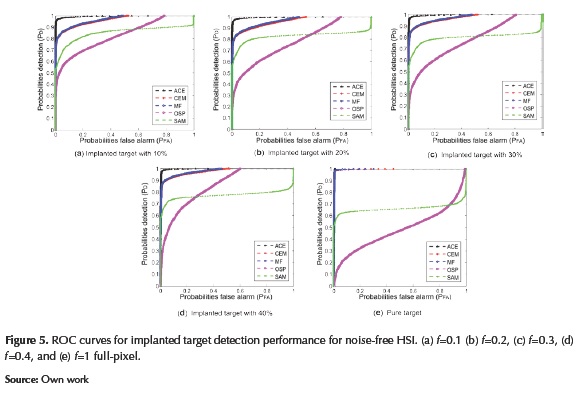
Figure 5(e) shows the results for algorithms detecting full-pixel targets. The ACE, CEM and MF detect all the targets with a PD superior than 98%, and the ACE with a PD of 99.8%.
Results with synthetic noise data
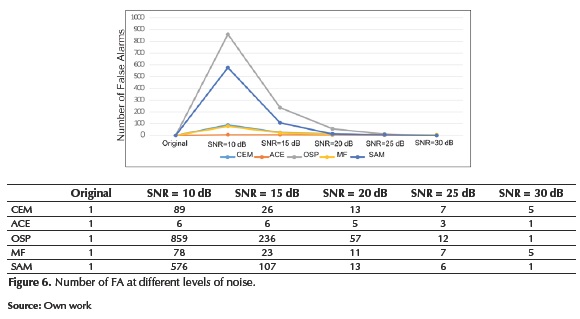
Comparisons show that the performance of the algorithms is affected as the noise level increases. However, for sub-pixel targets the performance is stabilized with SNR ≥ 25 dB and full-pixel targets performance is affected only for SNR values lower than 20 dB. The algorithm with better performance using synthetic data, varying noise levels and signature abundance fraction is the ACE. However, the SAM algorithm has a stable behavior with SNR values exceeding 15 dB. SAM is not sensitive to the noise generated by spectral variability (shades or variations in brightness) because SAM depends only on the spectral shape of the target and it is independent of the magnitude differences between the target and the background pixels. Another comparison with synthetic data, evaluated the performance of algorithms in terms of number of FA to different levels of SNR. Results are compared against the algorithms than detect the target with only one false alarm on the noise-free HSI. Figure 6 validates the results obtained by the ROC curves, for SNR = 10 dB where ACE achieves the best performance obtained a FA = 6, in contrast the SAM and OSP algorithms have the lowest performance with FA = 859 and FA = 576, respectively.
Results with real data
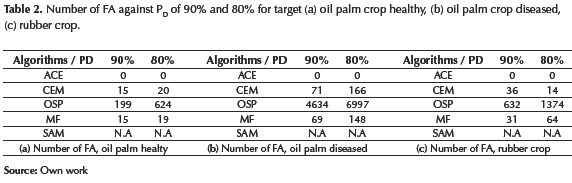
Performance result of target detection algorithms on real data showed that crops with a homogeneous behavior (similarity in height, state of the crop, foliage, etc.), such as African oil palm for the study area PW and SA, and sugar cane for MG, have a lower spectral variability, thus, allow better performance of all algorithms. However, when the diseased african oil palm crops target is detected in PW, it is observed that the PD the CEM, OSP and SAM algorithms decreases below 40%, due to the high spectral variability of diseased crops. Another criterion for evaluating the performance of the algorithms in the study area PW was to quantify the number of FA to rates of PD 80% and 90%. Table 2 shows the results validating the behavior observed in the outputs of the algorithms and ROC curves. Likewise is observed the large number of FA generated in the OSP algorithm to attempt to detect diseased palm plantations, OSP with a PD = 90% obtained 4.654 FA. Similarly, the superiority of ACE algorithm is observed with a number FA=0.
The study area SA is similar to PW, the 80% of SA has territories with large flat areas cultivated with oil palm and pasture for cattle ranching. For SA, the algorithms were evaluated with a detection threshold based on the lowest output response between the pixels that make up the target. For the experiment, a map of ground truth was created taking advantage of the existence of an oil palm nursery located in the center of the scene, the nursery was selected as target and corresponds to 10 pixels in the HSI. Figure 7(a) shows the ground truth and target location; Figures 7(b)-(f) show the responses of each algorithm and confusion matrices.
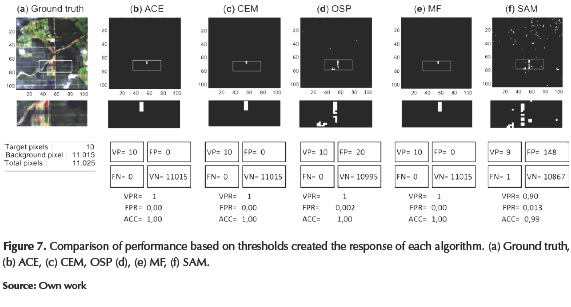
In general the results show that ACE, CEM, and MF algorive optimum performance with accuracies ACC=1, in contrast, the OSP and SAM algorithms that are able to detect the target, however, the number of FP (false positive or false alarms) is 20 and 148, respectively, this makes the false positive rate (FPR) increases and performance decreases.
On the other hand, the studied areas RL, MG and GL are opposed to PW and SA for containing a mountainous geography and temperate and cold climates, allowing the growth of crops such as citrus, coffee, cocoa and sugar cane. However, the comparison process for algorithms in MG and GL had three limiting factors: (1) High clouds in the days of image acquisition, (2) the type of traditional agriculture with smaller crops because much of the farms or cultivated land are smallholdings or farms where be more than five different crops grown in confined spaces. However, in RL there are areas of medium size with citrus crops, for MG a valley with large surface cultivated of sugar cane in different stages of development and growth was selected, in GL there are only few continuous and large areas used for agricultural purposes, these corresponds to native savanna grasses, dedicated to raising cattle, and the shadows generated by mountains on the scene and high clouds are a constraint that generates high spectral variability in the target.
It is observed that geography and size of the areas cultivate in RL, MG and GL directly affect the performance of target detection algorithms. The results showed that the algorithms have lower performance, decreasing PD in 30%, when they are evaluated in mountainous areas and crops of small extension scenes.
Finally, the results show that the ACE algorithm has the best performance for different HSI and targets, both synthetic HSI and real HSI with PD ≥ 90%, CEM and MF algorithms have an acceptable behavior with average of PD = 75% In an opposite way, SAM and OSP algorithms have the lowest performance, with values of PD ≤ 40%, SAM and OSP are able to detect the target, however, the number of FA is high, decreasing their performance.
CONCLUSIONS
In applications for target detection in HSI, it is critical to find an algorithm to have optimal performance for different scenarios and targets. This research is conducted on five scenarios with different geographies and climates characteristic of northeastern Colombia, allowing to compare the performance of the algorithms ACE, CEM, OSP, MF and SAM for target of agricultural type. Results show that the algorithms have a better performance when they run on scenes that have flat areas, large surfaces, and equal targets (eg. Oil palm plantation in PW and SA, sugar cane crops in MG), the conditions as mentioned above allow to have homogeneous and shadows free scenes, therefore this spectral variability decreases and target detection algorithms performance increase with a PD gain of 30%. The ACE algorithm has the best performance for different HSI and targets, both synthetic HSI and real HSI with PD ≥ 90 %, due to the ACE algorithm being the one that best models the spectral variability of background and target. Additionally, it is possible to obtain a data set of real hyperspectral images of Colombian territory for introduction, appropriation, and research on the use and application of HSI in agriculture, allowing the development of new research fields, processes, and applications at national level; specifically in agricultural crops under variables and factors exclusive of Colombian agriculture and geography.
FINANCING
This work was partially supported by the Universidad Industrial de Santander of Bucaramanga under Grant No. 1802 of April, 2015.
BIBLIOGRAPHY
Armesto Arenas, A., Angarita, W., & Lobo Jácome, R. (2015). Efectos de la radiación electromagnética sobre la germinación del maíz. Tecnura, 19(45), 65-73.
Bioucas-Dias, J., Plaza, A., Camps-Valls, G., Scheunders, P., Nasrabadi, N., & Chanussot, J. (2013). Hyperspectral Remote Sensing Data Analysis and Future Challenges. IEEE Geoscience and remote sensing magazine, 6-36.
Céspedes, J. E. S., Avellaneda, J. C., & Henríquez, A. G. (2012). Diseño e implementación de un módulo de gestión de energía para un pico-satélite tipo CUBESAT. Revista Tecnura, 16, 55-67.
Chang, C.-I., Liu, J.-M., Chieu, B.-C., Ren, H., Wang, C.-M., Lo, C.-S., & Ma, D.-J. (2000). Generalized constrained energy minimization approach to subpixel target detection for multispectral imagery. Optical Engineering, 1275-1281.
Du, Q., Ren, H., & Chang, C.-I. (2003). A Comparative Study for Orthogonal Subspace Projection and Constrained Energy Minimization. IEEE Transactions On Geoscience And Remote Sensing, 1525-1529.
Jin, X., Paswaters, S., & Cline, H. (2009). A comparative study of target detection algorithms for hyperspectral imagery. In SPIE Defense, Security, and Sensing. International Society for Optics and Photonics. 73341W-73341W.
Kruse, F., Lefkoff, A., & Boardman, J. (1993). The spectral image processing system (SIPS) interactive visualization and analysis of imaging spectrometer data. Remote Sensing Environmental, 145-163.
Manolakis, D., & Shaw, G. (2002). Detection algorithms for hyperspectral imaging applications. Signal Processing Magazine, IEEE, 29-43.
Manolakis, D., Truslow, E., Pieper, M., Cooley, T., & Brueggeman , M. (2014). Detection Algorithms in Hyperspectral Imaging Systems. IEEE Signal Processing Magazine, 24-33.
Thenkabail, P. S., Smith, R., & De Pauw, E. (2000). Hyperspectral Vegetation Indices and Their Relationships with Agricultural Crop Characteristics. Remote Sensing Enviroment, 71, 158-182.
Velasco, A. C., García, C. A. V., Morales, F. A. R., Castelblanco, S. F. C., & Fuentes, H. A. (2015). Aplicaciones y retos del sensado remoto hiperespectral en la geología colombiana. Facultad de Ingeniería, 24(40), 17-29.
Ramirez, A., Arguello, H., Arce, G. R., & Sadler, B. M. (2014). Spectral image classification from optimal coded-aperture compressive measurements. Geoscience and Remote Sensing, IEEE Transactions on, 52(6), 3299-3309.
Licencia
Esta licencia permite a otros remezclar, adaptar y desarrollar su trabajo incluso con fines comerciales, siempre que le den crédito y concedan licencias para sus nuevas creaciones bajo los mismos términos. Esta licencia a menudo se compara con las licencias de software libre y de código abierto “copyleft”. Todos los trabajos nuevos basados en el tuyo tendrán la misma licencia, por lo que cualquier derivado también permitirá el uso comercial. Esta es la licencia utilizada por Wikipedia y se recomienda para materiales que se beneficiarían al incorporar contenido de Wikipedia y proyectos con licencias similares.