
DOI:
https://doi.org/10.14483/22487638.15897Published:
2021-01-01Issue:
Vol. 25 No. 67 (2021): January - MarchSection:
ResearchUse of the Speed of Sound for Heights Below the Troposphere in Colombia to Determine the Distance of Lightning Strikes
Velocidad del sonido para alturas menores a la troposfera en Colombia para determinar la distancia de impacto de un rayo
Keywords:
altitud, estaciones meteorológicas, estadística geoespacial, humedad relativa, país tropical, patrones puntuales, rayo, temperatura, tropósfera, trueno (es).Keywords:
altitude, geospatial statistics , lightning, meteorological stations, point patterns, relative humidity, temperature, thunder, tropical country, troposphere (en).Downloads
References
ArcGIS. (2018). picos mas altos de colombia. Recuperado el 5 de 9 de 2019, de https://www.arcgis.com/apps/MapTour/index.html?appid=554ffe69b69e4fae88aa2b8351c721fb
Buhmann, M. D. (2000). Radial basis functions. Acta numerica, 9, 1-38. https://doi.org/10.1017/S0962492900000015 DOI: https://doi.org/10.1017/S0962492900000015
Del-Rio, D. F., Younes, C., & Pulgarín, J. D. (2017). Lightning activity over large cities located in mountainous tropical zone and its relationship with particulate matter PM10 distribution. Bogotá City Case. Revista Facultad de Ingeniería(82), 22-30. https://doi.org/10.17533/udea.redin.n82a03 DOI: https://doi.org/10.17533/udea.redin.n82a03
Eliakim, I. (2014). SONAR BASED SLAMC (Simultaneous Localization, Mapping and Classification). Tel Aviv: Tel Aviv University.
Hahn, M., Cruz, F., & Carvalho, P. (2019). Determining the Speed of Sound as a Function of Temperature Using Arduino. The Physics Teacher, 57(2), 114-115. https://doi.org/10.1119/1.5088475 DOI: https://doi.org/10.1119/1.5088475
Hass, J. (2017). Chapter One: An Acoustics Primer. (Indiana University) Recuperado el 2 de October de 2018, de http://www.indiana.edu/~emusic/etext/acoustics/chapter1_speed.shtml
Hurtado M. , G. (2015). ANÁLISIS DEL COMPORTAMIENTO PROMEDIO Y TENDENCIAS DE LARGO PLAZO DE LA TEMPERATURA MÁXIMA MEDIA PARA LAS REGIONES HIDROCLIMÁTICAS DE COLOMBIA. Bogotá: Instituto de Hidrología, Meteorología y Estudios Ambientales.
IDEAM. (2007). Estudio de la caracterización climática de Bogotá y cuenta alta del río Tunjelo. Recuperado el 10 de 7 de 2019, de http://www.ideam.gov.co/documents/21021/21135/CARACTERIZACION+CLIMATICA+BOGOTA.pdf/d7e42ed8-a6ef-4a62-b38f-f36f58db29aa
Instituto de Hidrología, Meteorología y Estudios Ambientales. (2011). Atlas IDEAM. Recuperado el 4 de 8 de 2019, de http://atlas.ideam.gov.co/basefiles/temperaturamedia_tabla.pdf
Instituto de Hidrología, Meteorología y Estudios Ambientales. (2015). Clima y temperatura . (IDEAM) Recuperado el 3 de 9 de 2019, de http://www.ideam.gov.co/web/tiempo-y-clima/clima
Instituto de Hidrología, Meteorología y Estudios Ambientales. (2011). Humidity relative. Recuperado el 1 de 9 de 2019, de http://atlas.ideam.gov.co/basefiles/HR_Anual.pdf
Instituto de Hidrología, Meteorología y Estudios Ambientales. (2011). Temperature. Recuperado el 1 de 9 de 2019, de http://atlas.ideam.gov.co/basefiles/Temp_Med_Anual.pdf
Instituto Geográfico Agustín Codazzi . (2005). Mapa Físico - Político. Recuperado el 1 de 9 de 2019, de http://www2.igac.gov.co/ninos/UserFiles/Image/Mapas/mapafisico.pdf
Mustafa Cavcar. (2008). The International Standard Atmosphere (ISA). Eskisehir: Anadolu University. Obtenido de http://fisicaatmo.at.fcen.uba.ar/practicas/ISAweb.pdf
National Aeronautics and Space Administration. (2018). Earth Atmosphere Model. (NASA) Recuperado el 1 de September de 2018, de https://www.grc.nasa.gov/www/k-12/airplane/atmos.html
Shevick, E. (2000). Sound & light, hadns-on science activities ready for student use. Dayton: Teaching & learning company.
Stančík, D. (2003). New endemic taxa of Festuca from the Colombian Sierra Nevada de Santa Marta. Preslia, The Journal of the Czech Botanical Society, 339–347.
Thedoridis, S. a. (1998). Pattern Recognition. En S. a. Thedoridis, Pattern Recognition (third ed.). London: Academic Press.
whitworth near space. (8 de August de 2012). Ozone and UV Light. Obtenido de http://www.whitworthnearspace.org/wiki/Ozone_and_UV_Light
Wilhelm van-Schaik, M. G. (2010). High Accuracy Acoustic Relative Humidity Measurement in Duct Flow with Air. Sensors, 7434. https://doi.org/10.3390/s100807421 DOI: https://doi.org/10.3390/s100807421
How to Cite
APA
ACM
ACS
ABNT
Chicago
Harvard
IEEE
MLA
Turabian
Vancouver
Download Citation
Recibido: 20 de mayo de 2020; Aceptado: 3 de noviembre de 2020
Abstract
Objective:
This paper aims to conduct a study of the speed of sound in Colombia for heights below the troposphere, taking into account the temperature as a function of altitude for a tropical zone, in order to determine the distance of lightning strike.
Methodology:
A speed of sound profile for Colombia was determined by analyzing data on altitude, temperature, and relative humidity in the country. The temperature equation as a function of altitude presented by NASA and the International Standard Atmosphere was taken into account to compare with the data obtained from meteorological stations located in different parts of the country (this stations measure information of temperature and other physical variables). Additionally, a sound profile map of Colombia was obtained using the interpolation in ArcGIS software.
Results:
A map of the speed of sound in Colombia was obtained, thus finding the speed range in the country. Likewise, the temperature was determined as function of the altitude for Colombia (a country in the tropical zone), with which it is possible to have data closer to the real speed of sound in the place and determinate the distance of impact of a lighting in land.
Conclusions:
The study of variables such as temperature, relative humidity, and altitude helped determine the speed of sound for Colombia. It was also possible to define a temperature equation as a function of altitude for a tropical country; with the speed of sound, the radius of impact of a lightning can be found.
Keywords:
altitude, geospatial statistics, lightning, meteorological stations, point patterns, relative humidity, temperature, thunder, tropical country, troposphere..Resumen
Objetivo:
Realizar un estudio de la velocidad del sonido en Colombia para alturas menores a la troposfera, teniendo en cuenta la temperatura en función de la altitud para una zona tropical, con el fin de ayudar a determinar la distancia de impacto de un rayo.
Metodología:
Se determinó un perfil de la velocidad del sonido para Colombia, analizando datos de altitud, temperatura y humedad relativa en el país. Se tuvo en cuenta la ecuación de temperatura en función de la altitud presentada por la NASA y la International Standard Atmosphere, para luego comparar con los datos obtenidos por las estaciones meteorológicas localizadas en diferentes lugares del país; estas estaciones miden temperatura y otras variables físicas. Adicionalmente se obtuvo un mapa de perfil de sonido en Colombia usando interpolación en el software ArcGIS.
Resultados:
Se obtuvo un mapa de la velocidad del sonido en Colombia, obteniendo así el rango de velocidad en el país; asimismo se determinó la temperatura como función de la altitud para Colombia (un país ubicado en la zona tropical), con lo cual se puede tener un dato más cercano a la velocidad real del sonido en el lugar y determinar la distancia de impacto de un rayo en tierra.
Conclusiones:
El estudio de variables como temperatura, humedad relativa y altitud, ayudaron a determinar la velocidad del sonido para Colombia. También fue posible determinar una ecuación de temperatura en función de la altitud para un país tropical; por lo tanto, con la velocidad del sonido se puede encontrar el radio de impacto de un rayo.
Palabras clave:
altitud, estaciones meteorológicas, estadística geoespacial, humedad relativa, país tropical, patrones puntuales, rayo, temperatura, tropósfera, trueno..INTRODUCTION
Colombia is a country located in the tropical zone (Del-Rio, Younes, & Pulgarín, 2017), and its altitudes range from sea level and its highest point at 5775 meters (Stančík, 2003). Colombia has 39 meteorological stations located in different places of the country (Instituto de Hidrología, Meteorología y Estudios Ambientales), which belong to the IDEAM (acronym in Spanish for Institute of hydrology, meteorology, and environmental studies), who is responsible of managing the data of climate in Colombia. Within their Website, the IDEAM has data of temperature, weather, relative humidity, altitude, latitude, contamination, environmental quality, and other related variables. Also, it is possible to find in literature different methods for determining the approximate position where a lightning strikes, which mainly refer to observing the lightning and measuring the time until the thunder rings in order to calculate the place of impact (Shevick, 2000). Once this time lapse is registered, this number and the speed of sound can be used to determine the lightning’s distance from the observer.
Now in order to use this method we need to know the speed of sound. And, since the speed of sound is variable and change depending on the altitude and relative humidity of a place (Wilhelm van-Schaik, 2010), the exact location in the country is needed to have all the variables used in the calculations on lightning impact distance. Therefore, we took the data of temperature and relative humidity from the meteorological stations located in the country to find the relationship between these variables and the speed of sound in different places of Colombia.
METODOLOGY
Altitude Variability
The altitude in Colombia varies between 0 and 5775 meters above sea level: the highest place is located in Sierra Nevada de Santa Marta in the place known as Pico Colon (ArcGIS, 2018). Figure 1 shows the map of altitude in Colombia.
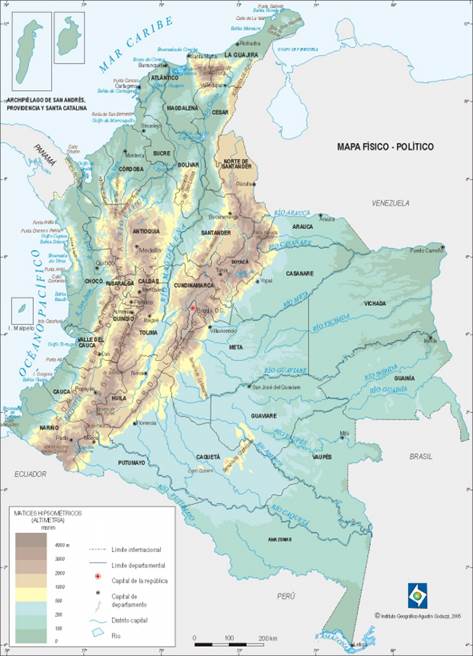
Figure 1: Map of altitudes in Colombia
Figure 1 illustrates the map of altitudes of Colombia and shows the differences in altitude throughout regions, which will modify the speed of sound; therefore, altitude is an important factor that has to be considered when calculating the speed of sound in Colombia.
Temperature Differences
In Colombia, the temperature is variable and depends on factors such as the altitude, resulting in diverse climates-values from -8 degrees Celsius up to approximately 45 degrees Celsius may be present; (Instituto de Hidrología, Meteorología y Estudios Ambientales, 2015), (Hurtado M, 2015). Figure 2 shows the variability in temperature throughout Colombia.
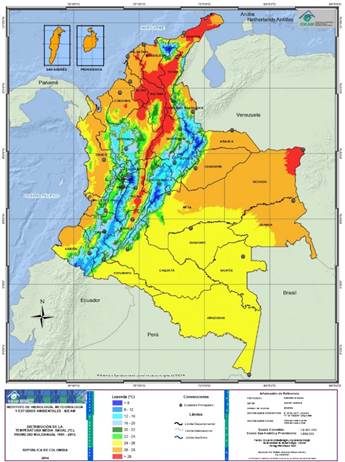
Figure 2: Map of Temperatures in Colombia
This variability in temperature through the country also affects the speed of sound, so it will not be constant throughout the whole territory. Hence, we can affirm that the speed of sound always depends on the ambient temperature. (Hahn, Cruz, & Carvalho, 2019)
Relative Humidity
Conversely, relative humidity does not directly depend on altitude although it might be slightly related to the temperature. However, relative humidity does have a direct correlation to the surrounding vegetation or sources of water (IDEAM), so humidity will rise in a place close to a river, wetland or lagoon, or with rich vegetation, while somewhere with less water bodies will be less humid. Besides, the tropical zone is a region with low-pressure, which will also produce high relative humidity as well as storms.
According to the map shown in Figure 3, the relative humidity in Colombia varies depending on the place. The zones located South and West of the country (the regions of Amazonas, Caquetá, Putumayo, Vaupes, and Chocó) have more plants, trees, rivers, and wetlands and have values between 85 and 95% of relative humidity. On the other hand, zones located East of the country have higher density of forests and have a relative humidity that varies from 75 and 85% (the map shows these zones in green). Finally, the region called “La Guajira” is mostly desertic and has the lowest relative humidity values.
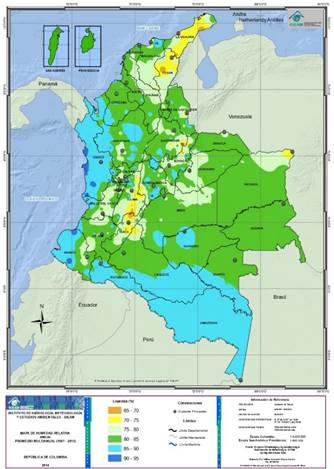
Figure 3: Map of relative humidity in Colombia
Meteorological Stations in Colombia
The IDEAM has 39 meteorological stations, located in different places with different altitudes (0 - 3000 meters) throughout the country. Table 1 shows the list of each station and its altitude (the table lists only 38 stations; the station #39 is located in San Andres Island, which was not considered during this research).
Source: Adapted table from (Instituto de Hidrología, Meteorología y Estudios Ambientales, 2011)
Table 1: Meteorological stations in Colombia.
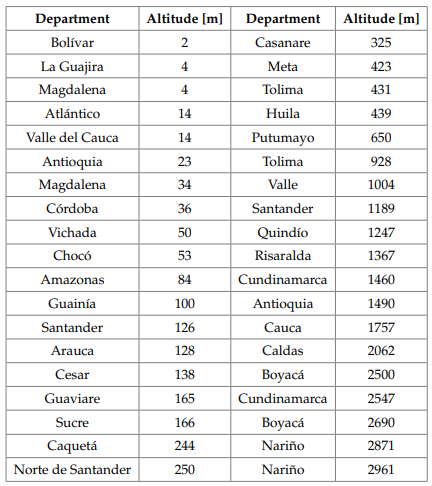
Figure 4 shows each meteorological station located in the country. As stated before, each station is located at a different altitude, latitude, and longitude and stores temperature, relative humidity, altitude, atmospheric pression, and other data.
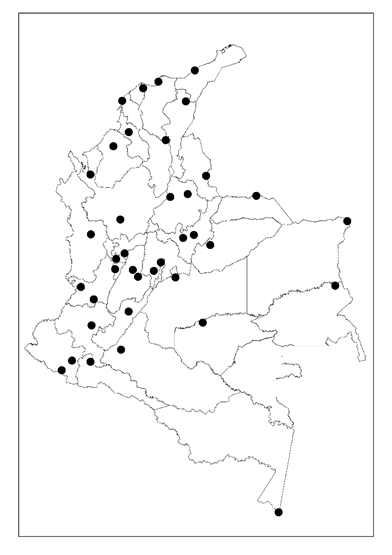
Figure 4: Meteorological stations in Colombia
Relationship Between Speed of Sound, Relative Humidity and Temperature
According to the information provided by these stations, there is a direct correlation between the relative humidity and temperature of a place and the speed of sound in said place. Figure 5 shows this behavior.
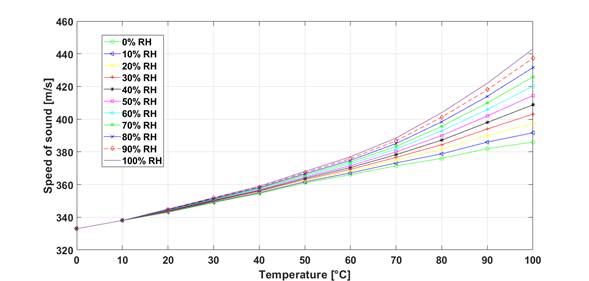
Figure 5: Speed of sound relative to temperature and relative humidity
These values are included in the article ‘High Accuracy Acoustic Relative Humidity Measurement in Duct Flow with Air’ (Wilhelm van-Schaik, 2010) were performed in a laboratory controlling conditions of temperature and relative humidity. These results show that the higher the temperature and relative humidity, the higher the speed of sound.
RESULTS
Comparison Between Temperature as Dependent to Altitude
The International Standard Atmosphere (ISA) models the temperature profile for changes of temperature in the atmosphere (Figure 6). The behavior of temperature at tropospheric level is linear, and the temperature at the sea level is 15 °C for the ISA model.
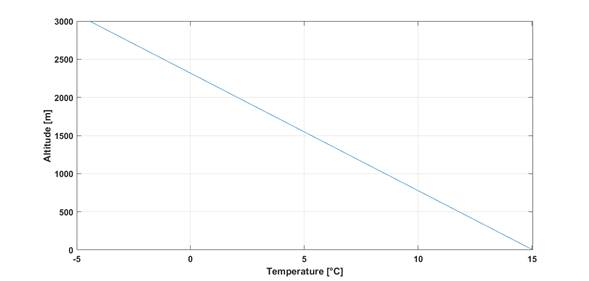
Figure 6: Altitude vs. Temperature
This graph shows a behavior similar to that resulting from data from the NASA (model shown in Figure 7). The graph presents the temperature as function of the altitude for each layer of the atmosphere: troposphere, stratosphere, mesosphere, and thermosphere, although our study is focused only on the troposphere, i.e., between 0 and 10 km. According to data from NASA, there also exists a linear behavior that follows the equation below (National Aeronautics and Space Administration, 2018):
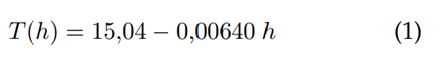
Where T is the temperature in degrees Celsius (°C), and ℎ is the altitude in meters (m).
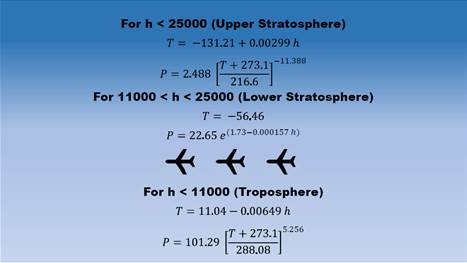
Figure 7: Altitude vs. Temperature.
Applying equation (1) from NASA and using the IDEAM data regarding temperature [°C] and altitude [m] for each meteorological station, the trend shown in Figure 8 results.
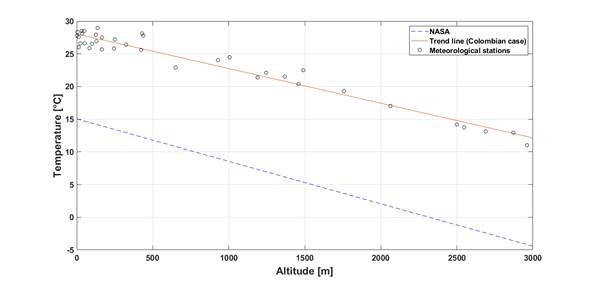
Figure 8: Temperature vs. Altitude. Comparison between NASA equation and data obtained from meteorological stations in Colombia
Figure 8 shows the equation from NASA in a blue dashed line; the average temperature taken from each meteorological station in Colombia is represented with small circles, and the trend of these values is drawn as a continuous red line (the correlation coefficient r 2 of 0.954 and uncertainty of linear terms was Δa = 1.92 x 10⁻⁴ and Δb = 2.32 x 10⁻¹) Looking at the behavior of the equation from NASA and the resulting graph in Figure 6, it is possible to say that they are similar: in both cases the temperature at 0 m is approximately 15 °C. However, these results differ from the data taken from the meteorological stations in Colombia that establish 28,045 °C as the approximate temperature at 0 m. The equation obtained for temperature in function of the altitude with data measured in Colombia is:

Where T is the temperature in degrees Celsius (°C), and h is the altitude in meters (m). To calculate the speed of sound with dry-air conditions, the following equation could be useful (Hass, 2017):
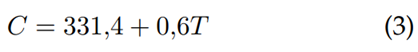
However, there are no dry-air conditions in this case, so if there is a variation in relative humidity, Eliakim presents an equation that relates the relative humidity and temperature for determining the speed of sound (Eliakim, 2014):
Figure 9 shows the map of speed of sound in Colombia using equation 4:

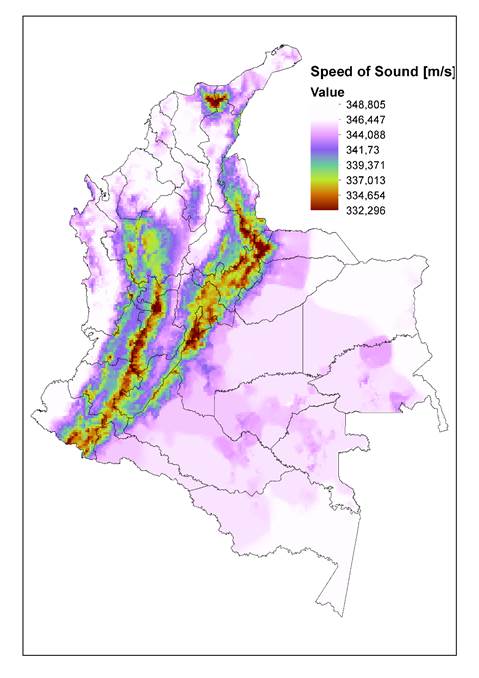
Figure 9: Speed of sound in Colombia
To obtain the map in the Figure 9, we used two parameters for determining the probabilities: the location of each meteorological station in the country with the data of speed of sound calculated in its place, and the total studied area of the country.
For estimating the speed of sound in Colombia, we used a Kernel Density Estimation (Thedoridis, 1998). This non-parametric approach estimates the shape of a desired curve using the input data, this estimation applies the equation:
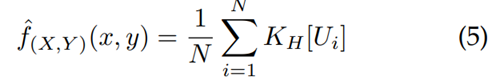
In equation 5, N is the number of meteorological stations, (x,y) is a vector with spatial coordinates (geographical location of each meteorological station),
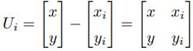 and KH(Ui) is the gaussian kernel (Buhmann, 2000); and
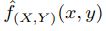 is the probability value of speed of sound at (x,y).
We used the ArcGIS program to calculate this probability. The uncertainty of the measure of altitude is 0.5m, temperature uncertainty is 0.05oC, and humidity uncertainty is 0.5%. The speed of sound in Colombia obtained for the histogram ranges between 332 m/s and 348,80m/s, with a mean value of 346,16 m/s.
If the thermodynamical conditions do not vary significantly in the place of the study, it is possible to use the average of temperature and relative humidity when calculating the radius of lightning impact by applying equation 6:
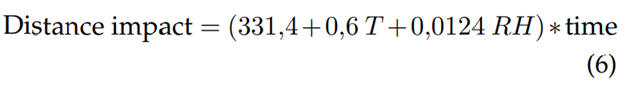
Where time can be calculated like the interval between the observation of lightning and arriving sound to the place where the observer is. For example, this observer can be a high-speed camera with event recording features. If the camera can register sound, this option might be used for recording the arrival of the thunder; otherwise, it is possible to use an independent sound sensor that records events. Once the camera is set in place for the lightning event, the speed sensor will activate to record the arrival time of both the lightning bolt and the thunder sound; then, it is possible to calculate the radius of impact with this interval and the equation of speed of sound.
We used this calculated speed of sound in other research to determine the direction and distance of lightning impact in transmission towers.
CONCLUSIONS
Contrary to the models used in higher latitudes (like that of the International Standard Atmosphere, the temperature as function of altitude is different for countries located in the Intertropical zone. In this paper we defined an equation that models the relationship between these variables in Colombia, a country located in the tropical zone, whose temperature at sea level is 28 °C approximately.
This study is a particular case because the atmosphere in a tropical country like Colombia behaves differently from the atmosphere in Southern or Northern latitudes. These localized conditions have influence in other variables like ground flash density (GFD), temperature range, ozone, and others; also, many atmospheric conditions are different in tropical zone.
Additionally, the highest speed of sound in Colombia is 348,80 m/s, the lowest is 332 m/s, and the average is 346,16 m/s.
The distance from the place a lightning bolt strikes can be calculated using the speed of sound, which depends on variables like relative humidity, temperature and altitude. Thus, in order to find the distance of impact of a lightning strike, it is necessary to take into account these variables and how they affect the speed of sound in a certain place.
References
License
Esta licencia permite a otros remezclar, adaptar y desarrollar su trabajo incluso con fines comerciales, siempre que le den crédito y concedan licencias para sus nuevas creaciones bajo los mismos términos. Esta licencia a menudo se compara con las licencias de software libre y de código abierto “copyleft”. Todos los trabajos nuevos basados en el tuyo tendrán la misma licencia, por lo que cualquier derivado también permitirá el uso comercial. Esta es la licencia utilizada por Wikipedia y se recomienda para materiales que se beneficiarían al incorporar contenido de Wikipedia y proyectos con licencias similares.