DOI:
https://doi.org/10.14483/udistrital.jour.tecnura.2014.4.a09Published:
2014-10-01Issue:
Vol. 18 No. 42 (2014): October - DecemberSection:
ReviewVisualization Techniques Through Search Interfaces in Learning Object Repositories
Downloads
How to Cite
APA
ACM
ACS
ABNT
Chicago
Harvard
IEEE
MLA
Turabian
Vancouver
Download Citation
Visualization Techniques Through Search Interfaces in Learning Object Repositories
Técnicas de visualización sobre interfaces de búsqueda en repositorios de objetos de aprendizaje
Paulo Alonso Gaona García1, Ana Fermoso García2, Salvador Sánchez Alonso3, Elvis Eduardo Gaona García4
1System Engineering, Master in Information Sciences and Communications, Ph.D candidate in Information and Knowledge Engineering. Professor at Engineering Faculty of Distrital University, Bogotá, Colombia. Contact: pagaonag@udistrital.edu.co
2Degree in computing, Doctor in Computer Science at the Deusto University. Professor at the Computer Science Department of the Pontifical University of Salamanca, Salamanca, Spain. Contacto: afermosoga@upsa.es
3Engineer in Computer, degree on Library Science. Doctor in Computer Science at the Polytechnic University of Madrid. Professor and senior member of the Information Engineering group, a research unit dependent of the Computer Science Department of the University of Alcalá, Alcalá, Spain. Contacto: salvador.sanchez@uah.es
4Electronic Engineering, Master in Information Sciences and Communications, Ph.D candidate in Engineering. Professor at Engineering Faculty of Distrital University. Bogotá, Colombia. Contact: egaona@udistrital.edu.co
Fecha de recepción: 7 de agosto de 2013 Fecha de aceptación: 14 de marzo de 2014
Clasificación del artículo: revisión
Financiamiento: Universidad Distrital Francisco José de Caldas.
Abstract
In this paper, it is presented a study to evaluate and compare the effectiveness of eight different interfaces based on visualization techniques to carry out searching digital resources according to knowledge area and knowledge representation scheme. The navigation structure is based on hierarchical taxonomic representation through the use of Art and Architecture Thesaurus (AAT). It was adopted principles of Human Computer Interaction (HCI) for the development of search interfaces through information visualization techniques. Finally, it will be presented preliminary results in order to evaluate the most representative aspects to carry out the development of visual search interfaces of learning objects in digital repositories, according to principles of visualization techniques and hierarchic taxonomic classification.
Keywords: design interfaces, information visualization, hierarchic taxonomic, visualization techniques, knowledge area, thesaurus.
Resumen
En este trabajo se presenta un estudio para evaluar y comparar la eficacia de ocho interfaces basados en técnicas de visualización, para llevar a cabo la búsqueda de recursos digitales a partir de un área de conocimiento y un esquema de representación de conocimiento. La estructura de navegación se basó en la representación taxonómica y jerárquica a través del uso de un tesauro de Arte y Arquitectura (AAT). Hemos adoptado principios de Interacción Persona Ordenador (IPO) para el desarrollo de diferentes interfaces a través de técnicas de visualización de información. Por último, se presentan los resultados preliminares, con el fin de evaluar los aspectos más representativos para llevar a cabo el desarrollo de interfaces visuales para la búsqueda de objetos de aprendizaje en repositorios digitales, a partir de una técnica de visualización y clasificación jerárquica y taxonómica.
Palabras clave: área de conocimiento, diseño de interfaces, representaciones jerárquicas, técnicas de visualización, tesauros, visualización de información.
Introduction
In recent years, digital repositories have had a representative impact on their technological development due to exponential increase in the number of digital resources published. This growth of digital resources has led to the development of several strategies, namely: i) (in terms of technology) the development of distributed repositories, heterogeneous repositories and federations of repositories as central access points to each of them (McGreal, 2008), ii) (in terms of semantics) the use of linking knowledge classification schemes by using ontologies and thesauri to provide a better understanding an organization of digital resources, and finally iii) (in terms of access) the strategies designed to offer metadata descriptions. This latter strategy turns out to be an essential condition in order to search results within a digital repository (Cechinel, Sánchez-Alonso, & Sicilia, 2009).
The assessing of visual interface that we presents, is part of our proposal research in progress, about how through visualization techniques, we aim to help creators on digital repositories to provide better services for users to: i) locate materials of a precise manner and effective form through an extensive collection of digital resources, ii) locate materials according to a thematic structure or knowledge area, and finally, iii) identify effective interfaces to performing browsing and searching processes over digital resources.
This paper presents a preliminary study for assessing the effectiveness of eight different interface designs, for help users to search digital resource according to a knowledge area. Each interface included a set of terms based on the same hierarchical representation structure of Art and Architecture Thesaurus (AAT), to carry out a search of a specific word in the knowledge area of "styles and periods".
Previous effort in the field
To perform a search process, repositories provide accessing alternatives, some of them visual, through the use of user interfaces. However, previous research found that these interfaces do not meet all the needs of users (Tenopir, 2003). Users through interfaces, have difficulty finding resources (Khoo, Kusunoki, & MacDonald, 2012), and the resources discovered are not always relevant to search (Nash, 2005). Navigation problems appear when returning to previously accessed registries (Jeng, 2005). Also limitations to combine navigation and search methods (Hartson, Shiva-kumar, & Pérez-Quinones, 2004) do not allow deploying (at a glance) the materials available in the repository by thematic classification (Hitchcock et al., 2003; Tsakonas & Papatheodorou, 2008). Therefore it is difficult to establish whether it is worth looking for materials on the repository, or if it more convenient to use other external search strategies. On the other hand, the most representative learning objects repositories in Europe provide, at least, a visual representation scheme to search digital resources. For example: i) Merlot (Merlot, 2012), by textual categories and textual search, ii) MACE (Stefaner et al., 2007), by semantic, social and contextual search, iii) Ariadne (Ariadne, 2013), by textual categories, iv) E-LERA (E-LERA, 2013), through textual search, v) E-LIS (E-LIS, 2013), by textual category and textual search, and finally, vi) Organic-Edunet (Ma-nouselis et al., 2009), by semantic, category and textual search. However, the access for each of them in some cases needs additional information to understand the use of search methods.
Recently in the field of digital repositories, visual search methods have also emerged. Some methods are focused on an adequate level of access to digital resources. The MACE project (Stefaner et al., 2007) proposes several alternatives of visual search (semantic, social and contextual) for accessing digital resources in the area of "design and architecture" through classification strategies involving: keywords, location, competition, social area and facets (Stefaner & Muller, 2007). These studies focused on perspectives that use various navigation routes together with social labeling. The result of this study suggest that; firstly, the principles of navigation with multiple facets facilitates immersion processes through activities of collaborative tagging (Stefaner et al., 2009) and secondly, that the definition of metadata is essential for improving search processes through contextual-search strategies.
Several authors agree (Aula & Kãki, 2005; But-tenfield, 1999; Hargittai, 2004; Hearst, 2009), that one of the fundamental principles for building search interfaces focus on the simplicity of them. For that reason, it is very important to analyze the interface from the point of view of the users, which is the main aim of HCI, in order to maximize user satisfaction. Therefore, usability strategies within the HCI field are an important factor in the development and evolution of the interfaces found in both libraries and digital repositories (Buttenfield, 1999; Fox et al., 1999; White & Roth, 2009). Other studies (G. Marchionini, 2006; White & Roth, 2009) specifically focused on strategies for searching and browsing capabilities to locate digital resources on this type of interfaces, demonstrated that conventional search and exploration strategies are not sufficiently robust nor flexible, to facilitate locating and accessing a collection of digital resources. In terms of efficiency, the results of those studies demonstrate that visual interfaces often lead to an unde-rutilization of metadata information far below the full semantic potential, even though these visual interfaces are key to enrich the process of finding digital resources in a specific knowledge area (Cechinel et al., 2009; Fernández, 2001).
Methodology
To perform this analysis, we took as a case study a collection of more than 42,800 Europeana digital resources, classified according to a branch of knowledge domain by AAT. Europeana is a virtual European library aimed to collect and make available the largest possible amount of Europe's cultural resources in digital form. On the other hand, AAT is a macrothesaurus developed by the Getty Foundation (Soergel, 1995). Its coverage area is art, architecture and materials related to the cultural world, and specifically to the European cultural heritage.
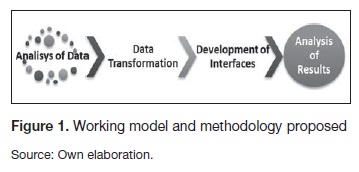
The taxonomic classification around the knowledge area of "styles and periods", allowed us to identify the set of terms in order to visualize the navigation structure of each interface. Eight search interfaces were developed based on information visualization techniques. Thus, through Human Machine Interaction strategies (HCI) based on Marchionini and Nielsen (Gary Marchionini, 2008; Nielsen, 1994a) the navigation structure was assessed at effectiveness levels in order to determine which of the visualization techniques provided better interaction capabilities for locating digital resources according to the topics of each term selected. This work was carried out in the three phases, as illustrated in figure 1.
Preparation of resources to explore
We identified a total of 118 terms related to the topics of "styles and periods" of AAT thesaurus. We selected this topic according to aspects like their good taxonomic reference, classification and depth level. In the same manner, because this category terms are related to thematic-relation level regarding to digital resources on topics of cultural heritage present in Europeana. Subsequently, a process was conducted to extract certain amount of digital resources within Europeana. Such exploration was carried out according to the AAT (Gaona, Sanchez-Alonso, & Fermoso, 2012). This process allowed us to define the classification of Europeana digital resources, and also to define a strategy for finding digital resources in a hierarchical fashion by designing a classification structure in terms of thematic areas, defined by AAT.
Devolopment of interfaces
For our experiments we have taken interfaces that are publicly available, and technically we have adapted them so that they could adequately represent the part of the taxonomy that we were interested in. In order to this, all the interfaces were developed on an Open-Source-API based on means of the Infovis (Fekete, 2004) project and also by adapting an open-source graphical interface called Relation Browser (Stefaner, 2009). This was achieved by using ActionScript to evaluate the hierarchical structure of XML-format-based data. In the following section we analyze with more in details the type of interfaces used for our study.
Types of visualization interfaces
In order to develop interfaces, we identified eight visualization strategies, represented through graphical visualization techniques (Herman, Mel-ancon, & Marshall, 2000). Each interface was loaded with the same taxonomic structure of the terms, related to the topic of "styles and periods" in the AAT thesaurus, and also with the number of digital resources explored in Europeana. By clicking on a node or link, a representation of a term in the thesaurus is obtained. Users can view the term's classification and the number of digital resources associated with each term. Figure 2 shows the eight interfaces.
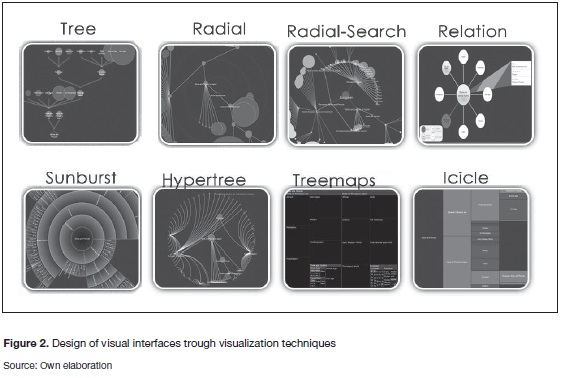
- Tree interface: It's a classic visualization, used commonly for the search of files in operating systems (Herman, et al., 2000).
- Radial interface. A visualization technique that allows the central location of nodes to be consulted (Eades, 1990).
- Radial-Search interface: This technique presents additional components at graphical level; in particular, it lays nodes with different sizes according to the number of digital resources associated with the term.
- Relation interface: It is a radial visualization technique, which only permits seeing the terms related to the level of hierarchy consulted through its navigation structure. Thus hiding the terms related to levels above or below the current category.
- Sunburst interface: It works around both focuses and context techniques such as interaction strategies, through zooming and panning in an elliptical manner (Stasko, Catrambone, Guzdial, & McDonald, 2000).
- Hypertree interface: This hyperbolic-structured technique (Lamping & Rao, 1996) allows selection of nodes by using zooming and panning techniques.
- Treemaps Interface: It is a visualization technique that displays all the hierarchical structure of all available spaces on screen by using rectangular slices (Shneiderman &Johnson, 1991).
- Icicle interface: It is a visualization technique that facilitates the representation of terms using ahierarchical clustering (Noik, 1993).
With the purpose of applying these techniques, next section we explain principles and methods through HCI to implement our visual search interfaces.
Principles of HCI implemented in interfaces
For the development of the search interfaces, some principles of HCI were also considered to facilitate the process of browsing and interaction with users. At exploration level, various browsing methods were implemented. According to Marchionini (G. Marchionini, 1997), these methods allow the definition of strategies in order to search information, and according to Lin (Lin, Soergel, & Marchionini, 1991), these methods facilitate the visualization of large amounts of information so that the user can perceive either structures or relationships or both. At interaction level, zooming strategies were determined to increase or decrease the map's navigation and panning and so making it possible to explore the entire term structure to be searched. Through the zoom strategy, focus and context techniques (Lamping, Rao, & Pirolli, 1995) were also applied. Strategies that facilitate the focus node to be visually highlighted were used; these strategies also blur the other nodes associated with other levels of lower-interest hierarchy.
At navigation level, information was determined to be deployed through maps of categories according to the taxonomic structure. This facilitates browsing the semantic content activity regarding a particular knowledge domain (Card, Mackinlay, & Shneiderman, 1999) by means of the collection of terms offered by the AAT thesaurus. This interaction would allow users to have a better sense of location for the terms to be searched.
Results of the usability tests
According to the objectives of the analysis and also to the recommendations defined for studies in the field (Nielsen, 1994b), 32 participants were selected for the tests. All participants were middle-aged, good levels of study, with a good level of English, and they were also fluent at handling web applications at the user level. Instead, care-ful consideration was given to their knowledge of search methods and interfaces, which along with the other aforementioned data were collected in a questionnaire. This section presents the evaluation results obtained from the tests performed at interaction level.
Interaction test results
Depending on the number of interfaces, distribution was performed according to the number of user interfaces to cover every aspect of a reliability assessment (Nielsen, 1994b). Given the purpose to recognize each interface, a process of recognition was performing in a learning test. This test consisted in select one search interface in order to interact with structure classification, and forms to visualize information in the interface. One expert in usability assigned randomly an interface for each participant (different to the interface selected by participant when make the learning test) to locate another set of terms and perform the same activity (search a set of term and identify the number of resources and taxo-nomic classification of each term).
Figure 3 shows the results from a subjective assessment of users with respect to the properties of the interaction level associated with navigability, classification and ease of use.
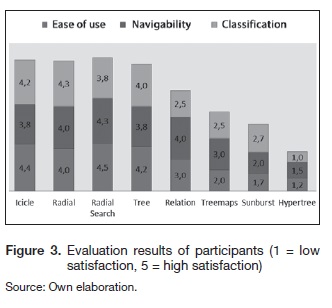
Figure 3 shows the evaluation results of the three aspects of usability (navigation, classification and ease of use) according to users' experience with each interface, where 1 is the lowest and 5 the highest rating. This process identified icicle, radial-search and tree as better interfaces (than the others) in a subjective opinion of users, evaluated based on three aspects of interaction.
Results according interface classification
After all the individual aspects reported in the previous sections, we wanted to have a look at the overall assessment. This analysis of aggregated results according to the four visualization strategies defined in the study process is shown in figure 4.
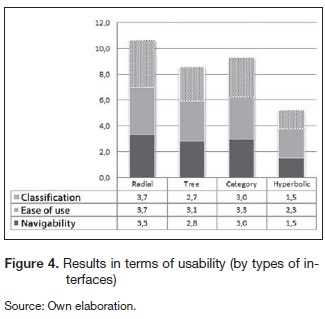
Figure 4 presents a high average rating for radial-type interfaces, interfaces that during the process of evaluation performed well in terms of interaction regarding the three aspects of usability. The results presented for the hyperbolic type of interfaces are showed low valoration values. One of the main problems that were identified with these types of interfaces was the loss of focus that the interface exhibited when users were selecting a term, by defocusing the rest of categories within the interface at graphical level and thereby generating loss of visibility of other categories. Another common problem with these type of interfaces was the form that interfaces were visually represented the terms in the navigation structure, that is, in a not very clear way (very often overlapping some terms), when the category of the term was selected. This resulted in losing all visibility of terms that were presented within the same hierarchy level of taxonomy with a large number of terms.
The icicle interface achieved better focus (attention) through the evaluation process, presented some of the best results (close to the radial-search interface). This interface allowed gradually, the visual representation of hierarchic system-level navigation. On the other hand, at visual level, like radial-search interface, icicle interface easy allowed the identification of digital resources according to the proportion of each node queried in the navigation structure.
Descriptive statistical test results
We performed a descriptive statistical analysis of usability relevance according to others attributes of usability. Table 1 summarizes the results of means and Standard Deviation (SD) for all interfaces according to user profile with high levels of relevance.
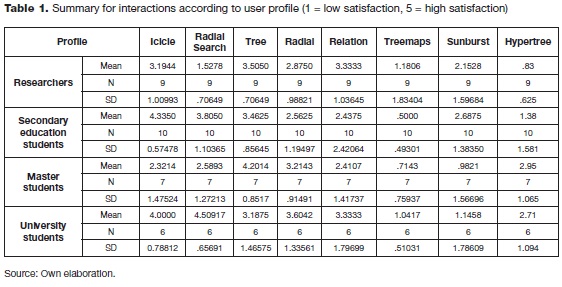
Table 1 presents the results according to user profile. The comparison between profiles demonstrated that participants with more active preference for the tree interface are researchers (mean=3.40 SD = 0.70) and masters' students (mean=4.20 SD = 0.85). Interface icicle was the interface with a better satisfaction between secondary education students (mean=4.33 SD = 0.57) and university students (mean = 4.00 SD = 0.78). On the other hand, radial-search was the interface with more satisfaction for university students (mean = 4.50 SD = 0.65) and secondary education students (mean=3.80 SD=1.10).
In table 2 we summarize the results of all interfaces with regards to others evaluation criteria that users made in usability test.
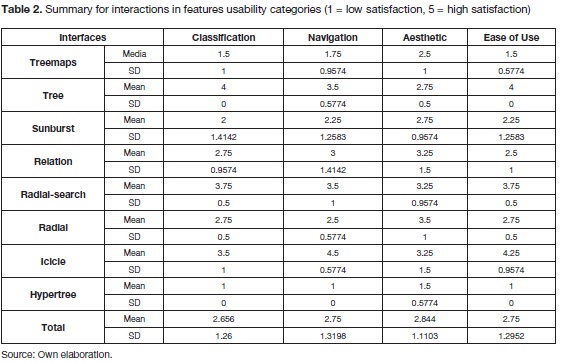
Table 2 presents the results according to the case study, which demonstrates in general a positive attitude towards each attribute related to ease of use, navigation and classification on interfaces (tree, icicle and radial-search). In order to facilitate the search process of large data structures, the most noteworthy interfaces that presented a good usability through hierarchical depth, were icicle, tree and radial. However radial interface, cannot visualize a good classiication, because the method of displaying digital resources is still quite limited for the user at graphical level.
Conclusions
One of the advantages to be reflected in the visualization techniques evaluated is that these techniques present a general overview of contents of the whole collection of digital resources. This means that users are able to continue the search process, and deepen on those branches or levels of hierarchy, with the possibility of displaying a greater or lesser number of digital resources. Therefore, this type of search strategies could be a key factor to integrate these types of visualization techniques, according to user profiles which is focused the repository, in order to increase the use of learning objects repositories, and improve traffic thereof.
Although a search process through information visualization improve the access of digital resources trough graphical and taxonomic representation schemes, it is clear that displaying all the information about each of the nodes represents a serious problem of usability. The unfolding of all levels of a taxonomic hierarchy structure, requires the definition of a suitable technically-tiered deployment, which allows users to obtain a hierarchical view of the thematic structure.
In performing with a preliminary study of usability according to all visualization strategies, participants had a greater preference for the evaluation of activities related with knowledge areas represented by a number of digital resources over aspects associated with exploration or interaction aspects. For example, one of the visual phenomena which are reflected throughout the study was that the interfaces who presented proportionally different types of sizes in their nodes, allowed capturing greater attention by participants in order to identify terms with greater or lesser number of resources. These criteria it allows them to make decisions about improving the access to a collection of digital resources. Through our experiments we can remark that i) radial type interfaces aesthetically represent a good alternative for the user, however are not effective in the process of exploration, ii) ease of use of a graphical interface depends on the interaction of the hierarchic structure of navigation, and finally iii) the greater visual components of support, greater the level of acceptance of interfaces. For example, additional mechanisms for textual searches using AJAX methods, through visual links or path navigations to determine hierarchy level that users are searching to advance or go back in the exploration process.
On other hand, tree interface showed good results in the evaluation of its navigability-level as well as in classification, according to their subject impression. These results are reflected in the ease of use associated with the interaction level and the location of resources. For this reason, it is often mentioned as the favourite interface, possibly because most people are used to using folder trees in the interfaces of computer operating systems. In addition to this, these interfaces mark a navigation path that leads the participant to clearly understand a certain level of the navigation structure.
Future work will attempt to include a complete study of usability and more elements into the search results, such as relevant digital resources evaluated by users in a framework. Some work is already in progress in this direction. The results of this usability test, will provide us a guide to perform an integration for the best visualization techniques (selected from the results of this research), for the development of a visual search framework. The framework will permit an integration of the assessment criteria through ratings in the digital resources by a user community. These criteria of evaluation might constitute a key factor to improve search results through a mechanism that would allow the deployment of relevant digital resources. The analysis through social "likes" criteria, could be a key factor to explore whether search results of digital resources rated with this criteria is regarded as really good, or relevant, by the repository. And, therefore, if it could become a system of digital resources recommendation within the users community.
Referencias
Ariadne, 2013, Retrieved on January 2014, from http://www.ariadne-eu.org.
Aula, A., & Kãki, M., Less is More in Web Search Interfaces for Older Adults. First Monday, No. 7, 2005, doi: http://dx.doi.org/10.5210/fm.v10i7.1254.
Buttenfield, B., Usability Evaluation of Digital Libraries, Science & Technology Libraries, Vol. 17, No. 3-4, 1999, pp. 39-59.
Card, S. K., Mackinlay, J. D., & Shneiderman, B., Readings in Information Visualization: Using Vision to Think. San Francisco, CA: Morgan Kaufmann Publishers, 1999.
Cechinel, C., Sánchez-Alonso, S., & Sicilia, M. Á. Empirical Analysis of Errors on Human-Generated Learning Objects Metadata, 2009.
E-LERA, 2013, Retrieved on January 2014, from http://209.87.56.111/drupal/.
E-LIS, 2013, Retrieved on January 2014, from http://eprints.rclis.org/.
Eades, P., & Sugiyama, K., How to Draw a Directed Graph, J. Information Processing, Vol. 13,No. 4, 1990, pp. 424-34
Fekete, J-D, The Infovis Toolkit, Paper presented at the Information Visualization, 2004, IN-FOVIS 2004, IEEE Symposium.
Fernández, J. M., Modelos de recuperación de información basados en redes de creencia (PhD Tesis), Universidad de Granada, Spain, 2001.
Fox, E. A., Hix, D., Nowell, L. T., Brueni, D. J., Wake, W. C., Heath, L. S., & Rao, D., Users, User Interfaces, and Objects: Envision, a Digital Library, Journal of the American Society for Information Science, Vol. 44, No. 8, 1999, pp. 480-91.
Gaona, P., Sanchez-Alonso, S., & Fermoso, A. Análisis de cobertura del tesauro AAT en la biblioteca digital europea: ideas preliminares para su empleo en la educación, 12-15 junio 2012, Paper presented at the SPDECE 2012, Alicante, España, 2012.
Hargittai, E., Classifying and Coding Online Actions, Social Science Computer Review, Vol. 22, No. 2, 2004, pp. 210-227.
Hartson, H. R., Shivakumar, P., & Pérez-Quiñones, M.A., Usability Inspection of Digital Libraries: A Case Study, Vol. 4, No. 2, 2004.
Hearst, M. A., Search User Interfaces, New York, NY: Cambridge University Press, 2009.
Herman, I., Melancon, G., & Marshall, M. S. Graph Visualization and Navigation in Information Visualization: A Survey, Visualization and Computer Graphics, IEEE Transactions, Vol. 6, No. 1, 2000, pp. 24-43. doi: 10.1109/2945.841119
Hitchcock, S., Woukeu, A., Brody, T., Carr, L., Hall, W., & Harnad, S., Evaluating Cite-base, an Open Access Web-Based Citation-Ranked Search and Impact Discovery Service, Monograph (Technical Report), Southampton, England, 2003.
Jeng, J., Usability Assessment of Academic Digital Libraries: Effectiveness, Efficiency, Satisfaction, and Learnability, Vol. 55, No. 2-3, 2005.
Khoo, M., Kusunoki, D., & MacDonald, C. Finding Problems: When Digital Library Users Act as Usability Evaluators, Paper presented at the System Science (HICSS), 2012 45th Hawaii International Conference, 4-7 Jan 2012.
Lamping, J., & Rao, R., The Hyperbolic Browser: A Focus+Context Technique for Visualizing Large Hierarchies, Journal of Visual Languages and Computing, Vol. 7, No. 1, 1996, pp. 33-55.
Lamping, J., Rao, R., & Pirolli, P., A focus+ Context Technique Based on Hyperbolic Geometry For Visualizing Large Hierarchies, Paper presented at the Proceedings of the SIGCHI Conference on Human Factors in Computing Systems, 1995.
Lin, X., Soergel, D., & Marchionini, G., A self-Organizing Semantic Map for Information Retrieval, Paper presented at the Proceedings of the 14th Annual International ACM SIGIR Conference on Research and Development in Information Retrieval, 1991.
Manouselis, N., Kastrantas, K., Sanchez-Alonso, S., Cáceres, J., Ebner, H., & Palmer, M., Architecture of the Organic, Edunet Web Portal, IGI Global, 2009, pp. 71-91.
Marchionini, G., Information Seeking in Electronic Environments (Vol. 9), Cambridge University Press, 1997.
Marchionini, G., Exploratory Search: From Finding to Understanding, Communications of the ACM, Vol. 49, No. 4, 2006, pp. 41-46.
Marchionini, G., Human-Information Interaction Research and Development, Library & Amp; Information Science Research, Vol. 30, No. 3, 2008, pp. 165-174. doi: 10.1016/j.lisr.2008.07.001.
McGreal, R., A Typology of Learning Object Repositories, Handbook on Information Technologies for Education and Training, 2008, pp. 5-28.
Merlot, 2012, Retrieved on January 2014, from http://www.merlot.org/.
Nash, S.S., Learning Objects, Learning Object Repositories, and Learning Theory: Preliminary Best Practices for Online Courses, Vol. 1, No. 1, 2005.
Nielsen, J., Guerrilla HCI: Using Discount Usability Engineering to Penetrate the Intimidation Barrier, Academic Press, 1994a.
Nielsen, J., Usability Engineering, Morgan Kaufmann Publishers, San Francisco, California, USA, 1994b.
Noik, E., Exploring Large Hyperdocuments: Fisheye Views of Nested Networks, Proceedings of the fifth ACM conference on Hypertext, 1993,pp. 192-205.
Shneiderman, B., & Johnson, B., "Tree-Maps: A Space-Filling Approach to the Visualization of Hierarchical Information Structures", Proceedings of IEEE Information Visualization, 1991, pp. 175-282.
Soergel, D., The Art and Architecture Thesaurus (AAT): A Critical Appraisal, Visual Resources, Vol. 10, No. 4,1995, pp. 369-400.
Stasko, J., Catrambone, R., Guzdial, M., & McDonald, K., An Evaluation of Space-Filling Information Visualizations for Depicting Hierarchical Structures, International Journal of Human-Computer Studies, Vol. 53,No. 5, 2000, pp. 663-94.
Stefaner, M., 2009, Retrieved on January 2014, from http://moritz.stefaner.eu/projects/relation-browser/.
Stefaner, M., Dalla Vecchia, E., Condotta, M., Wolpers, M., Specht, M., Apelt, S., & Duval, E., MACE-Enriching Architectural Learning Objects for Experience Multiplication, Creating New Learning Experiences on a Global Scale, No. 4753, 2007, pp. 322-36.
Stefaner, M., & Muller, B., Elastic Lists for Facet Browsers, Paper presented at the Database and Expert Systems Applications, 2007, DEXA'07, 18th International Workshop.
Stefaner, M., Wolpers, M., Memmel, M., Duval, E., Specht, M., Borner, D., & Klemke, R., MACE: Joint Deliverable "Evaluation of the MACE System", 2009. The MACE Consortium.
Tenopir, C., Use and Users of Electronic Library Resources: An Overview and Analysis of Recent Research Studies, Paper presented at the Council on Library and Information Resources, Washington, 2003.
Tsakonas, G., & Papatheodorou, C., Exploring Usefulness and Usability in the Evaluation of Open Access Digital Libraries, Information Processing & Management, Vol. 44, No. 3, 2008, pp. 1234-50.
White, R. W., & Roth, R. A., Exploratory Search: Beyond the Query-Response Paradigm, Synthesis Lectures on Information Concepts, Retrieval, and Services, Vol. 1, No. 1, 2009, pp. 1-98. doi: 10.2200/s00174ed-1v01y200901icr003.
License
Esta licencia permite a otros remezclar, adaptar y desarrollar su trabajo incluso con fines comerciales, siempre que le den crédito y concedan licencias para sus nuevas creaciones bajo los mismos términos. Esta licencia a menudo se compara con las licencias de software libre y de código abierto “copyleft”. Todos los trabajos nuevos basados en el tuyo tendrán la misma licencia, por lo que cualquier derivado también permitirá el uso comercial. Esta es la licencia utilizada por Wikipedia y se recomienda para materiales que se beneficiarían al incorporar contenido de Wikipedia y proyectos con licencias similares.