DOI:
https://doi.org/10.14483/23448393.16102Published:
2020-12-19Issue:
Vol. 26 No. 1 (2021): January-AprilSection:
Petroleum EngineeringPattern Recognition Algorithm for Automatic Quantification of Toxoplasma gondii Tachyzoites
Algoritmo de reconocimiento de patrones para cuantificación automática de taquizoitos de Toxoplasma gondii
Keywords:
Toxoplasma gondii, tachyzoites, digital image processing, automatic quantification (en).Keywords:
Toxoplasma gondii, tachyzoites, digital image processing, automatic quantification (es).Downloads
References
E. Yazdanparast, A. D. Anjos, D. Garcia, C. Loeuillet, H. R. Shahbazkia, and B. Vergnes, “Inspect, an opensource and versatile software for automated quantification of (leishmania) intracellular parasites,” PLoS Negl. Trop. Dis., vol. 8, no. 5, 2014. doi: https://doi.org/10.1371/journal.pntd.0002850 DOI: https://doi.org/10.1371/journal.pntd.0002850
F. Pinto-Ferreira, E. T. Caldart, A. K. S. Pasquali, R. Mitsuka-Bregano, R. L. Freire, and I. T. Navarro, “Patterns of transmission and sources of infection in outbreaks of human toxoplasmosis,” Emerg. Infect. Dis., vol. 25, no. 12, pp. 2177 – 2182, 2019. doi: https://doi.org/10.3201/eid2512.181565 DOI: https://doi.org/10.3201/eid2512.181565
D. Schluter and A. Barragan, “Advances and challenges in understanding cerebral toxoplasmosis,” Front. Immunol., vol. 10, no. 242, 2019. doi: https://doi.org/10.3389/fimmu.2019.00242 DOI: https://doi.org/10.3389/fimmu.2019.00242
W. Cañón-Franco, N. López-Orozco, J. Gómez-Marín, and J. P. Dubey, “An overview of seventy years of research (1944 – 2014) on toxoplasmosis in colombia, south america,” Parasit. Vectors, vol. 7, no. 427, pp. 1 – 15, 2014. doi: https://doi.org/10.1186/1756-3305-7-427 DOI: https://doi.org/10.1186/1756-3305-7-427
Z. Koloren and J. P. Dubey, “A review of toxoplasmosis in humans and animals in turkey,” Parasitology, vol. 1, no. 17, pp. 19 – 30, 2019. doi: https://doi.org/10.1017/S0031182019001318 DOI: https://doi.org/10.1017/S0031182019001318
K. Simekova, E. Novakova, R. Rosolanka, J. Masna, and D. Antolova, “Clinical course of opportunistic infections-toxoplasmosis and cytomegalovirus infection in hiv-infected patients in slovakia,” Pathogens, vol. 8, no. 4, 2019. doi: https://doi.org/10.3390/pathogens8040219 DOI: https://doi.org/10.3390/pathogens8040219
M. Lari, H. Farashbandi, and F. Mohammadi, “Association of toxoplasma gondii infection with schizophrenia and its relationship with suicide attempts in these patients,” Trop. Med. Int. Health, vol. 22, no. 10, pp. 1322 – 1327, 2017. doi: https://doi.org/10.1111/tmi.12933 DOI: https://doi.org/10.1111/tmi.12933
A. A. Marchioro, B. T. Tiyo, C. M. Colli, C. Z. de Souza, J. L. Garcia, M. L. Gomes, and A. L. Falavigna- Guilherme, “First detection of toxoplasma gondii dna in the fresh leafs of vegetables in south america,” Vector Borne Zoonotic. Dis., vol. 16, no. 9, pp. 624 – 626, 2016. doi: https://doi.org/10.1089/vbz.2015.1937 DOI: https://doi.org/10.1089/vbz.2015.1937
A. Vismarra, E. Barilli, M. Miceli, C. Mangia, C. Bacci, F. Brindani, and L. Kramer, “Toxoplasma gondii and pre-treatment protocols for polymerase chain reaction analysis of milk samples: A field trial in sheep from southern italy,” Ital. J. Food Saf., vol. 6, no. 1, pp. 299 – 303, 2017. doi: https://doi.org/10.4081/ijfs.2017.6501 DOI: https://doi.org/10.4081/ijfs.2017.6501
X. Y. Liu, Z. D. Wang, S. El-Ashram, and Q. Liu, “Toxoplasma gondii oocyst-driven infection in pigs, chickens and humans in northeastern china,” BMC Vet. Res., vol. 15, no. 1, 2019. doi: https://doi.org/10.1186/ s12917-019-2121-4 DOI: https://doi.org/10.1186/s12917-019-2121-4
J. F. Trivino-Valencia, J. D. Zuluaga, and J. E. Gomez-Marin, “Detection by pcr of pathogenic protozoa in raw and drinkable water samples in colombia,” Parasitol. Res., vol. 115, no. 5, pp. 1789 – 1797, 2016. doi: https://doi.org/10.1007/s00436-016-4917-5 DOI: https://doi.org/10.1007/s00436-016-4917-5
D. M. Campo-Portacio, M. A. Discuviche-Rebolledo, P. J. Blanco-Tuirán, Y. M. Montero-Pérez, K. E. Orozco- Méndez, and Y. M. Assia-Mercado, “Detección de toxoplasma gondii por amplificación del gen b1 en carnes de consumo humano,” Infectio, vol. 18, no. 3, pp. 93 – 99., 2014. doi: https://doi.org/10.1016/j.infect.2014.05.001 DOI: https://doi.org/10.1016/j.infect.2014.05.001
P. J. Lescault, B. Thompson, V. Patil, D. Lirussi, A. Burton, J. Margarit, J. Bond, and M. Matrajt, “Genomic data reveal toxoplasma gondii differentiation mutants are also impaired with respect to switching into a novel extracellular tachyzoite state,” PLoS ONE, vol. 5, no. 12, 2010. doi: https://doi.org/10.1371/journal.pone.0014463 DOI: https://doi.org/10.1371/journal.pone.0014463
I. J. Blader, B. I. Coleman, C. T. Chen, and M. J. Gubbels, “Lytic cycle of toxoplasma gondii: 15 years later,” Annu. Rev. Microbiol., vol. 69, no. 1, pp. 463 – 485, 2015. doi: https://doi.org/10.1146/annurev-micro-091014-104100 DOI: https://doi.org/10.1146/annurev-micro-091014-104100
M. J. Holmes, P. Shah, R. C. Wek, and W. J. Sullivan, “Simultaneous ribosome profiling of human host cells infected with toxoplasma gondii,” MSphere, vol. 4, no. 3, pp. 19 – 30, 2019. doi: https://doi.org/10.1128/msphere.00292-19 DOI: https://doi.org/10.1128/mSphere.00292-19
R. Useo, F. Husson, J. D. Coninck, S. Khaldi, and P. Gervais, “A new alternative in vitro method for quantification of toxoplasma gondii infectivity,” J. Parasitol., vol. 98, no. 2, pp. 299 – 303, 2012. doi: https://doi.org/10.1645/GE-2873.1 DOI: https://doi.org/10.1645/GE-2873.1
D. Cadena-Herrera, J. E. Esparza-De Lara, N. D. Ramírez-Ibañez, C. A. López-Morales, N. O. Pérez, L. F. Flores-Ortiz, and E. Medina-Rivero, “Validation of three viable-cell counting methods: Manual, semiautomated, and automated,” Biotechnol. Rep. (Amst), vol. 7, no. 1, pp. 9 – 16, 2015. doi: https://doi.org/10.1016/j.btre.2015.04.004 DOI: https://doi.org/10.1016/j.btre.2015.04.004
A. G. Gomes-Alves, A. F. Maia, T. Cruz, H. Castro, and A. M. Tomás, “Development of an automated image analysis protocol for quantification of intracellular forms of leishmania spp,” PLoS One, vol. 13, no. 8, pp. 19 – 30, 2018. doi: https://doi.org/10.1371/journal.pone.0201747 DOI: https://doi.org/10.1371/journal.pone.0201747
M. J. Dagley, E. C. Saunders, K. J. Simpson, and M. J. McConville, “High-content assay for measuring intracellular growth of leishmania in human macrophages,” Assay Drug Dev. Technol., vol. 13, no. 7, pp. 389 – 401, 2015. doi: https://doi.org/10.1089/adt.2015.652 DOI: https://doi.org/10.1089/adt.2015.652
S. E. Staggs, M. J. See, J. P. Dubey, and E. N. Villegas, “Obtaining highly purified toxoplasma gondii oocysts by a discontinuous cesium chloride gradient,” JoVE, vol. 33, p. 1420, 2009. doi: https://doi.org/10.3791/1420 DOI: https://doi.org/10.3791/1420
J. Barcia, “The giemsa stain: Its history and applications,” Int. J. Surg. Path., vol 15, no. 3, pp. 292-296, 2007. doi: https://doi.org/10.1177/1066896907302239 DOI: https://doi.org/10.1177/1066896907302239
L. A. Jeni, J. F. Cohn, and F. De La Torre, “Facing imbalanced data–recommendations for the use of performance metrics,” in 2013 Hum. Assoc. Conf. Aff. Comp. Intell. Inter. pp. 245–251, 2013., 2013. doi: https://doi.org/10.1109/ACII.2013.47 DOI: https://doi.org/10.1109/ACII.2013.47
D. J. P. Ferguson and J. F. Dubremetz, “The ultrastructure of toxoplasma gondii. in toxoplasma gondii: The model apicomplexan - perspectives and methods: 2nd ed,” Elsevier ltd, vol. 13, no. 7, p. 19–59, 2014. doi: https://doi.org/10.1016/B978-0-12-396481-6.00002-7 DOI: https://doi.org/10.1016/B978-0-12-396481-6.00002-7
S. Li, A. Li, D. A. M. Lara, J. E. G. Marín, M. Juhas, and Y. Zhang, “Transfer learning for toxoplasma gondii recognition,” mSystems, vol. 5, 2020. doi: https://doi.org/10.1128/mSystems.00445-19 DOI: https://doi.org/10.1128/mSystems.00445-19
D. Fisch, A. Yakimovich, B. Clough, J. Wright, M. Bunyan, M. Howell, J. Mercer, and E. Frickel, “Defining host–pathogen interactions employing an artificial intelligence workflow,” Elife, vol. 8, 2019. doi: https://doi.org/10.7554/eLife.40560 DOI: https://doi.org/10.7554/eLife.40560
C. A. Castañón, J. S. Fraga, S. Fernandez, A. Gruber, and L. da F. Costa, “Biological shape characterization for automatic image recognition and diagnosis of protozoan parasites of the genus eimeria,” Patt. Rec., vol. 40, no. 7, pp. 1899 – 1910, 2007. doi: https://doi.org/10.1016/j.patcog.2006.12.006 DOI: https://doi.org/10.1016/j.patcog.2006.12.006
How to Cite
APA
ACM
ACS
ABNT
Chicago
Harvard
IEEE
MLA
Turabian
Vancouver
Download Citation
Recibido: 30 de abril de 2020; Revisión recibida: 6 de agosto de 2020; Aceptado: 18 de agosto de 2020
Abstract
Context:
Digital image processing is an efficient and suitable computational tool for the automatic quantification of human pathogens in images, providing analysis in less time, greater number of samples, and result reproducibility. We propose the development and validation of an image processing algorithm, for the recognition and automatic quantification of T. gondii tachyzoites.
Method:
We developed an algorithm based on image processing. This workflow allows identifying the morphology of each parasite in the image by determining the number of parasites distinguishing them from those with a similar morphology, but not corresponding to the parasite in question. Images were obtained through Giemsa staining protocols.
Results:
The original images were analyzed by experts. The results showed correlation with those obtained by the automatic count. Additionally, a processing time of 5 seconds per image was obtained with the algorithm. This automated quantification tool allowed count of tachyzoites in tens of images.
Conclusions:
This automatic image analysis tool can extend its implementation to any laboratory that is involved in the quantification of extracellular Toxoplasma gondii tachyzoites, as well as other aspects of research on its tachyzoites that require the count of this form of development of the parasite.
Keywords:
Toxoplasma gondii, tachyzoites, digital image processing, automatic quantification..Resumen
Contexto:
El procesamiento digital de imágenes es una herramienta computacional eficiente y adecuada para la cuantificación automática de patógenos humanos en imágenes, proporcionando análisis en menos tiempo, mayor número de muestras y reproducibilidad en los resultados. Proponemos el desarrollo y validación de un algoritmo de procesamiento de imágenes, para el reconocimiento y cuantificación automática de taquizoitos de T. gondii.
Método:
Desarrollamos un algoritmo basado en el procesamiento de imágenes. Este flujo de trabajo permite identificar la morfología de cada parásito en la imagen, determinando el número de parásitos presentes y diferenciando aquellas estructuras que presentan una morfología similar pero que no corresponden al parásito en cuestión. Las imágenes originales fueron obtenidas mediante protocolos de tinción Giemsa.
Resultados:
Las imágenes originales fueron analizadas por expertos. Los resultados mostraron correlación con los obtenidos por el conteo automático. Además, se obtuvo un tiempo de procesamiento de 5 segundos por imagen con el algoritmo. Esta herramienta de cuantificación automática permitió el recuento de taquizoitos en decenas de imágenes.
Conclusiones:
Esta herramienta de análisis automático de imágenes puede extender su implementación a cualquier laboratorio que esté involucrado en la cuantificación de taquizoitos extracelulares de Toxoplasma gondii, así como otros aspectos de la investigación sobre sus taquizoitos que requieran el conteo de este estado de desarrollo del parásito.
Palabras clave:
Toxoplasma gondii, tachizoitos, procesamiento digital de imágenes, cuantificación automática..Introduction
Toxoplasmosis is a parasitic disease caused by the protozoan known as Toxoplasma gondii (T. gondii). This microorganism, like other parasites such as Leishmania, responsible for Leishmaniasis disease, and Trypanosoma cruzi for Chagas disease, are all obligate intracellular parasites and have the ability to infect humans cells [1]. It is estimated that there is high seroprevalence in humans due to T. gondii. Between 10,0 and 97,4% of adults have been exposed to the parasite depending on the different geographical areas [2]. Some studies indicate that this pathogen affects over one third of the global human population [3]. In Colombia, a seroprevalence of T. gondii is reported for an average of 41,7% of the human population without significant differences between men and women. It is also considered that there is an increased risk of infection in women in gestation [4].
It is known that in humans, T. gondii strongly affects the fetus, generating Congenital Toxoplasmosis [5]. Furthermore, for people immunocompromised with HIV, the reactivation of the chronic infection by T. gondii may be associated in most cases with encephalitis, focal neurological abnormalities, alterations in the functionality of the cerebellum, chorioretinitis, and the possibility of pulmonary symptoms [6]. Some studies report the relationship of T. gondii and the presence of neuropsychiatric symptoms such as schizophrenia [7]. An important feature of this parasite is its ability to use various means of transmission to cause infection. The presence of T. gondii oocysts and tachyzoites in water, vegetables [8], milk [9], among others, becomes a highly efficient mechanism to invade host cells. The consumption of undercooked meats with the presence of parasite tissue cysts is a focus of infection [10]. In Colombia, some studies report the presence of T. gondii and other protozoan parasites in drinkable water samples [11], as well as the detection of T. gondii in different types of meat distributed for human consumption [12].
The tachyzoite of T. gondii is considered a state of development with rapid proliferation and dissemination, associated with acute infection in humans [13]. In response to the host cell’s immune system, the tachyzoite becomes a bradyzoite, which has the ability to stay within tissue cysts in the brain of its host [14]. Tachyzoite replication within the host cell is associated with intracellular processes induced by its protein machinery, which manipulates regulation processes regarding gene expression of the host cell to ensure and promote proliferation at the expense of the host [15]. One of the important events for the parasite to proliferate successfully is its multiplication within the host cell. The amount of parasites that replicate show their mitotic capacity and ensures parasitic virulence [16].
Within the in vitro processes that are carried out for studies of infection with T. gondii, previous counts of tachyzoites are performed to monitor the intracellular proliferation of the parasite. In several laboratories in Colombia, Neubauer chamber counting is used, due to its low cost and versatility. However, this method depends on the analysis capacity to recognize the different attributes of each cell and differentiate them from those particles that are also present in the sample but that do not correspond to a cell. Therefore, this count is susceptible to variations between users, which depends on their experience in the management of the biological model [17].
Another important consideration with respect to counting is that it requires more time for the analysis of each sample. Currently, automated tools have contributed in applications focused on the quantification of microorganisms, providing the possibility of counting a large number of samples in a short time, as well as, reducing the variability of the results associated with human error [17]. Image processing has emerged as an alternative for the automatic quantification of protozoan parasites. These automated quantification methods have allowed elucidating processes of cell growth, infection rates, parasitic load, among others [18].
In Leishmania, a protozoan parasite that is pathogenic for humans, fluorescence microscopy image processing algorithms have been developed to allow detecting Leishmania macrophages, amastigotes, and promastigotes resulting in the automatic counting of infected and uninfected macrophages, as well as parasite counts inside and outside the host cell. Based on these results, infection rates and parasitic loads were determined. These values that indicate the parasite’s infection capacity in the host cell [19].
This paper presents the development of a computer vision algorithm as an alternative tool for quantification of T. gondii tachyzoites in images from biological samples, thus improving the accuracy and specificity of the count and also reducing the time in which the analysis can be performed. The availability of this computational strategy from engineering can provide a useful tool for measuring T. gondii tachyzoites, contributing with an advance in precision and reproducibility of results in the experimental processes of biological research.
Materials and method
Biological Material
Tachyzoites of the RH strain of T. gondii were used in our study, and they were donated by Dr. Barbara Zimmermann from the Parasite Biochemistry and Molecular Biology research group of Universidad de los Andes. A PFHM-II culture medium of tachyzoites was removed by washing twice with PBS 1X (phosphate buffered saline) before carrying out chemical staining processes (1.000 g of centrifuge cells for 10 minutes at 4 ºC). The tachyzoites were resuspended in PBS 1X and identified through microscopic observation.
Chemical Staining
The adequate chemical staining of a biological sample is important in microscopy processes because the analysis of an image with computational tools depends on its quality. An adequate process of preparation and assembly of the sample facilitates the acquisition of data and reduces the duration of analyses. Therefore, it is often desirable to have a standardized protocol that allows imaging with minimal impurities to avoid uninterpretable results.
We standardized an experimental protocol for chemical staining of tachyzoites with conditions that allowed obtaining the images that were later used in the development and validation of the algorithm. In this work, all safety precautions were taken when working with T. gondii tachyzoites as an experimental model. A biosafety protocol used for the management of T. gondii was followed [20].
Conditions such as dilution factor, Giemsa reagent concentration, and final sample volume were taken into account. Giemsa staining is a standard method used for clinical diagnosis in some pathogenic microorganisms. It was initially designed for the demonstration of parasites such as plasmodium in malaria [21]. However, it is also currently used in field research for the study of cysts and tachyzoites of T. gondii. The slides were pre-washed with HCl 37% v/v for 24 hours. Several dilutions of the T. gondii tachyzoite samples were made (data not shown). Finally, the 1:5 dilution was found to be the most accurate to clearly show the shape and size of the parasites that were captured in each visual field.
Various concentrations of the Giemsa reagent were evaluated (data not shown). The concentration of 20% v/v allowed the characteristic morphology of the T. gondii tachyzoite to be stained with the appropriate color intensity. Various volumes of the sample to be fixed were also evaluated. Finally, 100 µl were considered to be the indicated sample volume to fix on each slide. The sample was fixed with 70% v/v methanol, covered with 20% v/v Giemsa reagent for 15 minutes, and the excess staining was removed. Then, they were washed once in H2O and dried at room temperature. Images were captured on a CX31 RTSF Olympus microscope with an EOS RbelT3i Canon camera using a 1000X magnification.
Image Processing
The digital image processing algorithm was designed using the Toolbox Image Processing from MATLAB 2014b. On a computer with 4 GB RAM, an Intel core i5 - 5200U, and Windows 8. 25 images (18 MP) were selected for algorithm calibration.
Image acquisition
The images used for manual counting and automatic counting were acquired with an Olympus Cx31 microscope, a 1000x magnification, and Canon EOS REbelT3i camera with an RGB CMOS 18 MP sensor. All analyzed samples followed the same laboratory protocol. Original images were used for manual counting without other processes, but automatic counting required additional processes in order to get a satisfactory result.
Pre-processing
Once the images were acquired, it was necessary to perform a series of steps to eliminate irrelevant information in the image. The blue and red channels were removed, since the green channel has a better contrast between the background of the image and the tachyzoites. This channel was passed to a gray scale. The threshold value was determined from the histograms of 25 images, and it was selected in such a way that tachyzoites were not removed from the image. Finally, the binarized image was obtained.
Segmentation
Morphological filters were applied to the images to reduce noise and highlight certain characteristics. This is done using an ellipsoid geometry, which is similar to the tachyzoites. In order to round the edges, an opening operation was performed, which consisted of erosion and dilation. In order to increase sharpness, a filling function was applied to fill the holes in the image and reduce noise, an opening operation was applied to eliminate any objects with a smaller number of connected pixels. Finally, each connected region was labeled.
Features extraction and classification
The characteristics used to classify segmented regions as tachyzoite and non-tachyzoite were: area, eccentricity, and major axis.
The major axis is the line that passes through the center of the image and is perpendicular to the minor axis, taking into account that the tachyzoites have an elongated morphology, it is possible to determine from this length if something is not a tachyzoite. However, this feature only considers one dimension. On the contrary, the area considers the two dimensions of each element. Finally, knowing that eccentricity is the relationship between the distance of the foci of the ellipse, and its main axis is the length, the eccentricity allows discriminating elements that do not meet the elongated morphology of tachyzoites.
The ranges for each of the characteristics were determined from 25 calibration images. In the images to be analyzed, if an element was outside the established ranges, it was classified as nontachyzoite. Finally, the elements classified as tachyzoites were quantified, that is, elements within the ranges of the characteristics found.
Performance analysis of the computational algorithm
To evaluate the performance of the algorithm, 75 images were used. The count of tachyzoites in each original image was carried out by three experts. The average of this count experts was selected as a gold standard to quantify the performance of the developed automatic counting algorithm. A confusion matrix was performed by identifying the number of true positives (Tp), true negatives (Tn), false positives (Fp), and false negatives (Fn). Accuracy, precision, specifity, sensitivity (recall), and F-score metrics were calculated with the following formulas [22]:


Results
Experimental Results
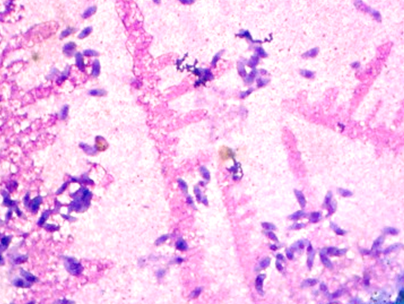
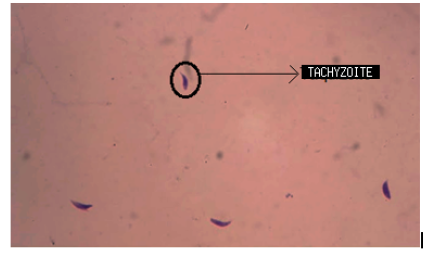
We obtained images with tachyzoites of stained T. gondii to develop the automatic quantification computational algorithm. Initially, images were obtained with the maximum concentration of the T. gondii tachyzoites (Fig. 1a). Different dilutions of the tachyzoites were made, which finally allowed obtaining the ideal concentration for the development of the algorithm (Fig. 1b). Giemsa staining allowed to observe the structure and morphology of the tachyzoites (Fig. 1c). The tachyzoite of T. gondii has a crescent shape, with a size of approximately 2 x 6 _m (Fig. 1d). This stage has a slightly more pointed anterior end, which is defined by the direction of motility [23]. The parasite phenotype associated with shape and size is a relevant feature in image processing, so they are considered evaluation attributes in segmentation processes (Fig. 2).
Figure 1: Stained T. gondii images with Giemsa. a) Maximum tachyzoite concentration b) 1,5 dilution factor of the tachyzoites c) Tachyzoite morphology d) Size of different tachyzoites
Figure 2: Application of staining protocol Table I. Protocol parameters
Samples and image digitalization
An experimental protocol was standardized, which included the conditions for the preparation of the sheets, the dilution factor, the concentration of the Giemsa reagent, and the volume of the sample fixed in the sheets. This protocol guaranteed to obtain images with the requirements established for the computational algorithm.
This process was necessary because there is no standardized experimental protocol for obtaining these images in the literature. As a final result, the experimental conditions were obtained (Table I), under which the images that were analyzed by the computational algorithm were obtained.
Table I: Protocol parameters

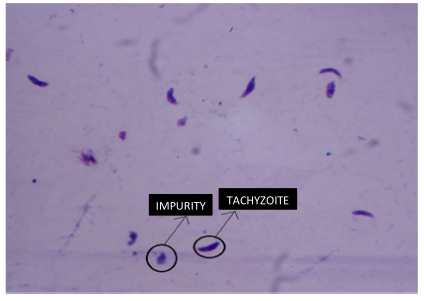
Figures 2 and 3 represent two out of 100 images in total that were obtained under the final conditions mentioned in Table I, and which were subjected to digital processing using the computational algorithm. During sample treatment, which involves the elimination of the culture medium, washing, and corresponding chemical staining, particles or impurities with similar morphology to the tachyzoite of the parasite may appear in the final sample. These impurities appear as a product of the same experimental process of pretreatment of the biological sample, given that the cell forms are in suspension with a medium that provides them with the conditions required to maintain their cellular functionality. These particles are presented randomly in each obtained image. Fig. 3 shows tachyzoites and some similar impurities. These elements must be discarded by the counting algorithm. It should be noted that 25 images were used for algorithm calibration, and the remaining 75 were used for the validation process.
Figure 3: Differences between tachyzoites and non-tachyzoites
Image processing
Once the image was loaded into the computational algorithm, it was necessary to perform a preprocessing of the images. The image had to be converted from RGB to gray scale. It is important to highlight that it was taken on the green channel, which was exclusively selected because we observed that the tachyzoites in the background of the image stood out there (Fig. 4). The contrast was 180 in the original image, 201 in the green channel, 185 in the red channel, and 142 in the blue channel. This is very important because it allowed to perform thresholding and subsequent binarization.
Figure 4: Channel comparison. a) RGB image. b) channel G. c) channel R. d) channel B.
The image was binarized by selecting a threshold value of 0,346. This value was determined from the histograms by calibrating the algorithm (trial and error) to easily identify the tachyzoites and guarantee that it did not eliminate any tachyzoites in the image. Next, morphology filters were executed to reduce image noise as described in section 2.3.3.
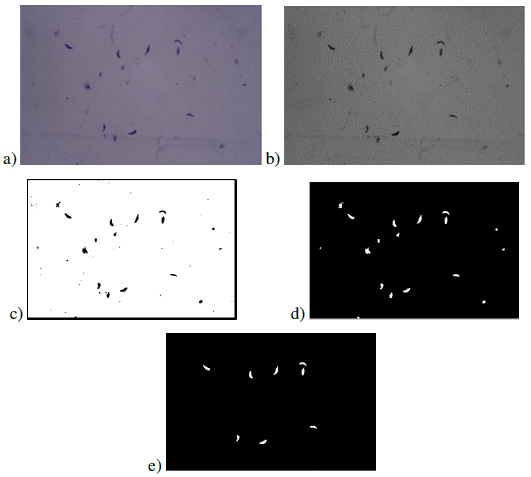
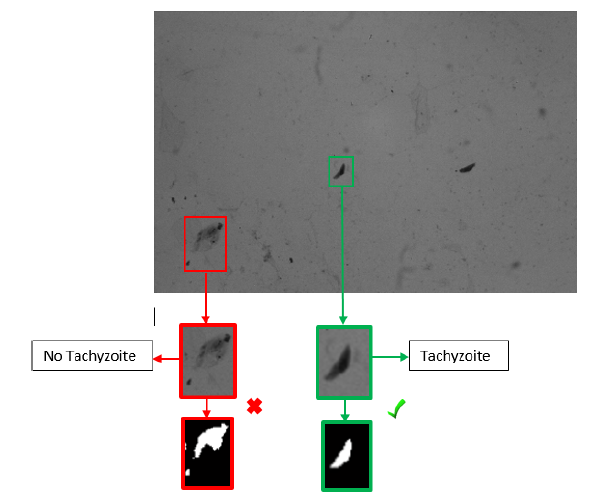
Fig. 5 shows the result of the preprocessing and segmentation described in the methodology. Table II shows the results of the discriminant characteristics of the morphology of the T. gondii tachyzoites. The algorithm recognizes the tachyzoites present in the image with the characteristics of area, eccentricity, and major axis. These characteristics are discriminant and sufficient thanks to the specific morphology of the tachyzoites in question. These characteristics allow distinguishing the tachyzoites from the non-tachyzoites present in the obtained images (Fig. 6). The intervals of the characteristics were evaluated several times by means of a calibration done with 25 images of the tachyzoite sheet.
Figure 5: Image processing results: a) original image, b) channel G, c) threshold result, d) applying morphological filter, e) classified tachyzoites
Table II: Discriminatory characteristics

Figure 6: Tachyzoite classification by algorithm
Validation
75 images were used for the validation of the algorithm. Three experts counted the tachyzoites independently in each image. The histogram (Fig. 7) shows the frequency of the number of tachyzoites per image obtained by each of the experts.
Figure 7: Histogram of tachyzoites counted by experts (per image)
Our algorithm also performed the tachyzoite count in all 75 images. Fig. 8 compares the results obtained by the algorithm and the experts in some of the images used for validation. With the individual tachyzoite count per image, it was possible to determine the total tachyzoites in the images (Fig. 9).
Figure 8: Comparison between average manual count and automatic count
Figure 9: Total tachyzoites counted
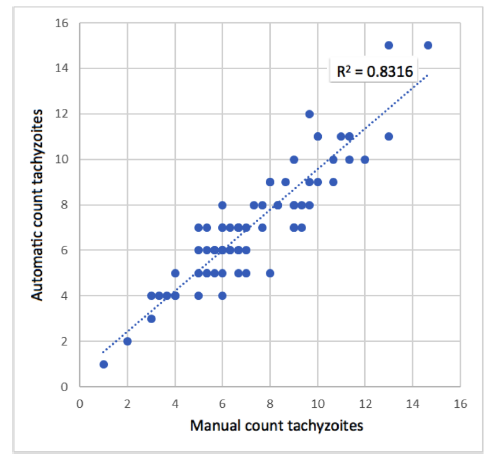
The average of the count of the 3 experts (manual count) in each image was used as the true value to be compared with the result of the algorithm (Fig. 10). With this data, the correlation between the manual count and the one made automatically by the algorithm was determined with a Pearson correlation coefficient r = 0,91. This indicates that the correlation is statistically significant (p-value = 0,00001), and the model (computational algorithm) could be used to estimate the number of tachyzoites automatically.
Figure 10: Scatter plot between manual count and automatic count
With the data provided by the experts, it was possible to determine the number of true positives (Tp), true negatives (Tn), false positives (Fp), and false negatives (Fn) (Table III). False positives refer to elements in the that are misclassified as tachyzoites, that is, tachyzoites that do not exist in the image but are recognized and counted by the algorithm. False negatives are tachyzoites that are not recognized or classified as non-tachyzoites by the algorithm; they are therefore not counted.
Table III: Confusion matrix

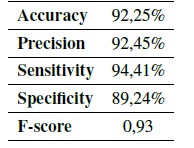
Using the Eqs. (1) - (5) the performance of the algorithm was determined, obtaining the results in Table IV.
Table IV: Algorithm validation
Discussion
Nowadays, different types of software and algorithms dedicated to the identification and automatic quantification of parasites have been developed. However, due to the biological development of each microorganism, there are phenotypical variations, which implies considering particular characteristics in the identification of each species. For this reason it, is important to develop of computational tools that respond to the needs of the diagnosis and detection of each type of pathogen.
We developed and validated an algorithm for the automatic quantification of T. gondii tachyzoites in images. The validation of the algorithm was carried out by comparing the results obtained from manual counting.
Fig. 7 shows that there are differences between the counts made by the different experts. This difference in the number of tachyzoites per image is usually greater when there are more tachyzoites in the image. Some bars in Fig. 8 show a greater dispersion due to the large number of tachyzoites, which proves that human experts can make mistakes of a certain tolerance.
The accuracy of the algorithm was 92,25% (Table IV), which indicates that the quantification obtained by the computational algorithm is close to the average value of the quantification obtained by the experts (Fig. 9).
The precision of the computational algorithm was one of the measurement parameters selected for the validation of the algorithm. It indicates the dispersion between the data obtained during the automatic count, and it is represented as a function of the standard deviation (Table IV). The result obtained for precision was 92,45%, which representing a significant value for the computational algorithm and a large confidence interval.
Although Fig. 8 shows some differences between and manual counting per image, these data are within a close range. These differences decrease if a larger number of samples is taken (Fig. 9). Our computational algorithm allows to have fixed criteria for the identification and quantification of tachyzoites, making it possible for different studies to be compared if the same counting tool is used, thus eliminating the possible bias that may be due to human error. All this statistical analysis allows inferring that the computational algorithm is a reliable and precise tool for the quantification of T. gondii tachyzoites.
In our algorithm, images obtained with specific parameters and generated from a standardized experimental protocol were used. Therefore, we can infer that similar results are expected when replicating the parameters described both for the treatment of the biological sample and for obtaining the images.
Furthermore, the running time of the algorithm is not susceptible to the number of tachyzoites in image, which is approximately 5 seconds per image. However, manual counting has a stronger effect on the time; more tachyzoites in the image require more time to count, and the error can be greater.
[24] reported a new method for the identification of T. gondii tachyzoites by recognizing the specific morphology of the banana or crescent-shaped parasite, with results comparable to those obtained by our algorithm. Our computational tool allows identifying the shape of the tachyzoite and exclude those objects present in the image that do not correspond to the morphology of the parasite. Furthermore, our images were obtained using a simple and practical chemical staining method, which is implemented as a detection method in laboratories in developing countries.
Other studies report images analysis methods of T. gondii by determining host-pathogen interaction [25]. Likewise, automatic quantification studies are reported for other parasitic pathogens, [1] reported a computational tool called INsPECT, a versatile and open source software for the automated quantification of intracellular parasites (Leishmania), which is proposed as a new, fast, and easy alternative to the classical intracellular quantification methods. [18] also reported an automated image analysis protocol for the quantification of intracellular forms of Leishmania spp, by means of the IN Cell Investigator Developer Toolbox, a program that identifies individual macrophages and amastigote forms of the parasite within the host cell.
Another work related to image processing reports the characterization of biological forms for the automatic recognition of images and diagnosis of protozoan parasites of the Eimeria genus; a mathematical model was developed to characterize the morphology of the oocysts of this parasite [26].
Our method for the analysis of images of T. gondii tachyzoites can become a low-cost diagnostic tool. Additionally, our automatic counting model can be extended in its use to be potentially used in the identification of the bradyzoite state of the same parasite, considering that the morphology is similar to that of the tachyzoite, which the algorithm more versatile.
Conclusions
In this work, we have developed and validated an algorithm for the automated count of tachyzoites of T. gondii in images. This method is based on the attributes of tachyzoites regarding morphology and size. We demostrated that the image processing method has a good correlation with manual counting by experts. Moreover, we showed that the execution time of the algorithm improved in comparison with by human observation. It also demonstrated its suitability to recognize the structure of tachyzoite and differentiate them from those particles that were present in the image but were not tachyzoites. This automated quantification tool allowed counting tachyzoites in tens of images. Additionally, the manual microscopic count of tachyzoites depends on the expert and requires time to analyze the images. This can be replaced by the use of this image processing algorithm, which analyzes conventional optical microscopy images generated with high quality, cheap, and easy-to-perform staining.
In summary, we have developed a specific and quantitative tool that can become an automatic quantification strategy for T. gondii tachyzoites in images. It is important to consider that the algorithm that we have developed was validated for the identification of the tachyzoite state of the T. gondii parasite, which has a specific morphology that was applied in the development of the computational tool. This algorithm was not validated in other stages of the biological development of the parasite. Furthermore, it is important to consider that the validation of the algorithm has been carried out on images obtained from culture samples with extracellular forms of the parasite.
Acknowledgements
Acknowledgments
We thank Barbara Zimmermann (BBMP Research Group, Universidad de los Andes, Colombia) for the samples of tachyzoites from the Toxoplasma gondii RH strain; Juan Miguel Escobar (Bioengineering Program, Universidad el Bosque, Colombia), who provided access to the Engineering Science laboratories; and Oscar Arias (Electronic Engineering Program, Universidad El Bosque, Colombia) for his advice on image processing.
References
License
Copyright (c) 2020 Graciela Juez Castillo, Brayan Alfonso Valencia Vidal, Karen Nataly Murcia Zapata, María Paurla Romero Cerón

This work is licensed under a Creative Commons Attribution-NonCommercial-ShareAlike 4.0 International License.
From the edition of the V23N3 of year 2018 forward, the Creative Commons License "Attribution-Non-Commercial - No Derivative Works " is changed to the following:
Attribution - Non-Commercial - Share the same: this license allows others to distribute, remix, retouch, and create from your work in a non-commercial way, as long as they give you credit and license their new creations under the same conditions.







2.jpg)
