DOI:
https://doi.org/10.14483/23448393.14678Published:
2019-05-26Issue:
Vol. 24 No. 2 (2019): May - AugustSection:
Systems EngineeringAnálisis Bibliométrico de la Revista Ingeniería (2010-2017)
Bibliometric Study of the Journal Ingeniería (2010-2017)
Downloads
References
A. Verma, S. K. Sonker, and V. Gupta, “A bibliometric study of the library philosophy and practice (e-journal) for the period 2005-2014,” Library Philosophy and Practice, no. 1292, 2015
K. Ramasamy and P. Padma, “Mapping the research output of “journal of bioscience and bioengineering”(2007-2016): A single journal scientometric study,” Library Philosophy and Practice, no. 1586, 2017
P. K. Das, “Journal of informetrics: A bibliometric profile,” DESIDOC Journal of Library & Information Technology, vol. 33, no. 3, 2013https://doi.org/10.14429/djlit.33.3.4610
K. Wan, U. Anyi, N. B. Anuar, and A. Zainab, “Bibliometric studies on single journals: a review,” Malaysian Journal of Library & Information Science,, vol. 14, no. 1, pp. 17–55, 2009
L. Serrano, A. Castro, and E. Bravo, “Análisis bibliométrico de una de las revistas con mayor impacto en el contexto de la enseñanza en ingeniería,” in Proc. Eleventh LACCEI Latin American and Caribbean Conference for Engineering and Technology, Cancun, Mexico, 2013
W.Wang, S. Laengle, J. M. Merigó, D. Yu, E. Herrera-Viedma, M. J. Cobo, and B. Bouchon-Meunier, “A bibliometric analysis of the first twenty-five years of the international journal of uncertainty, fuzziness and knowledgebased systems,” International Journal of Uncertainty, Fuzziness and Knowledge-Based Systems, vol. 26, no. 02,pp. 169–193, 2018 https://doi.org/10.1142/S0218488518500095
H. Zou, H. Du, Y. Wang, L. Zhao, G. Mao, J. Zuo, Y. Liu, X. Liu, and D. Huisingh, “A review of the first twenty-three years of articles published in the journal of cleaner production: With a focus on trends, themes, collaboration networks, low/no-fossil carbon transformations and the future,” Journal of Cleaner Production, vol. 163, pp. 1–14, 2017https://doi.org/10.1016/j.jclepro.2017.04.157
J. O. Suárez, “Análisis bibliométrico de la revista infectio, 1995 a 2011,” Infectio, vol. 16, no. 3, pp. 166–172, 2012 https://doi.org/10.1016/S0123-9392(12)70007-3
J. H. Ávila-Toscano, A. Marenco-Escuderos, and C. Madariaga Orozco, “Bibliometric indicators, coauthorship networks and institutional collaboration in colombian psychology journals,” Avances en Psicología Latinoamericana, vol. 32, no. 1, pp. 167–182, 2014 https://doi.org/10.12804/apl32.1.2014.12
I. Zupic and T. Cater, “Bibliometric methods in management and organization,” Organizational Research Methods, vol. 18, no. 3, pp. 429–472, 2015 https://doi.org/10.1177/1094428114562629
M. C. A. Gómez and J. O. Goñi, “Análisis bibliométrico y de contenido. Dos metodologias complementarias para el análisis de la revista colombiana Educación y Cultura,” Revista de Investigaciones UCM, vol. 14, no. 23, pp. 14–31, 2016 https://doi.org/10.22383/ri.v14i1.5
J. E. Hirsch, “An index to quantify an individual’s scientific research output,” Proceedings of the National
academy of Sciences of the United States of America, vol. 102, no. 46, pp. 16 569–16 572, 2005 https://doi.org/10.1073/pnas.0507655102
T. Braun, W. Glänzel, and A. Schubert, “A Hirsch-type index for journals,” Scientometrics, vol. 69, no. 1, pp.169–173, 2006 https://doi.org/10.1007/s11192-006-0147-4
L. Egghe, “Theory and practise of the g-index,” Scientometrics, vol. 69, no. 1, pp. 131–152, 2006 https://doi.org/10.1007/s11192-006-0144-7
A.-W. Harzing, The Publish or Perish Book. Tarma Software Research Pty Ltd, Australia, 2010
A. Sidiropoulos, D. Katsaros, and Y. Manolopoulos, “Generalized Hirsch h-index for disclosing latent facts in citation networks,” Scientometrics, vol. 72, no. 2, pp. 253–280, 2007 https://doi.org/10.1007/s11192-007-1722-z
S. A. Rojas, “In Defense of Factor h5* as an Impact Indicator (* according to Colciencias),” Ingeniería, vol. 22, no. 1, pp. 05–08, 2017 https://doi.org/10.14483//udistrital.jour.reving.2017.1.ne01
V. Batagelj and M. Cerinsek, “On bibliographic networks,” Scientometrics, vol. 96, no. 3, pp. 845–864, 2013 https://doi.org/10.1007/s11192-012-0940-1
S. Milojevic, C. R. Sugimoto, E. Yan, and Y. Ding, “The cognitive structure of library and information science: Analysis of article title words,” Journal of the Association for Information Science and Technology, vol. 62, no. 10, pp. 1933–1953, 2011 https://doi.org/10.1002/asi.21602
M. Aria and C. Cuccurullo, “bibliometrix: An R-tool for comprehensive science mapping analysis,” Journal of Informetrics, vol. 11, no. 4, pp. 959–975, 2017 https://doi.org/10.1016/j.joi.2017.08.007
K. Subramanyam, “Bibliometric studies of research collaboration: A review,” Information Scientist, vol. 6, no. 1, pp. 33–38, 1983 https://doi.org/10.1177/016555158300600105
I. U. Rajgoli and A. Laxminarsaiah, “Authorship pattern and collaborative research in the field of spacecraft technology,” The Electronic Library, vol. 33, no. 4, pp. 625–642, 2015 https://doi.org/10.1108/EL-12-2013-0210
G. Shang, B. Saladin, T. Fry, and J. Donohue, “Twenty-six years of operations management research (1985–2010): authorship patterns and research constituents in eleven top rated journals,” International Journal of Production Research, vol. 53, no. 20, pp. 6161–6197, 2015 https://doi.org/10.1080/00207543.2015.1037935
C. Velmurugan and N. Radhakrishnan, “Quantitative analysis of scientific publications output on engineering journal: A scientometric study,” Journal of Information Sciences and Application, vol. 3, no. 1, pp. 19–30, 2015 https://doi.org/10.18034/ei.v3i2.773
A. K. Bandyopadhyay, “Authorship pattern in different disciplines,” Annals of library and information studies, vol. 48, no. 4, pp. 139–147, 2001
A.-W. Harzing and R. Van derWal, “Google scholar as a new source for citation analysis,” Ethics in science and environmental politics, vol. 8, no. 1, pp. 61–73, 2008 https://doi.org/10.3354/esep00076
A. Pavas, “Ranking of colombian scientific journals: Engineering case,” Ingeniería e Investigación, vol. 35, no. 3, pp. 3–4, 2015. [Online]. Available: https://revistas.unal.edu.co/index.php/ingeinv/article/view/54609https://doi.org/10.15446/ing.investig.v35n3.54609
How to Cite
APA
ACM
ACS
ABNT
Chicago
Harvard
IEEE
MLA
Turabian
Vancouver
Download Citation
Recibido: 4 de abril de 2019; Revisión recibida: 10 de mayo de 2019; Aceptado: 20 de mayo de 2019
Resumen
Context:
Ingeniería is a scientific journal edited in Colombia by Universidad Distrital Francisco José de Caldas, publishing multi-disciplinary research across all fields of engineering. The aim of this paper is to conduct a bibliometric analysis of its scientific output during the period 2010-2017.
Method:
A corpus of 144 published papers were examined, their bibliographic metadata collected, and several bibliometric analysis were conducted, including productivity, authorship, citation, subject and geographic coverage, along with collaboration networks, thematic conceptual maps and impact metrics.
Results:
Some of our findings include: the average citations per article is 2.1, the collaboration index is 2.22, the output growth rate is 19 %, h-index of h = 10, g-index of g = 13, hi5-index of hi5 = 9, total cites are 298, there are 10 strongly connected cluster of authors, and 4 thematic clusters obtained from co-ocurrence analysis of the keywords and abstracts.
Conclusions:
The profile of the journal regarding citation and impact metrics is promising, although it needs to improve its visibility and recognition, as locality of coverage and authorship metrics as well as incipient thematic areas seem to suggest. Extending its authorship base to broader collaboration networks is also desirable.
Keywords:
Bibliometrics, scientific production, impact measures, bibliographic networks, Language: English.Resumen
Contexto:
Ingeniería es una revista científica editada en Colombia por la Universidad Distrital Francisco José de Caldas, que publica investigación multidisciplinaria en todos los campos de la ingeniería. El objetivo de este trabajo es realizar un análisis bibliométrico de su producción científica durante el período 2010-2017.
Método:
Se examinó un corpus de 144 artículos publicados, se recopilaron sus metadatos bibliográficos y se realizaron varios análisis bibliométricos, incluidos productividad, autoría, citas, cobertura geográfica y temática, redes de colaboración, mapas conceptuales temáticos y métricas de impacto.
Resultados:
Entre los resultados se encuentran: promedio de citas por artículo de 2.1, índice de colaboración de 2.22, tasa de crecimiento de publicación es 19 %, h-index de h = 10, g-index de g = 13, hi5-index de hi5 = 9, el total de citas es de 298, hay diez grupos de autores muy conectados y cuatro grupos temáticos obtenidos a partir del análisis de coincidencia de las palabras clave y los resúmenes.
Conclusiones:
El perfil de la revista con respecto a citaciones e impacto es prometedor, aunque requiere mejorar su visibilidad y reconocimiento, ya que las métricas de cobertura, autoría y áreas temáticas, parecen incipientes. También es deseable ampliar las redes de colaboración de su base de autores.
Palabras clave:
bibliometría, producción científica, métricas de impacto, redes bibliográficas..1. Introduction
Bibliometric studies are useful tools to reveal the scientific profile of an scientific journal [1]-[3], allowing to conduct a critical appraisal of bibliographic patterns and impact metrics within an unbiased, systematic and reproducible analysis. A bibliometric study may encompass both descriptive statistics of bibliographic content and network analysis of co-ocurrences of bibliographic units of information. As a result, bibliometrics can be think of as a new tool for editors and editorial boards to identify trends and caveats regarding topic coverage, authorship dynamics, citation impact, collaboration networks, evolution of themes of interest, and visibility and recognition of their journals.
The findings of a bibliometric study may also serve as guidelines for readerships and authors to easily discover strengths and potential of a journal. With these aims in mind we conducted a study on Ingeniería, a scientific journal edited in Colombia by Universidad Distrital FJC that publishes multi-disciplinary research across all fields of engineering. A brief description of the journal is provided.
1.1. Aims of the study
This study was conducted in order to reveal the bibliometric profile of Ingeniería journal output during the period 2010-2017. The aim is to discover the structures and dynamics underlying the research published by the journal from three complementary viewpoints: productivity analysis, citation analysis and network analysis. It is expected that the findings may become useful information and guidelines for the journal’s editors, authors and readers alike. Specifically, the following aims were pursued:
-
To obtain descriptive statistics of the journal output during the period of study and year-wise.
-
To study the authorship pattern, leading contributors, institute distribution and geographic covering.
-
To study subject coverage of the journal.
-
To obtain average number of references per article, most referenced works, impact indexes and citation scores for the journal.
-
To identify origin and distribution of referenced works.
-
To extract collaboration networks among authors and institutions.
-
To discover thematic and concept coverage of the journal.
1.2. Related work
Several studies have been reported recently focusing on bibliometric analysis of scientific journals. Among the topics considered, they examine metrics of authorship patterns, citation, countries, institutions, collaboration trends, research areas, impact, visibility and productivity. The advantages of undertaking bibliometric studies on single journals to reveal insights about its research output was highlighted by [4], reporting a comprehensive review of 82 bibliometric studies carried out on single journals across fields such as Social, Medical and Information Sciences. Although studies related with Engineering Sciences are scarce, one example we can mention is the study about the Journal of Engineering Education [5] that resulted in the identification of its main areas of research. Similarly, a study on the Journal of Informetrics [3], revealed metrics of degree of collaboration, yearly distribution of contributions, authorship patterns and collaborative networks of authors and institutions.
Likewise, other studies intended to analyse productivity and impact have been conducted, such as the one on the Journal of Bioscience and Bioengineering [2], that found prolific contributors, a high degree of collaboration, and temporary dynamics of publication. Other techniques emphasising on networks and couplings of bibliometric variables have been reported for the Journal of Uncertainty, Fuzziness and Knowledge-Based Systems [6]. Additional studies in the field of engineering can be found in recent years; for example a paper on the Journal of Cleaner Production [7] characterized different topics were papers published are grouped according to their affinity.
With respect to more concrete bibliometric studies of scientific journals in Colombia, we can mention the one for the Journal of Infectology [8], and the study of six Colombian psychology journals [9], that discovered networks of scientific collaboration among authors and institutions. We found no further evidence of studies applied to specific engineering journals.
2. Materials and methods
2.1. Method
In conducting this study we followed the steps suggested by [10], as depicted in the flow chart of Figure 1. The design step defined the aims of the study, the availability/quality of the data and the choice of research tools. The collection step involved identifying the data sources, and then constructing and cleaning the dataset. The analysis considered two approaches: bibliometric content evaluation and network analysis. Visualisation of results was made according to each type of analysis, including statistical plots, tables and network maps. Interpretation of these results yielded the conclusions and recommendations included at the final sections of the paper.
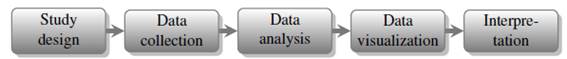
Figure 1: A flowchart of the steps conducted in this study.
2.2. Data collection
We downloaded the metadata of each of the 144 manuscripts published in the journal during the period 2010-2017 period from its website, and prepared a dataset following the Scopus format for the following items: author, title, volume, year, keywords, abstract and references. Additionally we manually collected authors’ affiliation, manuscript type (Editorial Note, Research, Review, Methodology and Case report), country of origin and number of cites. The reliability of the collected data was verified using Google Scholar to validate and curate duplicated citations. Besides, the data was cleaned from typos, repeated or joined words, and symbols not recognised by the standard ANSI UTF-8 encoding.
2.3. Bibliometrics analysis
We considered quantitative bibliometrics variables [11] in order to assess productivity and visibility of the journal. In particular we studied diachronic scientific production, author productivity, extent of authors collaboration, institutional contribution, subject and geographic coverage, along with citation analysis, involving citation account and usage. Besides, we also examined the quality/impact metrics defined below:
-
h-index. Originally proposed as a metric of productivity and quality of the research output of an individual scientist [12], the h-index can be adapted to measure likewise the impact of a scientific journal [13], by counting the number of h most-cited papers in its publication corpus which have been cited at least h times each.
-
g-index. In contrast to the h-index, this metric assess the impact of a publication corpus by considering the cumulative contribution of every paper within; it corresponds to the number g of most cited papers, such that altogether sum up no less than g2 citations [14]. In this way, highly-cited works offset the performance of lesser-cited papers, thus increasing the overall impact; in fact, h is a lower bound on g.
-
hI,norm. This metric is similar to the h-index but corrected for the number of co-authors for each paper in the collection [15]; therefore, it firstly normalises citations by the number of authors, and then computes h using these modified, “individualised” contributions, as if cites were split equally among co-authors.
-
hI,annual. This is hI,norm averaged over the yearly duration of the observation period (see also [15]).
-
hc-index. A “contemporary” version of the h-index; it scales the citations of the corpus proportionally to a factor of 4 over the age of each paper, as defined by [16]
-
h5-index. An alternative to measure the contemporary impact of a publication record is to constrain the h-index to those papers published within the previous 5 years.
-
hi5-index. In order to measure contemporary impact, we propose to restrain the citation date, instead of the publication date, to an observation window of the most recent 5 years. Our rationale is that there may exist papers in the corpus published behind the 5 year mark, still accruing contemporary citations (think of seminal or position papers). Those papers may induce an h impetus despite their age, hence we term this new metric hi5-index (originally suggested in [17]). The metric is computed likewise h5, but counting the number of cites a paper accrues in the previous 5 years, irrespective of its publication date. In this way, the hi5-index trades-off modernity and obsolescence in a single impact estimate for a given publication corpus.
Additionally, we performed a network analysis of bibliographic variables, following the approach introduced in [18]. These bibliographic networks are interesting tools to find patterns of co-occurrences suggesting the structure and dynamics of the scientific production of the journal. We studied the following networks:
-
Author collaboration. A co-authorship network where the nodes are authors whilst edges connect co-authors of a collaborative paper. The weights of the edges correspond to the number of co-authored works.
-
Keyword co-occurrence. A network of keywords where two nodes are connected each time they both appear as index terms of a paper within the corpus.
-
Word co-occurrence. A network of words where two nodes are connected each time they both appear in the abstracts of the papers in the corpus.
-
Conceptual mapping. The links between groups of words found with the aforementioned co-occurrence networks, may suggest the existence of common aspects of research themes or shared interests [19]; an analysis of such clusters along with their projection onto a plane, would yield a conceptual map of principal topics of research addressed in the journal. We shall use Multidimensional Scaling and k-Means Clustering to carry out such analysis and visualisation, as suggested by [20]
2.4. Tools
We carried out this study using the following bibliometric tools:
-
Harzing’s Publish-or-Perish (PoP, version 6.30.6209, release date: October 20, 2017) is a free software tool that retrieves and analyzes academic citations from a variety of data sources including Google Scholar and Google Scholar profiles. It is able to obtain citation statistics as well as more sophisticated bibliometric indexes [15].
-
The bibliometrix package (version 1.9.2, release date: March 28, 2018) from the R-studio suite (R version 3.3.0) was used to perform science mapping analysis [20];
-
Further validation of citation counts along with computation of the new hi5-index was made through manual inspection of the Google Scholar profile of the journal1.
3. Results & Discussion
We begin by reporting descriptive results of the productivity and visibility bibliometrics, then we move on to citation and impact metrics, and lastly we discuss the findings of our bibliometric network analysis.
3.1. Productivity analysis
Table I shows a summary of the main bibliometric statistics obtained for the observation frame. A total 144 manuscripts were published during said period, most of them (110) are multi-authored, yielding a degree of collaboration of 0.77 (i.e, the proportion of multi-authored papers with respect to the total published papers, see [21]). These corpus has accrued 298 cites (as of April 12/2018), an average 2.07 cites per article.
Table I: Descriptive bibliometrics summary.
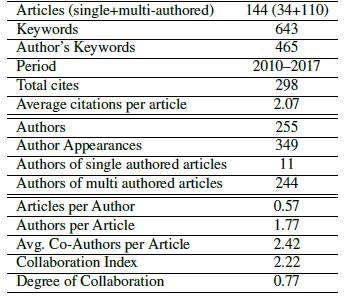
With respect to authorship, our analysis found a total 349 authors (255 of them are unique, implying that the journal attracted approximately 32 new authors per year). Only 11 authors published individually, the remainder 244 authors contributed as a team; this corroborates the predominant collaborative vs. solo research effort that has been reported elsewhere in relation to disciplines of the exact and applied sciences (see e.g. [22]-[25]). The average number of authors per paper is 1.77, whereas in average each author contributed 0.57 papers.We computed the collaboration index of 2.22, as the ratio of authors over articles of multi-authored papers only (as defined in [20]).
On the other hand, the journal exhibits a growing trend in its annual scientific production, as it can be seen in Figure 2, particularly since 2015 when it changed its publishing frequency to three numbers a year. The annual growth rate stands at 19 %. The distribution of the different types of published manuscripts is shown in Figure 3 (Research, Case Report, Review, Perspective, Methodology and Editorial Note, see B for a description of each type); clearly Research articles are thNe opwrimwaerislyhaclolnetxriabmuitnioeni.n detail the contribution of authors. Table II shows the most productive authors listed in terms of number of papers authored, as well as fractional authorship (papers normalized by number of co-authors).
Table II: Most productive authors.
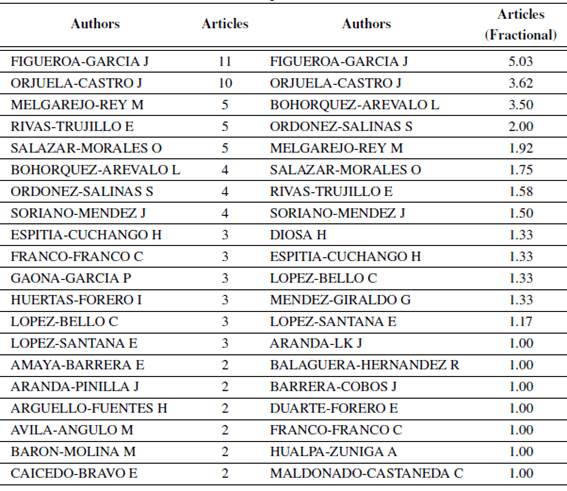
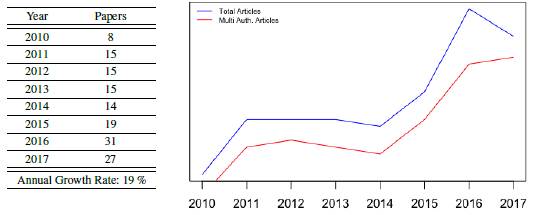
Figure 2: Annual scientific production
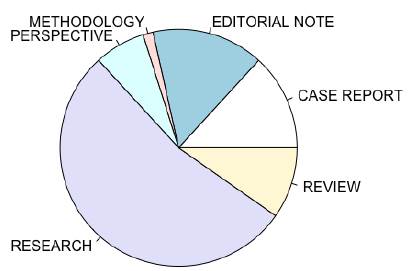
Figure 3: Distribution of published papers per manuscript type
It can be seen that only the first 15 authors have contributed three or more papers, implying that the remainder largest proportion are authors contributing only two or one paper (10% and 84% resp., 94% in total). Therefore the distribution of author productivity for the journal in the observation frame is leptokurtic and skewed with mode = 1, with only a few as 10 to 15 authors producing a noticeable proportion of papers, whereas the bulk of published papers are from different authors contributing on single occasions. In addition, a majority of the most prolific authors (top 12 rows in either column) are affiliated to the journal’s editorial institution (Universidad Distrital FJC).
On the other hand, Table III summarises countries of origin of the contributions. It is organized by: (a) Per author occurrence, which accounts the country of every appearance of an author in every paper; and (b) Per correspondence author, which only considers the country of the first author affiliation, assuming it corresponds to the originator of the contribution. Here, in both cases, it is clear that the most frequent contributor country is Colombia (95 %). There have been a smaller noticeable proportion of authors from Brazil, but the presence of other Latin American countries in the journal, is barely marginal.
Table III: Most productive countries

With regards to author affiliations, Figure 4 shows the distribution of contributing institutions. It can be seen that the most frequent institution is Universidad Distrital FJC (the journal’s editorial institution) with 199 authors (55 %). The subsequent most frequent are Universidad Nacional de Colombia with 13 authors (3,6 %), Universidad Católica de Colombia with 9 authors (2,5 %), followed by Universidad Industrial Santander, Universidad Javeriana, Universidad de los Andes and Universidad Militar Nueva Granada, with 8 authors (2,2 %) each; behind are Universidad del Valle with 7 authors (2 %) and Universidad del Cauca with 5 (1.8 %). The remainder 81 authors are affiliated to other institutions (23%).
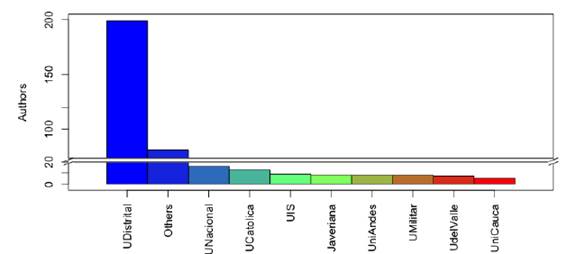
Figure 4: Distribution of authors’ affiliations.
We observe that from the nine previously mentioned most frequent institutions, 70% are public universities, a number suggesting there exists an affinity with them because of the journal being edited also by a public institution; alternatively, it may also indicate that strong collaboration links have arisen between researchers across multiple public universities.
Moreover, from this group of nine most frequent institutions, 30% are private universities, which incidentally are widely recognised as high-quality research institutions in the country; this is a good indication about how visibility of the journal is growing on such institutions, although it also implies further efforts are needed to keep attracting contributions from this potential audience. Lastly, we remark that the total contribution of institutions other than Universidad Distrital FJC sums up to 45 %, implying that the journal is attempting to balance evenly the publication of endogenous and exogenous authors.
Let us close this section with an analysis of the keyword summary shown in Table IV. When looking at the author’s defined keywords (Table IVa) there are not predominant thematic areas of research, as the most repeated keywords are found in as few as only three (3) papers out of the 144 in total. This is explained mainly because the journal does not enforce the use of thesaurus or standard categories descriptors for keywords in the papers that it publishes. Thus, it is possible that although multiple papers may be focusing in similar themes, their keywords do not coincide, because the authors use different descriptors defined in their own proper terms.
Table IV: Most relevant keywords.
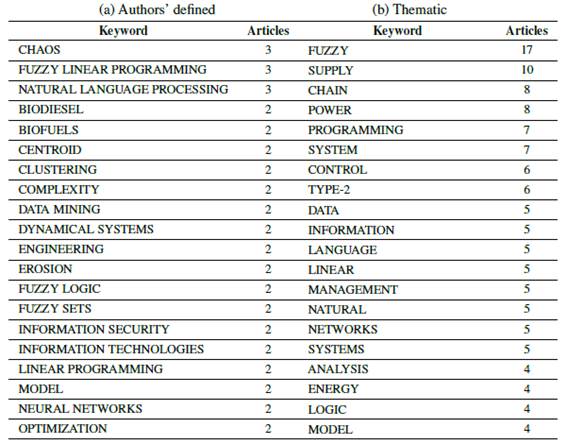
Now, from a different perspective, by scanning unigram vocables in the keywords, broader thematic terms can be identified (Table IVb). There the most predominant themes correspond to (in proportion): fuzzy (13,4 %), supply chain (8.0% and 6.4 %, resp.), power (6.4 %), programming (5.6 %), systems and control (5.6% and 4.8 %, resp.) and lastly, data and information (both 4 %).These would correspond to the core research thematic areas of the journal during the observation frame.
3.2. Citation analysis
We begin this analysis by summarising the results of the impact metrics shown in Table V. The upper section of this table reports the results obtained with the PoP software tool.We recall that the tool may choose between two different sources of information: Google Scholar (GS) and Google Scholar Profile (GSP). The former computes bibliometric statistics using all the data available that Google’s crawl engine can collect from the Web, whereas the latter computes the same statistics but from the GS Profile webpage administered by the journal itself (consequently the information found in such profile is more reliable, as it ought to be curated by the journal editorial team). Therefore it is observed that the descriptive bibliometrics (citations, citations per year, citations per paper and citations per author) obtained higher values in GS than in GSP, although the differences are not noteworthy; take for example the number of citations (398 vs. 379) which is greater in GS than in GSP2 .
Table V: Citation impact results.
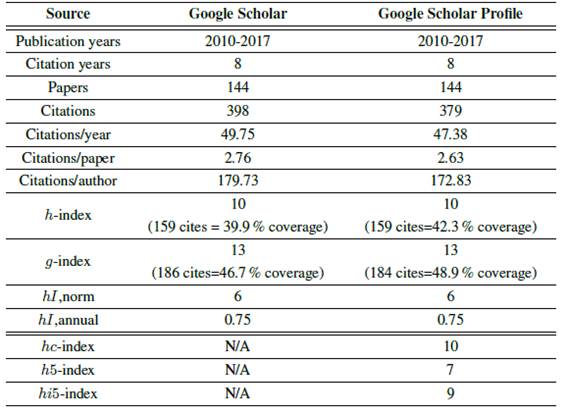
So, let us focus now in the results of the impact metrincs (h-index, g-index, hI-norm, hI-annual). The value of h = 10 means that most of the impact of the journal is concentrated in 10 papers that have been cited at least 10 times, altogether covering a 42.3% of the total cites. In contrast, the value of g = 13 widens the concentration of the journal impact up to 13 articles, receiving 184 accumulated cites (184 _ 132), a 48.9% coverage of the total cites.
On the other hand, the hI,norm index corrects the h-index to a lower value of 6, accounting for the average number of authors per paper reported previously in Table I. As a side effect of the above, the hI,annual index indicates that the journal is publishing less than one impactful article per year (0.75), normalised according to the average auhors per paper.
In the bottom part of Table V we can see and compare the results of the contemporary impact metrics: hc-, h5- and hi5-indexes. These were computed from the information only on the GS Profile of the journal (see Appendix A for further details of how these indexes were computed). Here we remark that the first two metrics adjusted the original h = 10 to indicate that contemporary citation score of the journal (in the last 5 years) is concentrated in only ten or seven papers, respectively (hc = 10; h5 = 7). In contrast, the hi5 index identifies nine papers with high citation activity (hi5 = 9), an indication that some older papers are still accruing citations for the journal in the same contemporary period.
In Table VI we observe some impact metrics of the most productive authors3 of Table II. These authors contributed 67% (96/144) of the total manuscripts published; besides, they account for 82% (245=298) of the total cites during the observation frame. The statistics for h and g indexes are the following: hmax = 6; havg = 1;9; hmode = 1 and gmax = 8; gavg = 2;3; gmode = 1; this indicates an evenly distribution of authorship impact, although still within amenable room for improvement.
Table VI: Impact metrics of most productive authors.

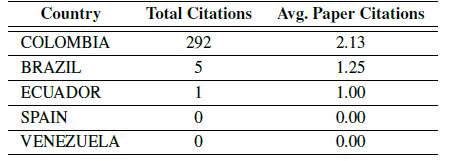
The most cited manuscripts are listed in Table VII. These top-20 manuscripts cover 61% of the total citations (183/298). Regarding the country of affiliation of the first author, Table VIII shows that the majority of these cites has been given to papers of Colombian authors (98% coverage).
Table VII: Top cited manuscripts
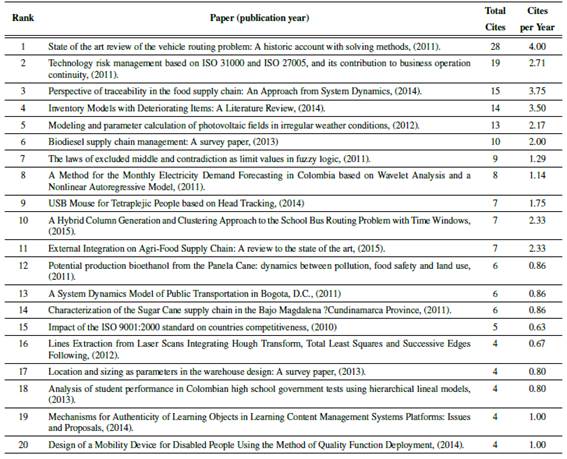
Table VIII: Total citations per country.
3.3. Network analysis
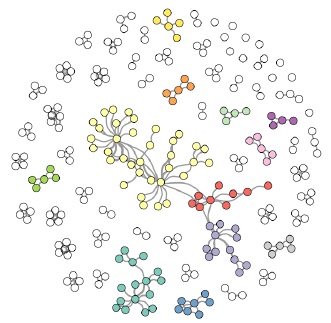
Figure 5 shows the author collaboration network of the journal during the observation frame. The network consists of 65 clusters where a central connected component can be identified (see Fig. 5a ), comprising three clusters of collaborating authors. Further nine connected components are also revealed, the remainder clusters being small cliques of co-authors of single papers and also a few isolated nodes corresponding to single-authored papers can be seen in the upper-right side of the network. A zoom-in on the main clusters of the network (Fig. 5b), reveals collaboration links between the most productive and most cited authors listed in Table II and Table VI, as expected.
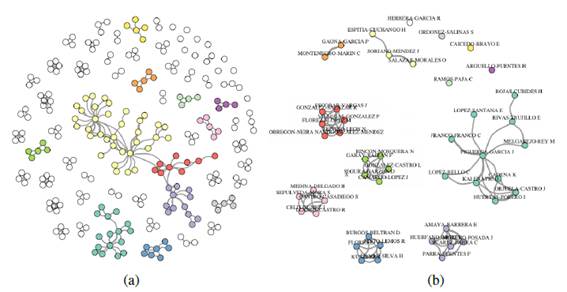
Figure 5.: Author collaboration network. (a) All-authors. (b) Top 40 authors.
Next we report two conceptual maps obtained from our co-occurrence analysis. The first one is the conceptual map of keywords shown in Figure 6. There we identified four thematic clusters: computational fuzzy methods (green), conventional topics (blue), social network and web engineering highly relevant current topics in engineering. The first one refers to fuzzy logic methods (green color), which have been studied for the importance they have in the solution of complex systems that may occur in production systems and decision making with uncertainty in computer intelligence systems. The second one is the cluster related to optimization and integration of the supply chains (yellow) which is currently important in terms of the sustainability of the means of production. The third one is a cluster associated with research in social networks and natural language processing (gray), a present day trend in systems engineering in relation to digital communication platforms and information search. Finally, the central cluster combines other conventional topics in engineering such as control systems, filters, data, quality and energy where none yet stands out in particular, a possible indication of the opportunity to strengthen these topics, for example, by launching special editions focusing on them.
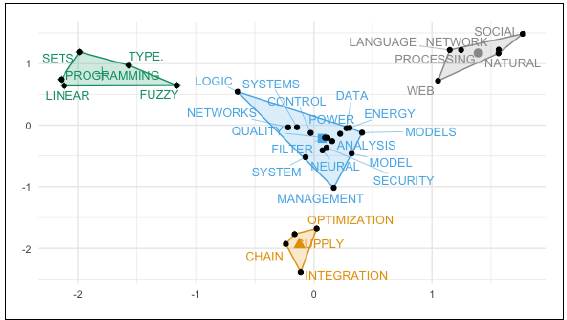
Figure 6: Conceptual map of paper’s keywords
Additionally we obtained a second conceptual map from co-occurrence of abstract terms, see Figure 7. In this map we highlight as broad topics of research within the journal the following: system characterisation (light yellow), model performance and tuning (light blue), energy studies (dark blue), management models and reviews (magenta). The remainder four clusters are associated to typical vocabulary used when describing and analysing results (grey, orange, red, and green). For example, the grey cluster correspond to words used as subheadings of the structured abstract adopted by the journal in 2015, hence the multiple repeated appearances in the abstracts published since that date. Therefore we infer such clusters can be ignored. Hence, the predominant clusters from abstract terms are related to the characterization of the systems (soft yellow) and the development of mathematical models (light blue), suggesting that there are studies of methodological sort, that is, characterization as a preliminary phase before starting with the proper formulation of the models. The cluster that references energy studies (dark blue) is also observed in a lesser proportion, this being an area that has awakened a lot of interest and attention in recent years due to the sustainability challenges that it requires nationally and internationally.
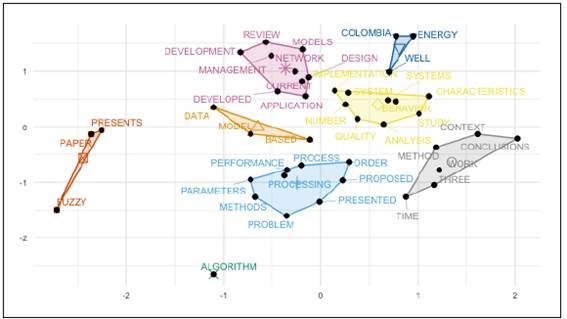
Figure 7: Conceptual map of paper’s abstracts
4. Conclusion
This study reveals an overall optimistic assessment of the evolution of the Ingeniería journal during the 2010-2017 observation frame. Regarding productivity, we found a clear growing trend of publications, from authors affiliated mostly to public universities and to a lesser extent from private widely-recognised universities. The geographic coverage is concentrated mainly in Colombia, although a few other Latin-American countries have made a number of contributions. Thus, there is room to improve the visibility of the journal in the region, mainly by seeking inclusion in international citation and bibliographic databases. Extending communication strategies to digital media such as social networks, microblogging and video news-bulletins, is also highly advisable, as nowadays researchers prefer most of these channels to keep up-to-date with the newly published literature.
On a different note, the study showed that description terms for keywords should be standardized in order to better cluster research topics. Nonetheless, the discovered conceptual maps suggest that the journal has developed specialised thematic niches (fuzzy logic, supply chains, energy studies, complex systems); given that the journal covers all branches of engineering the question arises if the journal should narrow its scope to these niches, or otherwise, if it should seek strategies to widen its publication topics, for example by appointing associate or invited editors and promoting calls for papers in other specialised areas.
Additionally, it is worth mentioning that impact metrics of the journal (h, h5, etc.) are comparable with other Colombian engineering journals4 although still incipient contrasted with international levels. Thus, additional efforts of the editorial team behind the journal are needed to consolidate its sustained impact on the local and international community. In this respect, we advocate for the responsible interpretation of impact metrics which should be applied as a multifaceted toolbox rather than a single decision variable used to evaluate a journal. In other words, considering only the impact factor or the h-index to assess the suitability of the state of a journal, and consequently the effort invested by the editorial team, authors and reviewers behind it, may yield inaccurate or misleading judgements.
Finally, we believe appropriate protocols and methods to guarantee transparent and objective journal assessment need further development, including a deeper analysis of existing or novel impact metrics and their meaning and implications. In fact, as a matter of future work we plan to validate within a cross-sectional study the potential benefits of the proposed hi5-index, as well as to address a feasible protocol to conduct bibliometrics within a open access framework.
A. Computation of hi5-index
Table IX illustrates how we computed the h, h5 and hi5 indexes. Citation counts for these three indexes were obtained from the GS profile of the journal. The table lists those papers with higher counts (we sorted them in decreasing order by hi5 value). In the case of the h-index (blue) cites were counted since the publication year of each paper. In the case of h5-index (green), cites were counted only for those papers published within the previous 5 years (2013-2017). Lastly, in the case of hi5-index (orange), all cites made within the previous 5 years (2013-2017) were counted, irrespective of publication year.
Table IX: Computation of h, h5 and hi5-indexes
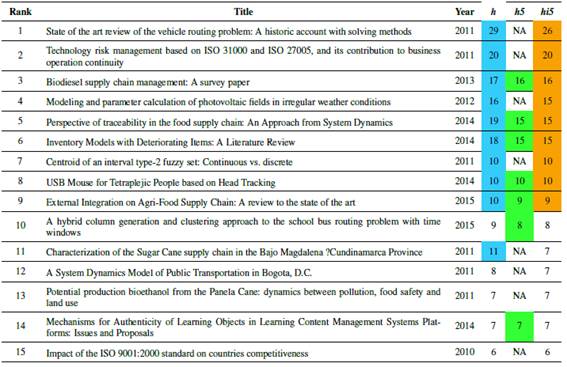
The final values correspond to the number of coloured cells that are greater or equal to the number of cites of the lowest coloured cell in the respective column (h = 10, h5 = 7, hi5 = 9).
B. Journal additional information
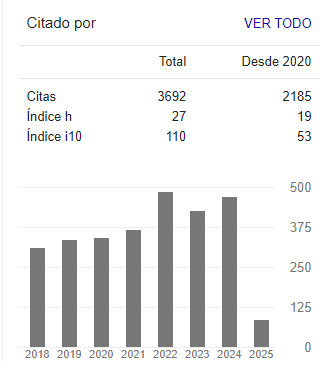
The citation history of the journal shows a growing trend since the beginning of 2010, as reported by Google Scholar (Figure 8). This behaviour coincides with a number of innovations taken by the journal editorial board aimed at improving the quality of its scientific content, as well as widening its coverage, visibility and recognition by its potential audience5. Some of such innovations include: enabling of an online content and peer-review managing system (2012); design of LATEX author templates (2013); issuing of periodical news bulletins (2015); adoption of structured abstract (2016); indexing in the following bibliographic databases: DOAJ (2016), EBSCO (2014), Google Scholar (2015), Redalyc (2017), Scielo (2015); finally, several editorial criteria have been revised to ensure higher standards of scientific dissemination: exogamous peer review and authorship (83% and 60% resp.), faster review response avg. 9 weeks), higher publishing frequency (3 issues a year) and anti-plagiarism screening on submission, among others. Finally, the journal accepts the following types of contributions6:
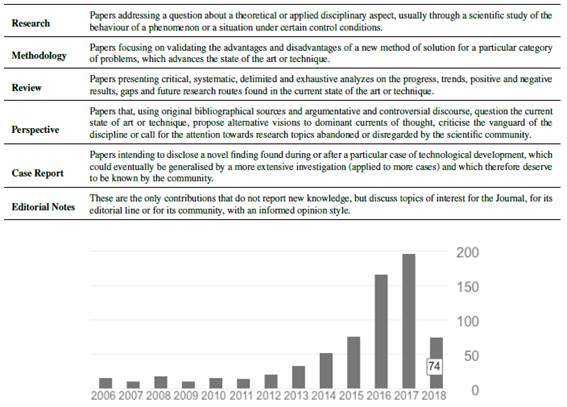
Figure 8: Citation record for the journal Ingeniería.
References
License
![]()
From the edition of the V23N3 of year 2018 forward, the Creative Commons License "Attribution-Non-Commercial - No Derivative Works " is changed to the following:
Attribution - Non-Commercial - Share the same: this license allows others to distribute, remix, retouch, and create from your work in a non-commercial way, as long as they give you credit and license their new creations under the same conditions.

2.jpg)