DOI:
https://doi.org/10.14483/23448393.20677Publicado:
2024-05-22Número:
Vol. 29 Núm. 2 (2024): Mayo-agostoSección:
Ingeniería biomédicaAutomated Breast Tumor Detection and Segmentation Using the Threshold Density Algorithm with Logistic Regression on Microwave Images
Detección y segmentación automatizadas de tumores de mama mediante el algoritmo de densidad de umbral con regresión logística en imágenes por microondas
Palabras clave:
Automatic Segmentation, Breast Tumor, Logistic Regression, Microwave Images, Threshold Density (en).Palabras clave:
segmentación automática, tumor de mama, regresión logística, imágenes por microondas, densidad de umbral (es).Descargas
Referencias
E. M. Proussaloglou et al., "Updates in the pathology of pregnancy associated breast cancer (PABC)," Pathol. Res. Pract., art. 154413, 2023. https://doi.org/10.1016/j.prp.2023.154413
T. H. Aldhyani et al., "Deep learning model for the detection of real time breast cancer images using improved dilation-based method," Diag., vol. 12, no. 10, art. 2505, 2022. https://doi.org/10.3390/diagnostics12102505
Z. Khandezamin, M. Naderan, and M. J. Rashti, "Detection and classification of breast cancer using logistic regression feature selection and GMDH classifier," J. Biomed. Inform., vol. 111, art. 103591, 2020. https://doi.org/10.1016/j.jbi.2020.103591
A. Najafian-Najafabady, N. Ebrahimi, and S. Vallian, "rs2682818/MiR-618 is a novel marker associated with increased risk of breast cancer in the Iranian population," Arch. Biol. Sci., vol. 73, no. 4, pp. 457–463, 2021. https://doi.org/10.2298/ABS210808039N
L. Wang, "Holographic microwave image classification using a convolutional neural network," Micromachines, vol. 13, art. 2049, 2022. https://doi.org/10.3390/mi13122049
M. A. Aldhaeebi et al., "Review of microwaves techniques for breast cancer detection," Sensors, vol. 20, no. 8, art. 2390, 2020. https://doi.org/10.3390/s20082390
S. Kwon and S. Lee, "Recent advances in microwave imaging for breast cancer detection," Int. J. Biomed. Imaging, vol. 2016, art. 5054912. https://doi.org/10.1155/2016/5054912
L. Wang, "Microwave imaging and sensing techniques for breast cancer detection," Micromachines, vol. 14, no. 7, art. 1462, 2023. https://doi.org/10.3390/mi14071462
N. AlSawaftah et al., "Microwave imaging for early breast cancer detection: Current state, challenges, and future directions," Journal of Imaging, vol. 8, no. 5, art. 123, 2022. https://doi.org/10.3390/jimaging8050123
L. Liu et al., "Automated breast tumor detection and segmentation with a novel computational framework of whole ultrasound images," Med.l Biol. Eng. Computing, vol. 56, pp. 183–199, 2018. https://doi.org/10.1007/s11517-017-1770-3
A. Melouah and S. Layachi, "A novel automatic seed placement approach for region growing segmentation in mammograms," in Proc. Int.l Conf. Intel. Info. Processing Sec. Adv. Comm., 2015, art. 51. https://doi.org/10.1145/2816839.2816892
N. Shrivastava and J. Bharti, "Breast tumor detection and classification based on density," Multimedia Tools App., vol. 79, no. 35-36, pp. 26467–26487, 2020. https://doi.org/10.1007/s11042-020-09220-x
A. A. Sandino Garzón and R. Herrera García, "Clustered microcalcifications candidates detection in mammograms," Ingeniería, vol. 24, no. 2, pp. 159–170, 2019. https://doi.org/10.14483/23448393.12512
A. Q. Al-Faris et al., "Breast MRI tumour segmentation using modified automatic seeded region growing based on particle swarm optimization image clustering," in Proc. 17th Online World Conf. Soft Computing Ind. App., 2014 pp. 49-60. https://doi.org/10.1007/978-3-319-00930-8_5
H. Shao et al., "A saliency model for automated tumor detection in breast ultrasound images," in 2015 IEEE Int. Conf. Image Proc. (ICIP), 2015, pp. 1424-1428. https://doi.org/10.1109/ICIP.2015.7351035
H. Rajaguru and S. K. Prabhakar, "Expectation maximization based logistic regression for breast cancer classification," in 2017 Int. Conf. Elec. Comm. Aerospace Tech. (ICECA), 2017, pp. 603-606. https://doi.org/10.1109/ICECA.2017.8203608
L. Khairunnahar et al., "Classification of malignant and benign tissue with logistic regression," Inform. Med. Unlocked, vol. 16, art. 100189, 2019. https://doi.org/10.1016/j.imu.2019.100189
M. Dey et al., "Automated breast lesion localisation in microwave imaging employing simplified pulse coupled neural network," PloS One, vol. 17, no. 7, art. e0271377, 2022. https://doi.org/10.1371/journal.pone.0271377
N. Saffari et al., "Fully automated breast density segmentation and classification using deep learning," Diagnostics, vol. 10, no. 11, art. 988, 2020. https://doi.org/10.3390/diagnostics10110988
T. Reimer, J. Krenkevich, and S. Pistorius, "An open-access experimental dataset for breast microwave imaging," in 2020 14th Eur. Conf. Antennas Propag. (EuCAP), 2020, p. 1-5. https://doi.org/10.23919/EuCAP48036.2020.9135659
T. Reimer, M. Solis-Nepote, and S. Pistorius, "The application of an iterative structure to the delay-and-sum and the delay-multiply-and-sum beamformers in breast microwave imaging," Diagnostics, vol. 10, no. 6, art. 411, 2020. https://doi.org/10.3390/diagnostics10060411
B. Abdollahzadeh and F. S. Gharehchopogh, "A multi-objective optimization algorithm for feature selection problems," Eng. Comp., vol. 38, no. Suppl. 3, pp. 1845–1863, 2022. https://doi.org/10.1007/s00366-021-01369-9
F. Ahmad et al., "A GA-based feature selection and parameter optimization of an ANN in diagnosing breast cancer," Patt. Analysis App., vol. 18, pp. 861–870, 2015. https://doi.org/10.1007/s10044-014-0375-9
W. Chen et al., "Density-based logistic regression," in Proc. 19th ACM SIGKDD Int. Conf. Knowledge Disc. Data Mining, 2013, pp. 140-148. https://doi.org/10.1145/2487575.2487583
R. Rodrigues et al., "A two-step segmentation method for breast ultrasound masses based on multi-resolution analysis," Ultrasound Med. Biol., vol. 41, no. 6, pp. 1737–1748, 2015. https://doi.org/10.1016/j.ultrasmedbio.2015.01.012
Cómo citar
APA
ACM
ACS
ABNT
Chicago
Harvard
IEEE
MLA
Turabian
Vancouver
Descargar cita
Recibido: 1 de abril de 2022; Aceptado: 5 de diciembre de 2023
Abstract
Context:
Breast cancer remains a major health burden worldwide, necessitating improved screening modalities for early detection. However, existing techniques such as mammography and MRI exhibit limitations regarding sensitivity and specificity. Microwave imaging has recently emerged as a promising technology for breast cancer diagnosis, exploiting the dielectric contrast between normal and malignant tissues.
Objectives:
This study proposes a novel computational framework integrating thresholding, edge segmentation, and logistic regression to enhance microwave image-based breast tumor delineation.
Methodology:
The employed algorithm selects optimal features using logistic regression to mitigate the class imbalance between tumor and healthy tissues. Localized density thresholds are applied to identify tumor regions, followed by edge segmentation methods to precisely localize the detected lesions.
Results:
When evaluated on a dataset of microwave breast images, our approach demonstrated high accuracy for detecting and segmenting malignant tissues. Density thresholds ranging from 0.1 to 0.8 showcase the highest accuracy in detecting breast tumors from these images.
Conclusions:
The results highlight the potential of the proposed segmentation algorithm to improve the reliability of microwave imaging as an adjunct modality for breast cancer screening. This could promote earlier diagnosis and better clinical outcomes. The proposed framework represents a significant advance in developing robust image processing techniques tailored to emerging medical imaging modalities challenged by class imbalance and low intrinsic contrast.
Keywords:
automatic segmentation, breast tumor, logistic regression, microwave images, threshold density.Resumen
Contexto:
El cáncer de mama sigue siendo una importante carga sanitaria a nivel mundial, lo que requiere mejores modalidades de cribado para la detección temprana. Sin embargo, las técnicas existentes, como la mamografía y la resonancia magnética, presentan limitaciones en cuanto a sensibilidad y especificidad. Recientemente, la imagen por microondas ha surgido como una prometedora tecnología para el diagnóstico del cáncer de mama, aprovechando el contraste dieléctrico entre los tejidos normales y malignos.
Objetivos:
Este estudio propone un novedoso marco computacional que integra el umbralizado, la segmentación de bordes y la regresión logística para mejorar la delimitación de tumores mamarios basada en imágenes de microondas.
Metodología: El algoritmo empleado selecciona las características óptimas utilizando la regresión logística para mitigar el desequilibrio de clases entre los tejidos tumorales y sanos. Se aplican umbrales de densidad localizados para identificar las regiones tumorales, seguidos de métodos de segmentación de bordes para localizar precisamente las lesiones detectadas. Resultados: Cuando se evaluó en un conjunto de datos de imágenes de microondas de mama, nuestro enfoque demostró una alta precisión para detectar y segmentar los tejidos malignos. Los umbrales de densidad que van desde 0.1 hasta 0.8 muestran la mayor precisión en la detección de tumores mamarios a partir de estas imágenes.
Conclusiones:
Los resultados resaltan el potencial del algoritmo de segmentación propuesto para mejorar la fiabilidad de la imagen por microondas como modalidad complementaria para el cribado del cáncer de mama. Esto podría promover un diagnóstico más temprano y mejores resultados clínicos. El marco propuesto representa un avance significativo en el desarrollo de técnicas robustas de procesamiento de imágenes adaptadas a las modalidades emergentes de imagen médica desafiadas por el desequilibrio de clases y el bajo contraste
intrínseco.
Palabras clave:
segmentación automática, tumor de mama, regresión logística, imágenes por microondas, densidad de umbral.Introduction
Breast cancer is the most prevalent malignancy among females, with around 287 850 novel cases predicted in 2022 in the United States, along with 43 250 mortalities 1. Breast tumors are the uncontrolled proliferation of aberrant cells obstructing normal breast tissue. This inhibits the development and functionality of typical cells in the breast while occupying physical volume within the breast 2. Although this disease is rare in the age group of 25 to 30 years, many cases have been reported at an early age. According to the World Health Organization’s statistics, one in every 8-10 women will develop breast cancer 3. As per statistics in Iran, out of every 10-15 women, one is likely to develop breast cancer 4.
The interpretation of mammographies requires highly skilled radiologists, as different experts may report different variations of the same mammography. Mammography has a 68-79% accuracy and necessitates expert radiologists due to inter-observer variability. Biopsies definitively determine malignancy, but they are expensive, invasive, and time-consuming 3. Motivated by the limitations of traditional breast cancer detection methods, such as MRI and mammography, the use of microwave imaging holds significant promise for early breast cancer detection 5. Microwave imaging offers improved sensitivity in detecting breast tumors by exploiting the electrical differences between benign, malignant, and healthy tissues, thereby enabling the identification of small tumors that may be missed by other modalities 6. Moreover, the non-ionizing nature of microwave frequencies makes them a safer option for screening, especially for high-risk individuals and young women who require frequent monitoring. The low-cost approach of microwave imaging can enhance accessibility to breast cancer screening in resource-limited settings. By avoiding breast compression during imaging, microwave imaging offers a more comfortable experience for patients, potentially leading to higher compliance with regular screenings. The crucial aspect of microwave imaging lies in its capacity to identify tumors in their initial phases, thereby enhancing the prognosis of breast cancer and diminishing mortality rates. Additionally, microwave imaging may offer better visibility of tumors in dense breast tissue, which is often challenging in mammography 7,8. Advancements in microwave imaging technology and image processing algorithms have further enhanced its accuracy and reliability for breast tumor detection. Hence, exploring and harnessing the capabilities of microwave imaging can complement existing screening techniques, leading to improved breast cancer detection rates, earlier diagnosis. This ultimately allows saving lives 7,9.
This study embarks on a pivotal journey, introducing an innovative approach to automated breast tumor detection through the lens of microwave images. The fundamental motivation for our research is twofold: to enhance the early detection of breast cancer and to overcome the limitations of existing imaging techniques. We address the inherent challenges of microwave breast imaging, particularly the struggle to distinguish tumors with indistinct boundaries and low contrast, which makes automated segmentation a formidable task. Our work extends the boundaries of medical image processing, with a primary focus on developing a robust algorithm for breast tumor detection and localization.
The central contribution of our research lies in the application of the logistic regression (LR) algorithm for feature selection, mitigating the impact of ineffective attributes. We meticulously delineate the steps of our approach, spanning image acquisition, noise reduction, and tumor region identification, ultimately building a framework that promises precision and resilience. We diligently evaluate our methodology using established metrics such as precision, the area under the receiver operating characteristic (ROC) curve, false and true positive rates, and accuracy. The findings of our study underscore the possibility of selecting the most effective features using LR, thus enhancing our understanding of the algorithm’s real potential.
The remainder of this paper is organized as follows. The second section covers the pertinent related works. In the third section, a comprehensive examination of this work’s materials and methodology is presented. The fourth section delves into LR. In the fifth section, we provide a detailed overview of the simulation and its results. Finally, some concluding remarks are presented in the sixth section.
Related Works
The scientific literature on imbalanced classification problems and breast tumor prediction has seen numerous research efforts to develop robust and accurate methods for detecting breast tumors from medical images. Several fully automated methods for segmenting breast tumors in breast microwave images (BMI) have been proposed in recent years, some of which are presented below.
10 developed an intuitive technique by merging empirical domain-specific expertise with low and high-level image features. Their technique employed a well-trained texture classifier and an active contour model, incorporating local edge information and global statistical data for the automated segmentation of breast cancers in BMI.
11 presented a segmenting mammography method that employs the threshold and seed selection approaches. The employed algorithm searches for the largest value in each row of the pixel matrix to calculate the mean of these values, determining the threshold for segmentation.
The authors of 12 proposed a breast tumor detection and classification method based on density. They computed statistical properties such as mean, contrast, regularity, standard deviation, entropy, and homogeneity to select seed points, utilizing the mean of these statistical qualities as the first seed pixel.
However, their algorithm faced challenges in accurately detecting multiple tumors in mammographyimages.
The work by 13 implemented a method using the Wavelet transform, achieving a correct classification of the majority of breast tissue images with microcalcifications, mammary duct improvement, and areas of dense tissue.
14 designed a breast MRI tumor segmentation algorithm using automated seed selection and particle swarm optimization (PSO) for image clustering. Their approach separated images into groups with similar intensity ranges, identifying the tumor region with the highest intensity value.
In 15, a saliency approach for the detection of malignancies was developed, aiming to identify areas of breast tissue with dark pigment clusters.
The paper by 16 presented a method for early breast cancer detection and classification using expectation maximization-based logistic regression (EM-based LR), achieving an average classification accuracy of 95,90% and a performance index of 90.72%. This study uses data from Kuppuswamy Naidu Memorial Hospital and employs the tumor node metasis (TNM) staging system of classification. However, while the paper demonstrates a well-structured and promising approach to breast cancer classification, it could benefit from a deeper explanation of the EM-based LR algorithm and the TNM staging system, as well as from comparisons with other classification techniques.
17 aimed to improve the performance of LR by modifying the hypothesis used in the classifier and assigning a weighting factor (β) to the sigmoid function. This research delves into examining how the weighting factor’s reliance is influenced by factors such as the number of features, the dataset size, and the optimization method applied. LR was selected due to its ability to offer a probabilistic interpretation, a feature not present in alternative classifiers like support vector machines (SVMs). The researchers adopted a hybrid strategy for the automatic localization of breast lesions in microwave imaging. This involves the integration of fuzzy sets, wavelet transform, pulse-coupled neural networks (PCNNs), and SVMs for classifying breast cancer from MRI images. While the approach is promising, it grapples with challenges stemming from its high dimensionality and computational intricacy. The authors employed both gradient descent and advanced optimization methods to minimize the cost function. Notably, they observed a noteworthy improvement in the accuracy of breast cancer detection by suitably selecting the value of β, which is determined by both the number of features and the optimization techniques employed.
(18) strove to develop a method that can accurately localize breast lesions using microwave images and a simplified PCNN. Their study involved the use of the MammoWave microwave imaging device, which employs two antennas rotating around the breast to capture microwave images. The images were processed using the PCNN algorithm for adaptive image segmentation and lesion detection. Furthermore, anon-parametricthresholding methodwasusedtodistinguishbetweenbreastsexhibiting no radiological observations, benign discoveries, and malignant findings 18. The findings indicate a 81.82% sensitivity for the proposed method in detecting malignant findings, matching the gold standard for breast lesion localization. One strength of this work is the use of real clinical data acquired from the MammoWavesystem, which adds credibility to the findings. The study also provides detailed information on the patient population, the imaging procedure, and the gold standard used for breast classification. However, the study acknowledges limitations such as the relatively small dataset and the need for further validation with a larger number of cases.
Finally, 19 proposed a conditional generative adversarial network (cGAN) to segment dense tissues within mammograms. Additionally, they incorporated a convolutional neural network (CNN) for categorizing mammograms based on the standard set of the Breast Imaging-Reporting and Data System (BI-RADS). The cGAN excelled at segmenting dense regions in mammograms, boasting accuracy rates of 98%, a Dice coefficient of 88%, and a Jaccard index of 78%. Employing the segmented masks of dense tissues generated by the cGAN, the classification network achieved remarkable f igures regarding precision (97.85%), sensitivity (97.85%), and specificity (99.28%) in breast density classification. This study drew from a collection of 410 images belonging to 115 patients from a breast dataset for screening mammography. In summary, to address the challenges of breast density estimation, including low contrast and significant fluctuations in the fatty tissue background of mammograms, the researchers leveraged cutting-edge deep learning methodologies such as cGANs and CNNs.
The above-presented works explored various image-processing techniques, statistical methods, and machine-learning algorithms to address the challenges of breast tumor detection and segmentation. However, many existing methods suffer from limitations when dealing with imbalanced classification problems in BMI and fail to accurately detect tumors in certain scenarios.
In this study, we present a novel methodology for detecting and segmenting breast tumors from microwave images using a combination of edge segmentation techniques and intensity thresholds. Our approach leverages the advantages of logistic regression and evaluates its effectiveness in selecting the most efficient features for breast tumor detection. By addressing the imbalanced classification problem, our method aims to achieve higher accuracy, sensitivity, and specificity in breast tumor prediction, leading to improved clinical practice and early diagnosis for better patient outcomes.
Materials and methodology
Materials dataset
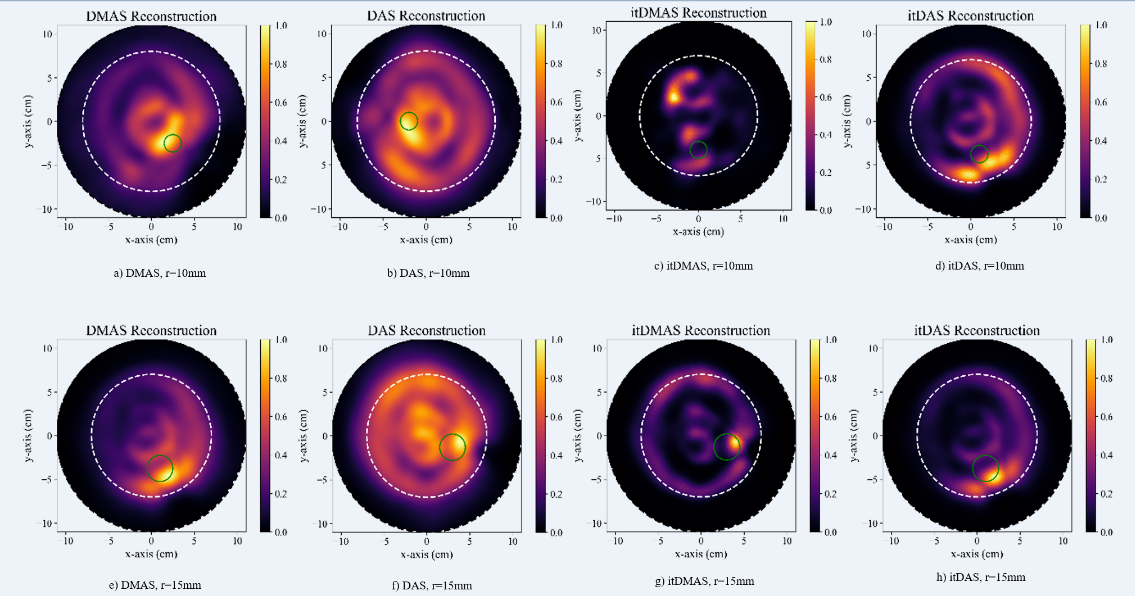
Ateam of scholars from the University of Manitoba has made available an open-access test dataset for microwave breast sensing (https://bit.ly/UM-bmid). This dataset was obtained from the numerical models presented in 20. The University of Manitoba Breast Microwave Imaging Dataset (UM-BMID) encompasses details of 3D-printed breast models derived from 1 257 MRI-based scans, serving as a fundamental resource for extensive evaluations of BMI methods. The UM-BMID phantom scans were conducted utilizing a preclinical radar-based system for microwave breast imaging. To this effect, a vector network analyzer (VNA) was employed, which allowed for the generation of a stepped continuous-wave signal at 1 001 points covering the ultra-wideband (UWB) frequency range of 1-8 GHz. In the imaging system, a double-ridged horn antenna served as the essential component for conducting the survey. During the scanning process, 72 antennas were attached to a platform, rotating along a circular path 72 times, with S-parameters measured at each location. By utilizing the well-established UM-BMID dataset and employing advanced microwave imaging technology. Our study builds upon the foundation laid by 20 and provides further insights into microwave breast sensing for improved tumor detection. To reconstruct images from each phantom scan, a set of beamformers was employed, namely delay-multiply-and-sum (DMAS), delay-and-sum (DAS), iterative delay-multiply-and-sum (itDMAS), and iterative delay-and-sum (itDAS). These beamformers collectively generated 12 reconstructions, each displaying identifiable tumor responses.
The UM-BMID is a publicly accessible repository that contains a vast amount of data. Our work then began by running a Python program to simulate and process image sets, from which a microwave image dataset was then extracted. This dataset comprises 18 distinct groups, each differing in terms of tumor presence or absence, along with varying tumor sizes for typical reconstructions.
To analyze the data, a total of 104 images were subjected to isolation and processing procedures. Out of these, 52 images were diagnosed with tumors, while the remaining 52 images represented normal tissues. Fig. 1 shows the reconstructed images, labeled as DMAS (a, e), DAS (b, f), itDMAS (c, g), and itDAS (d, h). In the initial row of images, reconstructed representations of a phantom scan housing a 10 mmtumorcanbeobserved.Thesubsequent row displays images from a phantom with a 15 mmtumor. To provide context, a dashed white circle has been added, aiming to roughly delineate the outer edge of the breast phantom in all the reconstructions. Meanwhile, a solid green circle accurately designates the confirmed location of the tumor 21.

Figure 1: DMAS (a,e), DAS (b,f), itDMAS (c,g), and itDAS (d,h) reconstructed images (https://bit. ly/UM-bmid)
Region of interest (ROI) extraction is a crucial step aimed at identifying potential tumor locations in microwave images. To accomplish accurate tumor segmentation, a density thresholding technique was used to identify tumor regions based on density levels. Subsequently, edge segmentation techniques were applied to further refine the identification of tumor regions by detecting local pixel intensity gradients.
In addition, LR was employed as a supervised learning technique for feature selection, in order to reduce the number of features used in tumor classification, thus enhancing the algorithm’s efficiency. Finally, the algorithm’s performance in detecting breast tumors was evaluated using various metrics, including sensitivity, specificity, accuracy, precision, the false positive rate (FPR), and the false negative rate (FNR).
By detailing these steps in the experimental setup, we aim to provide a comprehensive understanding of our proposal for breast tumor detection and segmentation via microwave imaging. These steps collectively contribute to the accuracy and effectiveness of our algorithm in clinical practice.
Proposed methodology
Our methodology primarily involves the use of LR for the automatic segmentation of breast tumors in microwave images. LR is a statistical model that employs maximum likelihood optimization to determine a weight vector. This weight vector represents a set of weights to be learned, where the constant term is represented by x0 = 1. The LR model then calculates the subsequent distribution of the data using the Bayesian rule. The model also considers the effect of the weight vector on the probability and the subsequent distribution of the data. If the weight vector is greater than 0, the probability and distribution of the data increase as the variable xd increases. Conversely, if the weight vector is less than 0, the data probability and distribution decrease as the variable xd increases. This is mathematically explained in Section 4.1.
Our methodology also includes the deletion of border-connected regions. This operation is commonly used in image processing and computer vision tasks to clean up or isolate objects of interest. It involves removing specific parts of an image or a connected component in a binary image that touches the image’s boundary. The steps to delete border-connected regions depend on the software or programming language used. Threshold density is another crucial aspect of the methodology, as it is used to determine the cut-off point for image intensity at the target (tumor) position. This threshold value is crucial for the accurate segmentation and detection of breast tumors in microwave images.
This section presents a detailed description of the proposed methodology. The technical approach of the algorithm involves a combination of edge segmentation techniques and intensity thresholds to identify and localize tumors within microwave images.
The breast microwave signals block refers to the raw microwave data acquired directly from the breast before any image reconstruction has been performed. This step represents the original signals obtained from the microwave imaging system. Subsequently, the microwave image reconstruction (DMAS, DAS, itDMAS, and itDAS images) block refers to reconstructed microwave images that are provided as inputs to our model. These reconstructed images are obtained through established reconstruction techniques, such as the aforementioned DMAS, DAS, itDMAS and itDAS, which solve the inverse scattering problem. However, tackling the inverse scattering problem for image reconstruction from raw microwave data is outside the scope of our study. We take the reconstructed microwave images as given inputs, and our novel contributions are in the subsequent numerical processing steps, i.e., preprocessing, segmentation, feature selection, and classification for accurate breast tumor detection and delineation.
Preprocessing
The image preprocessing stage involved a meticulous series of steps to ensure an optimal input for subsequent analysis. Initially, raw BMI were obtained from the UM-BMID. This open-access dataset, curated by scholars from the University of Manitoba, served as a cornerstone for our research endeavors.
Microwave images often contain noise and unwanted artifacts that can interfere with the tumor detection process. To address this issue, preprocessing techniques, including grayscale conversion, were applied to the already reconstructed microwave images of the breast, obtained through established reconstruction methods. This vital preprocessing step prepares the images for subsequent analysis and facilitates more accurate segmentation and classification. By emphasizing that preprocessing occurs after image reconstruction and before tumor segmentation and classification, we clearly delineate it as a distinct intermediate stage in the overall computational framework. Preprocessing transformed images enhance the performance of later steps like edge segmentation and density thresholding for precise breast tumor delineation. The im2bw MATLAB function was applied to convert the grayscale image into a binary black-and-white format. This binary representation effectively highlights the tumor regions and suppresses the background noise, making the segmentation process more robust.
Tumor region identification
The core of our methodology lies in the strategic identification of tumor regions within BMI. Leveraging the LR algorithm for feature selection, we meticulously eliminated attributes deemed linear and low-cost, preserving essential features using predefined weights. This process ensures a discerning separation between non-salient and salient features, contributing significantly to the algorithm’s robustness.
To achieve precise tumor region identification, a hybrid approach combining threshold density techniques and edge segmentation methods was employed. The definition of intensity thresholds, coupled with advanced edge segmentation, refines the delineation of tumor boundaries. This hybrid strategy enhances the localization accuracy of detected tumors.
Edge segmentation techniques
Sophisticated edge segmentation techniques were employed to identify potential tumor regions within BMI. These techniques focus on detecting abrupt changes in intensity or gradient, indicative of tumor presence. The process begins with the use of the bwlabel function in MATLAB, performing connected componentlabeling to identify distinct regions in the binary image. Each region, representing a group of connected pixels with similar properties, may signify potential tumor areas. Subsequently, the regionprops is employed to extract various properties from these regions, such as the density and area of non-black (white) pixels. This detailed information was seamlessly integrated into our threshold density algorithm, enhancing its ability to accurately delineate potential tumor regions from the surrounding tissue. This comprehensive approach, combining edge segmentation techniques with connected component labeling and properties extraction, contributes to the precision and sensitivity of our methodology, ultimately improving the early detection and diagnosis of breast tumors in BMI.
Tumor discrimination
A nuanced approach was implemented to distinguish tumors from surrounding regions in BMI. In this process, a crucial step involves defining a threshold intensity level, intricately linked to the density of non-black pixels within each region. This threshold serves as a discriminative factor, with high-density regions earmarked as potential tumor areas. The algorithm meticulously analyzes density values within each region, pinpointing the one with the highest density, a key indicator of tumor presence. This identified region is subsequently labeled as the tumor region, setting the stage for further in-depth analysis and precise localization. This methodical discrimination process enhanced the algorithm’s ability to differentiate potential tumor regions from the surrounding anatomical structures, contributing to the overall efficacy of our breast tumor detection model in BMI.
Tumor localization
Our algorithm progresses beyond mere identification to achieve precise delineation of tumor boundaries within BMI. To this effect, the organ’s function is strategically employed, leveraging the earlier detected tumor region as a reference point for accurate localization. This intricate step goes beyond basic segmentation, ensuring that the algorithm captures the nuanced boundaries of the tumor with a high level of accuracy. By aligning with the organ’s function, our approach enhances the reliability of tumor localization, a critical aspect for subsequent diagnostic assessments and effective treatment planning. This detailed localization process significantly contributes to the overall robustness of our model, setting it apart in terms of accuracy and clinical relevance.
On the importance of segmentation
The significance of segmentation lies in its pivotal role within the proposed methodology. This step is critical since it involves the division of the image into distinct regions, allowing the algorithm to isolate comparable features. This division makes it notably easier to discern tumors from the background and other structures present in the image. The binary representation acquired through the thresholding process simplifies the subsequent identification and classification of pixels into tumor and non-tumor regions. This, in turn, greatly facilitates the precise localization of tumors within the overall image, significantly contributing to the accuracy and effectiveness of the entire tumor detection process.
Fig. 2 provides a visual representation of the entire methodology. It shows the sequential steps involved in the breast tumor detection and segmentation processes. The binary image obtained after preprocessing is fed into the edge segmentation techniques, which identify connected regions in the image. The tumor discrimination step determines the high-density region, which is then labeled as the tumor. Finally, the tumor localization step refines the segmentation to precisely locate the tumor boundaries, resulting in accurate tumor segmentation within the microwave image.

Figure 2: Overview of the proposed method
In conclusion, the proposed methodology combines edge segmentation techniques with intensity thresholds to detect and segment breast tumors from microwave images. By preprocessing the images, identifying potential tumor regions, discriminating tumors based on density values, and accurately localizing the tumor area, the primary objective of the algorithm is to amplify the accuracyandefficiency of breast tumor identification via microwave imaging.
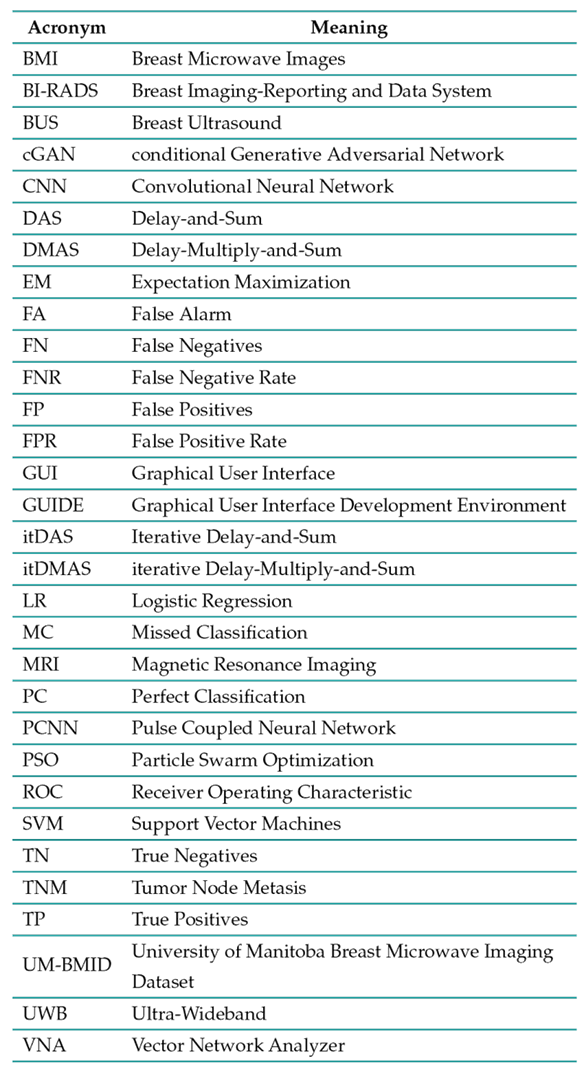
List of acronyms
Table I: presents the compilation of acronyms employed throughout this paper.
Logistic regression
LR is a statistical regression model for dichotomous dependent variables, e.g., health and illness. This model is an extended linear model with Logit as its link function and a polynomial error distribution. There are two possible outcomes for a random event. For example, buy or don’t buy, registration or not, and going bankrupt or not are variables that have only two statuses, for which the total probability will be eventually one. This method was primarily used in medicine for early-stage disease prediction. However, it is now widely used in all fields of science. LR is a subset of the general linear model and linear regression. It is based on the principle of different assumptions (regarding the connection between dependent and independent variables) rather than the LR model. Two properties of LR highlight the crucial distinction between these two models. First, due to the binary nature of the dependent variable, instead of a Gaussian distribution, the conditional distribution is of the Bernoulli type. Secondly, the forecast values are probabilities that are bounded between 0 and 1, which are derived using the logistic distribution function.
The main objective of feature selection involves reducing the count of attributes employed in a classification, all the while upholding a satisfactory level of accuracy in categorization 22. The selection of features decreases the size and execution time of input data when compared to the estimation method. Feature selection methods are divided into two groups: supervised and unsupervised. A supervised feature selection method evaluates a wide range of subsets of features using an evaluation function or criterion to select only those that are relevant to the decision classes of the data. Traditional feature selection methods are divided into two groups: filter and wrapper. Features are included or excluded in the filter method based on statistical metrics, feature weighting, mutual information, and various other considerations. Comparatively, assessing feature performance is independent of any learning model, making it a simpler and more expeditious process to execute23.
LR was chosen for classification due to several important considerations:
-
Simplicity and interpretation. LR offers a straightforward and interpretable approach, which makes it an accessible and understandable option for classification tasks.
-
Efficiency with binary classification. LR efficiently deals with binary classification tasks, demonstrating its effectiveness in distinguishing between two categories.
-
Likelihood estimation. LR provides probability outputs for each class, providing valuable insights into the probability of selected classifications, a feature that can be very useful for decision-making scenarios.
-
Low-dimensional data. For datasets with relatively low-dimensional characteristics, LR proves computationally effective and efficient, allowing for smooth processing.
-
Feature importance. LR allows identifying the most influential variables, providing valuable insights into the importance of a feature in the classification process.
-
Reduced overfitting. LR tends to be less prone to overfitting, with smaller data sets and limited features, which enhances its reliability and robustness.
Ultimately, the selection of a machine learning algorithm must be in line with the unique characteristics of the dataset, the research goals, and the specific nature of the classification problem. All this depends on data complexity and volume, as well as on required performance metrics.
Limitations of LR
Consider the dataset
 , and
, and
 . Let x = (x1,...,xD) be the input vector, and let y be the binary class label. y can be either 1 or 0. The probability model underlying LRis as follows24:

where s represents a vector of weights to be learned. Note that x0 = 1 is a constant term. To determine the weight vector s, LR employs maximum likelihood optimization.

Lemma1.LRmodelsthe subsequent data distribution:}

Using the Bayesian rule, we calculate the probability:


The lemma follows by comparing 1 with 5. From Lemma 1, note that, in a LR model, a) if sd > 0, then p(y = 1|x) and λ(x) increase as xd increases; and b) if sd < 0, then p(y = 1|x) and λ(x) reduce as xd increases.
Deleting the border-connected regions
Deleting border-connected regions typically involves removing specific parts of an image or a connected component in abinary imagethat touches the image’s boundary. This operation is commonly used in image processing and computer vision tasks to clean up or isolate objects of interest. The steps to delete border-connected regions depend on the software or programming language used.
In the work by 25, a computer-aided diagnosis (CADx) system is proposed for the automated segmentation and detection of masses in breast ultrasound (BUS) images. This method employs a two-step segmentation approach based on multi-resolution analysis. In the CADx system, the image-boundary-adjacent regions weredirectly removed25. However,thelesionregionisoccasionally within the border. If the border-connected areas are immediately eliminated, the lesion region will also be eliminated. To avoid incorrectly removing regions, our work proposes a criterion for the center window that is about half the size of the total picture and centered in the image.
Segmentation based on the Edge
When employing edge-based segmentation, the delineation of the image border or edge is determined by the local gradient of pixel intensity. The gradient serves as an approximation of the f irst-order derivative of the image function. To calculate the magnitude of the gradient for a given function E(x,y), the following method can be applied:

The gradient direction is denoted as

Ex and Ey represent gradients in directions x and y, respectively.
Edge-based approaches are computationally efficient and typically do not necessitate prior knowledge of the image’s content. The general issue with this method is that the borders do not always entirely encircle the object. In this segmentation approach, direction and magnitude can be displayed as images. To structure closed boundaries between adjacent regions, a post-processing procedure joining or grouping edges is necessary.
Simulation and results
In this work, the MATLAB R2018b software was used to simulate the proposed breast tumor detection and segmentation approach. TheGUIwasbuiltusingGUIDE.Foranalysispurposes,real-time patient data were collected. Detecting and extracting a tumor from a breast microwave image is relatively straightforward due to the tumor’s elevated intensity compared to its background. Fig. 3a depicts the BMI from the open-access dataset, Fig. 3b depicts the BMI for the tumor alone, and Fig. 3c depicts the image of the tumor that was segmented using the proposed methods. In another case, we inserted a microwave image of the breast without any indication of a tumor. As a result, no tumor was detected or identified. This is illustrated in Fig. 4.

Figure 3: a) Source BMI; b) tumor; c) tumor region segmentation using the proposed method

Figure 4: a) Source BMI; b) no tumor; c) no tumor identified
Performance measures
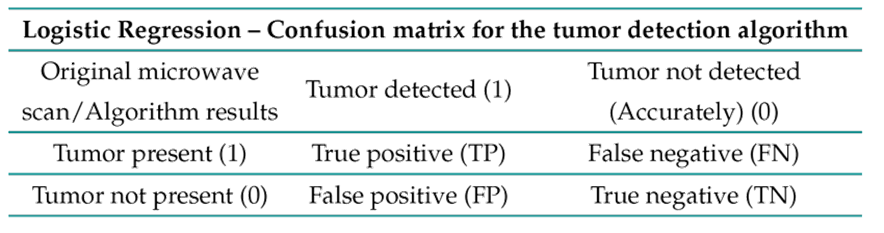
The performance evaluation of our proposed methodology involved a comprehensive set of metrics, including precision, the area under the receiver operating characteristic (ROC) curve, the false positive rate, the true positive rate, and accuracy. Systematic calculations of these metrics collectively offer a quantitative and qualitative assessment of the algorithm’s ability to detect and localize breast tumors. The overall performance of the proposed design was determined by an evaluation matrix comprising true positives (TP), true negatives (TN), false positives (FP), and false negatives (FN), as illustrated in Table II . This matrix serves as a key component in evaluating the robustness and effectiveness of our algorithm in breast tumor detection.
Table II: Confusion matrix for the tumor detection algorithm
This study employed sensitivity (Se), specificity (Sp), accuracy (Acc), and other metrics that are commonly utilized in many medical imaging applications.
The LR statistics were calculated as follows 12:


In the context of image classification, TP corresponds to images correctly identified as breast tumor images, while the FP refers to non-tumor images inaccurately labeled as breast tumor images. Model accuracy signifies the proportion of accurately classified images among the total number of tested images. In the realm of machine learning and deep learning models, accuracy pertains to the ratio of correctly classified samples (images) to the overall count of test images. This metric serves as a prevalent evaluation measure for assessing the performance of classification models. An increased accuracy value suggests that the model adeptly categorizes test data. TN designates appropriately classified standard images. FN quantifies the erroneously identified non-tumor pixels. The FPR refers to cases where test results indicate that a condition is present when, in fact, it is not. The FNR denotes test outcomes where the results indicate the absence of a condition, despite its actual presence.
We can calculate the statistical expressions for the performance analysis as follows 16:


In a perfect classification (PC) with are no errors, the total number of PCs would be equal to the TPs plus the TNs, since a perfect model would correctly identify all the actual positive cases as positive (TP) and all the actual negative cases as negative (TN). False alarms occur when the model erroneously forecasts the positive class despite the actual class being negative. These instances are also recognized as FPs. The sensitivity in Eq. (14) was calculated in this way. The key difference of this equation is that the denominator contains FPs rather than FNs, so, while the standard sensitivity equation says how many actual positives were correctly found, this version says how many positive predictions were correct. The issue with using FPs in the denominator is that it penalizes the sensitivity score if the number of false alarms goes up. FNs refer to missed positive classifications when an actual positive case is incorrectly classified as negative. Thus, MC = FN.
The performance index (PI) considers the total number of correct positive classifications along with the number of false negatives (MC) and false positives (FA) to assess the algorithm’s performance. A PI value closer to 1 indicates a better-performing algorithm, as it suggests a higher percentage of correct classifications compared to the total number of classifications made. A higher PI value would indicate that the proposed algorithm has is better at accurately detecting and segmenting breast tumors from microwave images, making it more effective for clinical applications.
The sensitivity and specificity of the classification statistics derived from the performance analysis were used to determine the efficacy of the proposed breast tumor detection method. High sensitivity and specificity values indicate that the proposed approach is effective for clinical use.
The results show that the 0.1 and 0.6 density thresholds were 100% accurate at detecting breast tumors from microwave images. 0.1-0.8 were decently accurate, but 0.8 and 0.9 did not quite manage to detect the presence of tumors (Fig. 5).

Figure 5: Performance analysis statistics of LR and density threshold for breast tumor detection for 10 samples (images)
The results also showed that, when the density threshold was between 0.1 and 0.6, the PC was 100%accurate in identifying images with tumors. We also obtained a good ideal classification when the density threshold was between 0.1 and 0.8, and vice versa. When the density threshold is high, 0.8-0.9 makes the percentage of missing classification very high, meaning that it is not possible to classify images that contain tumors (Fig. 6).

Figure 6: Classification rates predicted via LR and density threshold for breast cancer diagnosis
More attention is to be paid on various points in the ROC curve. The point (0, 0) in the lower-left corner represents a technique when the classifier does not generate positive results. The point in the upper right corner depicts the opposing technique, which always yields positive results (1, 1). The (0, 1) point represents the optimal classifier. In general, a perfect ROC curve is achieved whentheclassifiercan completely separate the two classes, resulting in no overlap between the TPR (sensitivity) and the FPR (1-specificity). In this scenario, the TPR is always 1, and the FPR is always 0, regardless of the threshold selected. Since the TPR is the same as sensitivity and is given as 1 in the curve, and the FPR is equal to 1-specificity and is also given as 0, it implies that all threshold values in Fig. 7 result in PC. Therefore, any threshold value chosen for classification, in this case, would yield a perfect ROC curve.

Figure 7: ROC curve of the proposed method
Conclusión
The detection of cancer at an early stage is necessary for reducing mortality rates. The efficacy of breast cancer detection is contingent on the precision of tumor segmentation. When segmenting microwave images, the ROI must be extracted since it play savitalrole in the efficacyof tumor detection. This work presents a method for automatically extracting ROI from microwave breast images. These microwave images were preprocessed, which reduces noise and increases contrast. Microwave scans reveal the size and location of a breast tumor. This information allows radiologists to easily diagnose the tumor and prepare its surgical removal. In order to address the challenges in evaluating breast tumors, an automatic detection method using microwave images was developed. Density thresholds ranging from 0.1 to 0.8 showed the highest accuracy in detecting breast tumors from these images. The potential for enhanced robustness lies in incorporating additional data facets into the algorithm, an augmentation that could empower the program to handle diverse breast tumor scans more adeptly. This advanced imaging processing tool has the potential to assist medical professionals in laser ablation procedures. As welook to the future, it is important to address the influence of bright and dense outer tumor edges on the detection algorithm. Implementing a filtering technique to mitigate their impact could further refine the accuracy of the detection process
References
Licencia
Derechos de autor 2024 Azhar Albaaj, Yaser Norouzi, Gholamreza Moradi

Esta obra está bajo una licencia internacional Creative Commons Atribución-NoComercial-CompartirIgual 4.0.
![]()
A partir de la edición del V23N3 del año 2018 hacia adelante, se cambia la Licencia Creative Commons “Atribución—No Comercial – Sin Obra Derivada” a la siguiente:
Atribución - No Comercial – Compartir igual: esta licencia permite a otros distribuir, remezclar, retocar, y crear a partir de tu obra de modo no comercial, siempre y cuando te den crédito y licencien sus nuevas creaciones bajo las mismas condiciones.

2.jpg)