DOI:
https://doi.org/10.14483/23448393.21846Published:
2024-08-04Issue:
Vol. 29 No. 2 (2024): May-AugustSection:
Civil and Environmental EngineeringCommunity-Based Early Warning System Model for Stream Overflow In Barranquilla
Modelo de sistema de alerta temprana para desbordamiento de arroyos en barranquilla basado en la comunidad
Keywords:
stream overflow, social network, machine learning, natural language processing (en).Keywords:
arroyos, redes sociales, aprendizaje automático, procesamiento de lenguaje natural (es).Downloads
References
H. D. Van Strahlen Bartel, “Estudio de la problemática de los arroyos urbanos de la cuenca El Rebolo (Barranquilla, Colombia) y propuesta de soluciones,” Master’s thesis, Universitat Politècnica de València, 2017. [Online]. Available http://hdl.handle.net/10251/90068
H. Ávila, “Perspectiva del manejo del drenaje pluvial frente al cambio climático-caso de estudio: ciudad de Barranquilla, Colombia,” Rev. Ing., vol. 36, pp. 54-59, 2012. http://www.scielo.org.co/pdf/ring/n36/n36a11.pdf
J. A. Sepúlveda Ojeda, “Aplicación web para la visualización de sensores del sistema de alertas tempranas de los arroyos de Barranquilla-Colombia,” Rev. Espacios, vol. 38, no. 47, p. 17, 2017. http://hdl.handle.net/11323/2024
L. J. Pérez Flórez and J. S. Hernández Miranda, “Diseño del modelo económico energético para un sistema de alerta temprana (MEESAT) para los arroyos de Barranquilla,” undergraduate thesis, Universidad de la Costa, 2015. http://hdl.handle.net/11323/4899
M. Acosta-Coll, F. Ballester-Merelo, and M. Martínez-Peiró, “Early warning system for detection of urban pluvial flooding hazard levels in an ungauged basin,” Nat. Hazards, vol. 92, pp. 1237-1265, 2018. https://doi.org/10.1007/s11069-018-3249-4
M. A. Coll, “Sistemas de alerta temprana (SAT) para la reducción del riesgo de inundaciones súbitas y fenómenos atmosféricos en el área metropolitana de Barranquilla,” Sci. Tech., vol. 18, no.o 2, pp. 303-308, 2013. https://revistas.utp.edu.co/index.php/revistaciencia/article/view/8661/5411
A. Chatfield and U. Brajawidagda, “Twitter tsunami early warning network: A social network analysis of Twitter information flows,” in 23rd Australasian Conf. Info. Syst., 2012, pp. 1-10. https://core.ac.uk/download/pdf/301388984.pdf
Gobernacion del Atlántico, “Plan departamental de gestión del riesgo Atlántico (Colombia),” 2021. [Online]. Available: http://repositorio.gestiondelriesgo.gov.co/handle/20.500.11762/392?locale-attribute=es
X, “Use Cases, Tutorials, & Documentation,” X Developer Platform. https://developer.twitter.com/en (accessed July 8, 2023).
H. Müller and J. C. Freytag, “Problems, methods, and challenges in comprehensive data cleansing”, 2005. [Online]. Available: https://tarjomefa.com/wp-content/uploads/2015/06/3229-English.pdf
Y. Valdés Hernández and D. Marmol Lacal, “DBAnalyzer 2.0, sistema para analizar bases de datos libre,” undergraduate thesis, Universidad de las Ciencias Informáticas, 2008. https://repositorio.uci.cu/jspui/bitstream/ident/TD_1287_08/1/TD_1287_08.pdf
E. Estoque Cabrera, L. Baró Galán, and M. E. Escobar Pompa, “Implementación de algoritmos para la limpieza de datos,” undergraduate thesis, Universidad de las Ciencias Informáticas, 2015. https://repositorio.uci.cu/jspui/handle/ident/8774
I. Zeroual and A. Lakhouaja, “Data science in light of natural language processing: An overview,” Procedia Comput. Sci., vol. 127, pp. 82-91, 2018. https://doi.org/10.1016/j.procs.2018.01.101
G. D. Buzai and C. A. Baxendale, “Análisis exploratorio de datos espaciales,” Geogr. Sist. Inf. Geográfica, no. 1, pp. 1-11, 2009. https://ri.unlu.edu.ar/xmlui/bitstream/handle/rediunlu/702/Buzai_An%C3%A1lisis%20Exploratorio%20de%20Datos%20Espaciales.pdf?sequence=1&isAllowed=y
P. Carranza and J. Fuentealba, “Una introducción al análisis exploratorio de datos por medio de Google Analytics,” Yupana Rev. Educ. Matemática UNL, vol. 7, pp. 53-65, 2013. https://doi.org/10.14409/yu.v1i7.4262
Z. Jianqiang and G. Xiaolin, “Comparison research on text pre-processing methods on twitter sentiment analysis,” IEEE Access, vol. 5, pp. 2870-2879, 2017. https://doi.org/10.1109/ACCESS.2017.2672677
E. Kouloumpis, T. Wilson, and J. Moore, “Twitter sentiment analysis: The good the bad and the omg!,” in Proc. Int. AAAI Conf. Web Soc. Media, 2011, pp. 538-541. https://doi.org/10.1609/icwsm.v5i1.14185
“Spanish · spaCy Models Documentation,” SpaCy. https://spacy.io/models/es (accessed July 16, 2023).
S. Quarteroni, “Natural language processing for industry: ELCA’s experience,” Inform.-Spektrum, vol. 41, no. 2, pp. 105-112, 2018. https://doi.org/10.1007/s00287-018-1094-1
A. Yadav, A. Patel, and M. Shah, “A comprehensive review on resolving ambiguities in natural language processing,” AI Open, vol. 2, pp. 85-92, Jan. 2021. https://doi.org/10.1016/j.aiopen.2021.05.001
N. Kaur, V. Pushe, and R. Kaur, “Natural language processing interface for synonym,” Int. J. Comput. Sci. Mob. Comput., vol. 3, n.o 7, pp. 638-642, 2014. https://ijcsmc.com/docs/papers/July2014/V3I7201499a13.pdf
M. M. E. Torres and R. Manjarrés-Betancur, “Asistente virtual académico utilizando tecnologías cognitivas de procesamiento de lenguaje natural,” Rev. Politécnica, vol. 16, no. 31, pp. 85-96, 2020. https://doi.org/10.33571/rpolitec.v16n31a7
A. Gelbukh, “Procesamiento de lenguaje natural y sus aplicaciones,” Komputer Sapiens, vol. 1, pp. 6-11, 2010. https://www.gelbukh.com/CV/Publications/2010/Procesamiento%20de%20lenguaje%20natural%20y%20sus%20aplicaciones.pdf
L. Deng, “Deep learning: from speech recognition to language and multimodal processing,” APSIPA Trans. Signal Inf. Process., vol. 5, no. 1, Jan. 2016. https://doi.org/10.1017/ATSIP.2015.22
F. Ramos and J. Vélez, “Integración de técnicas de procesamiento de lenguaje natural a través de servicios web,” undergraduate thesis, Universidad Nacional del Centro de la Provincia de Buenos Aires, 2016. [Online]. Available: https://www.ridaa.unicen.edu.ar/handle/123456789/644
P. Johri, S. K. Khatri, A. T. Al-Taani, M. Sabharwal, S. Suvanov, and A. Kumar, “Natural language processing: History, evolution, application, and future work,” in Proc. 3rd Int. Conf. Computing Informatics Networks: ICCIN 2020, 2021, pp. 365-375. http://dx.doi.org/10.1007/978-981-15-9712-1_31
M. Maldonado, D. Alulema, D. Morocho, and M. Proano, “System for monitoring natural disasters using natural language processing in the social network Twitter,” in 2016 IEEE Int. Carnahan Conf. Sec. Tech. (ICCST), 2016, pp. 1-6. https://doi.org/10.1109/CCST.2016.7815686
D. Moreira et al., “Análisis del estado actual de procesamiento de lenguaje natural,” Rev. Ibérica Sist. Tecnol. Informação, no. E42, pp. 126-136, 2021. https://dialnet.unirioja.es/servlet/articulo?codigo=8624557
A. Gutiérrez Domínguez, “Aplicación de técnicas de procesamiento de lenguaje natural (NLP) en Twitter para la evaluación de políticas agrarias y del medio rural,” Master’s thesis, 2022. [Online]. Available: http://hdl.handle.net/10251/186767
Z. Zong and C. Hong, “On application of natural language processing in machine translation,” in 2018 3rd Int. Conf. Mech. Control Comp. Eng. (ICMCCE), Sep. 2018, pp. 506-510. https://doi.org/10.1109/ICMCCE.2018.00112
B. Li, Y. Hou, and W. Che, “Data augmentation approaches in natural language processing: A survey,” AI Open, vol. 3, pp. 71-90, Jan. 2022, https://doi.org/10.1016/j.aiopen.2022.03.001
M. B. Hernández and J. M. Gómez, “Aplicaciones de procesamiento de lenguaje natural,” Rev. Politécnica, vol. 32, 2013. https://revistapolitecnica.epn.edu.ec/ojs2/index.php/revista_politecnica2/article/view/32
A. A. Turdjai and K. Mutijarsa, “Simulation of marketplace customer satisfaction analysis based on machine learning algorithms,” in 2016 Int. Sem. App. Tech. Info. Comm. (ISemantic), Aug. 2016, pp. 157-162. https://doi.org/10.1109/ISEMANTIC.2016.7873830
Y. Takefuji and K. Shoji, “Effectiveness of ensemble machine learning over the conventional multivariable linear regression models”. [Online]. Available: https://neuro.musashino-u.ac.jp/publications/pdf/reg_vs_ml.pdf
Y. Al Amrani, M. Lazaar, and K. E. El Kadiri, “Random forest and support vector machine based hybrid approach to sentiment analysis,” Procedia Comput. Sci., vol. 127, pp. 511-520, 2018. https://doi.org/10.1016/j.procs.2018.01.150
D. S. Osorio, J. J. M. Escobar, L. Chanona-Hernández, G. Sidorov, and C. J. Núñez-Prado, “Clasificación bi-clase de canciones infantiles aplicando inteligencia artificial y procesamiento de lenguaje natural,” Res. Comput. Sci., vol. 151, no. 5, pp. 31-38, 2022. https://www.rcs.cic.ipn.mx/2022_151_5/Clasificacion%20bi-clase%20de%20canciones%20infantiles%20aplicando%20inteligencia%20artificial%20y%20procesamiento.pdf
How to Cite
APA
ACM
ACS
ABNT
Chicago
Harvard
IEEE
MLA
Turabian
Vancouver
Download Citation
Recibido: 14 de febrero de 2024; Aceptado: 18 de abril de 2024
Abstract
Context:
This work aims to design and create an early warning model based on the community as an alternative for the mitigation of the disaster caused by the streams that overflow in Barranquilla (Colombia). This model is based on the contributions in social networks, which are consulted through the API of each social network and f iltered according to their location.
Methods:
With the information collected is performed cleaning and debugging, and then with natural language processing techniques tokenize vectorize the texts, seeking to operate mathematically to find the vector similarity between processed texts, thus generating a classification between texts associated with stream overflow and texts that are not associated with overflow.
Results:
The texts classified as stream overflow are processed again to obtain a location or assign a default one, to consequently georeferenced these data in a map that allows to associate the risk zone and visualize it in a web application, monitoring and reducing the possible damage generated to the population.
Conclusions:
To choose the best classifier, 3 classification algorithms were selected (random forest, extra tree, and k-neighbor), which presented better performance and R2 in reference to the data processed in the regressions performed. the three algorithms were trained, and the k-neighbor algorithm was found to be the best.
Keywords:
Stream overflow, social network, Machine learning, Natural language processing.Resumen
Contexto:
Este artículo busca crear un modelo de alerta temprana como alternativa para mitigar el desastre provocado por los arroyos en Barranquilla Colombia, este modelo está basado en la comunidad por medio de redes sociales, consultando el api de cada red social, en donde se filtra por área de localización.
Métodos:
Con la información recolectada y depurada por medio de técnicas de procesamiento de lenguaje natural se convierten los textos en vectores, con el fin de clasificar en base a la similitud vectorial entre los textos procesados, generando así una clasificación entre los textos asociados al flujo de desbordamiento y los textos que no lo son. asociado con el desbordamiento.
Resultados:
Los textos clasificados como desbordamiento de arroyos son nuevamente procesados para obtener una ubicación o asignar una predeterminada, para posteriormente georreferenciar estos datos en un mapa que permite asociar la zona de riesgo y visualizarla en una aplicación web, monitoreando y reduciendo los posibles daños generados a la población.
Conclusiones:
Para elegir el mejor clasificador se seleccionaron 3 algoritmos de clasificación random forest, extra tree y k-neighbor), los cuales presentaron mejor rendimiento y R2 en referencia a los datos procesados en las regresiones realizadas. Se entrenaron los tres algoritmos y se descubrió que el algoritmo k-neighbor era el mejor.
Palabras clave:
arroyos, redes sociales, aprendizaje automático, procesamiento de lenguaje natural.Introduction
Floods are natural risk events produced by excess water from rivers in areas that have been invaded in normally dry conditions 1. The city of Barranquilla (Colombia) presents a severe case of overflowing streams, rivers, and creeks that cross or border the city, causing flooding in the urban area, which brings material damage and even, in some situations, human losses; this problem is caused by various factors such as its location near the tributary of the Magdalena River and the sea 2, as well as the low topographic slope that is around 5% 3. In addition, social and sanitary problems associated with garbage and poor planning cause the rainwater system to collapse quickly 4; the latter makes it a pivotal point to deal with emergencies during the rainy season 2. One way to mitigate the adverse effects of these climatic events is to design and create an early warning model that allows monitoring and alerting affected communities to reduce the impact of overflows, as detailed in 5. Currently, there are several methods of warning and tracking. For example, in Barranquilla, an early warning system was created using sensors and updating the information in a web application 4. This type of system has also been added to supply the system with solar energy 5. Currently, there are several warning and monitoring methods. In Barranquilla, an early warning system was created using sensors and updating the information in a web application 4; improvements have also been added to this system, seeking to supply the system with solar energy 5. Also, for the case study in Barranquilla, hydrological and hydraulic models have been developed to predict the areas where the flow will be high and fast to issue early warnings to the community 6.
On the other hand, in Barranquilla, monitoring of atmospheric phenomena has been implemented, making use of radars that generate alerts before an imminent storm or rain 7; as for data collected from social networks, in Japan, a system was created, which obtains information from Twitter and the processing of this information generates Tsunami alerts 8, likewise in the departmental risk plan of the region of Atlántico (Colombia), this risk scenario has been identified, as well as its causes and antecedents 9. Therefore, it is critical to find an additional solution to those proposed so far, where a model with input information from social networks will be advantageous and increasingly necessary, as this type of information stands out for being fast and updated. Additionally, it provides active monitoring that will generate alerts to the community. Given the above, this article will show in the f irst section the proposed flow for the model with the design of the system model structure, where the interaction between API, the database, and the processing of the information that generates the stream event prediction, in the second section the methodology used, which includes the data cleaning process, a previous analysis in which the models that best fit the behavior of the data will be reviewed. The third section describes the information processing and training of the selected algorithm. Finally, the results of this research process and the discussion and conclusions will be presented.
Methodology
Model structure
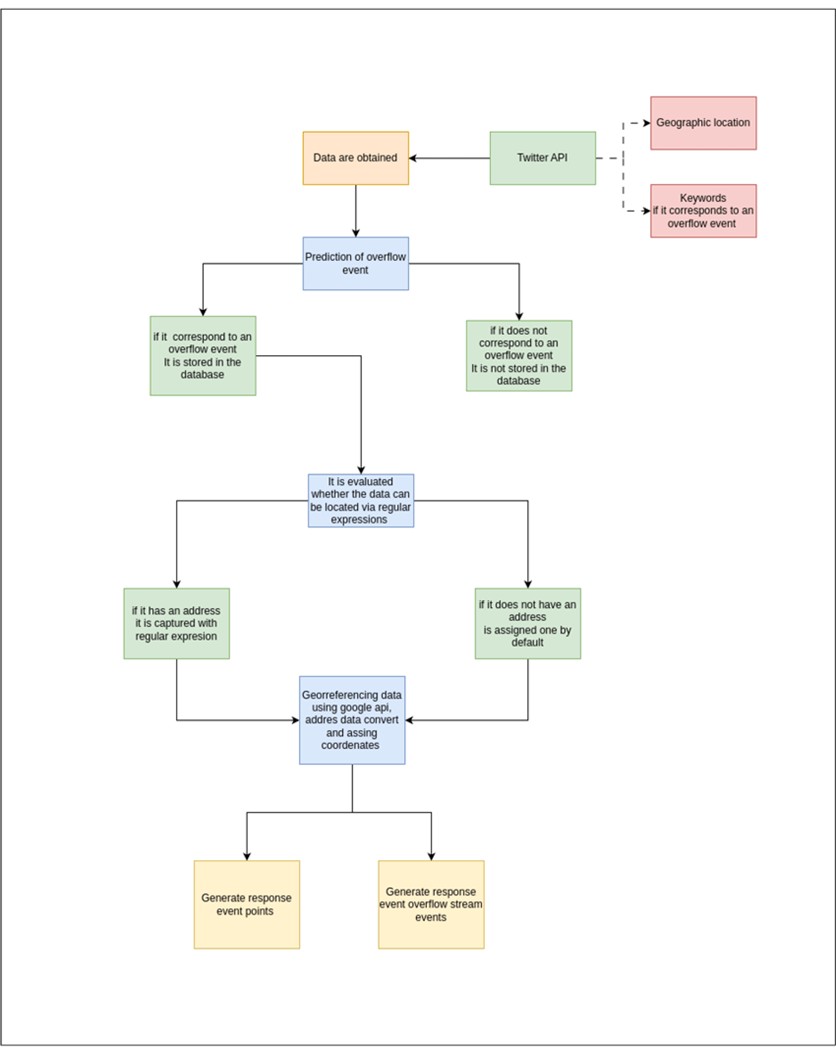
For the model design and structure, a flow verification was initially established, where the precipitation percentage was validated through a meteorological API. If the required percentage was met, the proposed model began by collecting information from the API of the social network X (formerly known as Twitter), as described in Figure. 1. The collected data were stored in a specific database and then processed using the trained algorithm selected for the classification. The database was then updated with each classification result (Figure. 2). In cases where the text contained a location (address), this information was extracted to update the database; otherwise, a default address was assigned. Afterwards, the geocoding process began, yielding coordinates (latitude and longitude) and that were assigned to the data. The next step in the proposed model was to identify whether the recorded events occurred in stream areas. To this effect, it was necessary to make a spatial crossing using a geoprocess, which sought to intercept the location of the events detected as streams vs. the polygons where they circulate. A record of streams was established as roads in Barranquilla (Colombia). The result of the geoprocess was the frequency of events in each stream polygon and the location of each river stream event. This information was displayed on a map (web map) along with the record of the events found in order to generate alerts to the population in risk areas.
Figure 1: Model Flow
Figure 2: Processing Flow
Data collection
The information needed to feed the database was obtained by creating a research account in the X social network (formerly known as Twitter) 10. Initially, a search was performed using the X API. The search was filtered by keywords, which were selected based on information from publications such as news and informative posts on the Internet. The words used to perform the search were the following: (Arroyo, Emergencias, Arroyos Barranquilla, Arroyos en la calle, Arroyo en la carrera, creciente, reporte lluvias, calle y carrera). in a time window from 2006 to December 2022. Once the best keywords were selected, a filter by location was added, taking the city of Barranquilla as the center and adding a 10 km radius to generate the coverage area.
Data cleaning
Data cleaning is a process that consists of correcting and removing incorrect or duplicated information through computerized methods, as indicated in 11. In this case, the collected data were stored in a SQL database, for which the database engine ”Postgresql” was used, and the collected information was structured in database tables. For the data cleaning process, the Python programming language was used, as well as the ”Spacy,” ”Numpy,” and ”Skylearn” libraries, which contain functionalities that allow connecting the programming language with the database, obtaining each data stored in the database and performing the data cleaning. In the data cleaning process, the methodology mentioned in 12 and 13 was followed where the quality of the data was evaluated. Then the methodology was replicated, where a grammatical analysis of the texts contained in each data was made, finding data with special characters, links, and emojis, after which the data transformation continued, where special characters, emojis, and links were removed using the libraries, leaving the data normalized. Finally, duplicated data found in the database was removed. The debugging performed on the database made it possible to give consistency to the information, thus reducing possible errors generated at the training time.
Classifying the collected data
Each tweet captured in the search was labeled in three categories, set as a classification criteria variable as follows: event will contain Y (if stream) or N (not stream) data and refers to whether the tweet indicates risk of a stream event, the sarcasm column which will contain Y values (if sarcasm) or N values (not sarcasm) and refers to phrases with a mocking tone that seek to say the opposite, the location column which will contain Y values (if it has an address) or N values (no address) and refers to the geographic location detected in the tweet. For manual classification, each tweet is discriminated against by a user in charge of labeling each data in its corresponding categories. For this classification, the tweet’s semantics and context were taken as criteria. This was done manually, considering that it is a supervised process and given that the initial training depends on human interaction, it may contain bias according to the criteria of the person performing the initial classification.
Information processing
Exploratory data analysis and preprocessing
The exploratory analysis consisted of conducting a series of initial studies and tests necessary to obtain basic approximations to data processing 14 using the information previously stored in the database, which had been previously cleaned and normalized. As in data cleaning, the exploratory analysis was carried out using the Python programming language and the Numpy15,Scikit learn 16, Spacy 17, and Nltk 18 libraries. Then, we proceeded to establish a count of the number of times that words are repeated (frequency) in the database; this count is essential to determine the words with the highest frequency in the information collected. Another critical step is to filter the collected data by the one containing the event label equivalent to (”Y”); in this way, the words with the highest frequency during a stream event were found. Additionally, the number per word found helps make histograms and helps in classification to account for data labeled as events, sarcasm, and location.
Additionally, in the exploratory analysis process, the aim was to generate graphs and statistics that would allow the behavior of each variable to be elucidated 14, thus obtaining the regression models with the best behavior in the trend and behavior of the data 19. Given the above, the pre-trained algorithm ”es_core_news_lg” from the Spacy library 17 was used to deliver the new algorithm. It should be noted that the pre-trained algorithm has an accuracy of 100% in tokenization, 99% in part of speech, and 98% in morphological analysis 17. Consequently, we proceeded to vectorize the data from the tokenized data to process vectors and not words. We performed mathematical operations on the vectors and regression, comparing the different statistical models and their behavior. We verified and chose the statistical models with an R2 closer to 1 and a lower Root Mean Squared Error (RMSE).
Training
For training, the information was standardized by changing the values of the labels for each data by ”1” and ”0”, where ”1” corresponds to ”Y” (Yes) and ”0” to ”N” (No). The information obtained was exported in CSV format to train the cleaned data. This copy was made so as not to manipulate the information initially collected and to make it easier to read the corpus file (input data for processing). Taking into account the data structure and its pre-processing shown above, we proceeded to generate a matrix from the corpus; we used the embedding method (vectorization method), which consists of converting the words or sentences (linguistic units) into vectors, for this we used the pre-trained algorithm es_core_news_lg from the Spacy library 18, which would generate for the entire corpus an array of vectors equivalent to a matrix. Given the vectorized data set, this array was split using the Split method, leaving 70% of the total vectorized data for training and 30% for testing.
After training the algorithms that showed the best behavior in the regressions performed for 1, 2, and 3 variables (event, sarcasm, and location), the algorithm was trained with the information previously divided, classified, and vectorized, obtaining as a result a trained classification machine learning algorithm, which was saved in PKL format and loaded in Python. The different tests were conducte dusing 30%of the divided data, while the training was tested using the Scikit learn library16.
Result
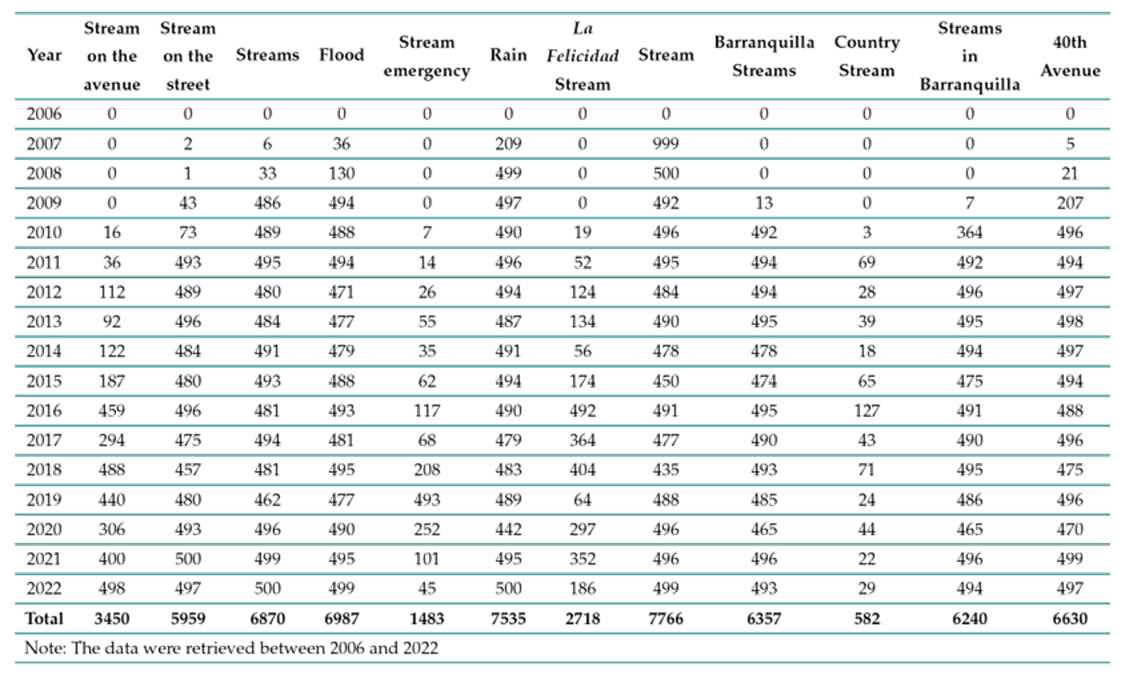
According to the information collected, it was possible to obtain 63259 data. In Table I it is possible to see the data found per year and per keyword, where an exponential increase in the amount of information related to streams is observed, it is also possible to find that words such as ”stream” or ”rain” have a greater number of coincidences with respect to the other keywords.
Table I. : Tweets by year
For data cleaning, it was found that the initial search criteria (streams, flood, and overflow) obtained similar results to other search criteria previously applied, causing duplication of information in the in the database, which generated a considerable increase in information cleaning times. Another critical factor in this section was the purification of special characters and stopwords to ensure a text that is possible to analyze and train (corpus). This reduced by about 40% the volume of information initially obtained, as it went from 63259 tweets collected to 36720 purified. Additionally, it was found that 8600 were related to a stream event in the city of Barranquilla after manual classification. Of these, 1600 had a text that could be associated with an address and used for geo-coding.
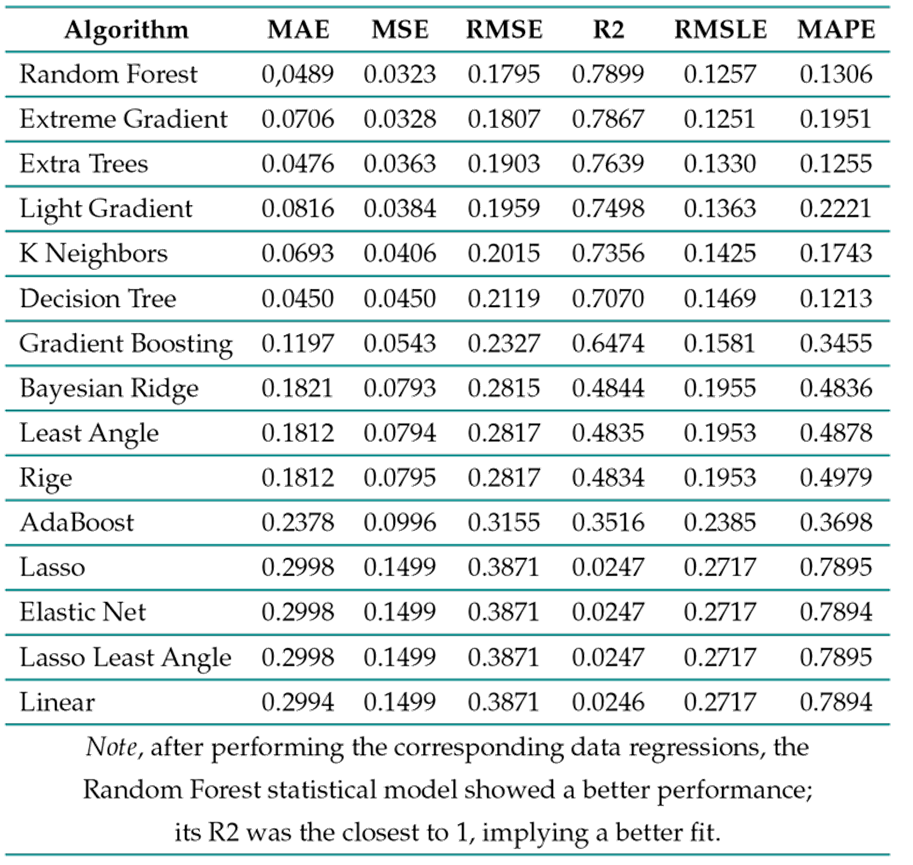
After comparing the different models tested, it can be noted that the random forest model has the best data adjustment; after being adjusted, this regression model presents an R-squared of 7899, as shown in Table II. Where the statistics mean absolute error (MAE), mean square error (MSE), root mean square error (RMSE), coefficient of determination or R-squared (R2), root mean log error (RMSLE), and mean absolute percentage error (MAPE) are found. Additionally, it is possible to note that this adjusted model presents an RMSE of 0.1795, as shown in Table II. corroborating that it has the best statistics for the required adjustment.
Table II: Data regression and results by statistical model
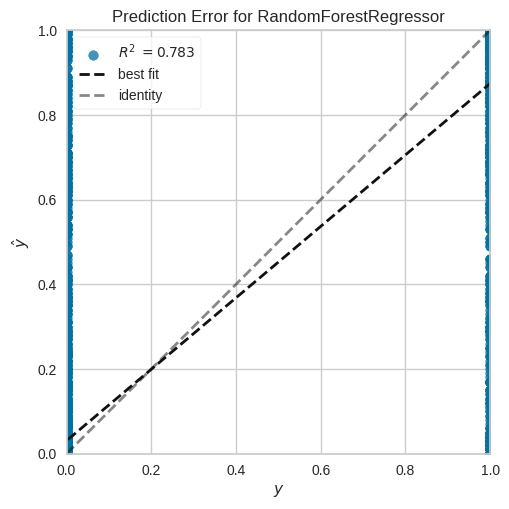
To To confirm the fit, the same analysis was validated, considering the classification variables such as location and sarcasm, finding similarity of results and the behavior of the data; for this purpose, error prediction graphs were also created, as shown in Figure 3 where the adjusted error and the predicted error are denoted, which shows no significant variation.
Figure 3: Error Prediction with Random Forest Model Fitting (Note, the fitted model does not differ drastically from the identified error)
The most frequently found words coincided in most cases with the initial search criteria, which improved the rate of search and information acquisition during the training of the neural processing algorithm (NPL). Figure 4 presents a Word-Cloud showing the words with the most repetitions in the information collected.
Figure 4: WordCloud of words with the highest frequency by geographic area and by keyword
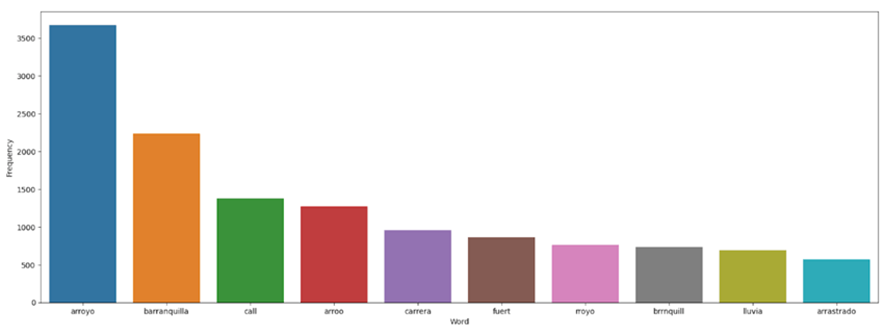
Figure 5 presents a word frequency plot of the social network ”X” during a stream event. Ten new algorithms were trained using classification variables set for this model to select the classification algorithm. From the ten tests, it was possible to choose the three best-performing algorithms during the exploratory analysis (KNC, RF, EXTRA). These three algorithms were tested with the classification variables as follows: ”event,” ”event, sarcasm,” ”event, sarcasm, location.” According to the results (Table III), it was found that the classification variable sarcasm has great importance in the training of the model since it allows discriminating ambiguities from two-way phrases in several Latin American areas; the use of sarcasm as a communication tool is used every day.
Figure 5. : Frequency and intensity of Word use during a stream (note: there are Word sthat predominantly appear during a stream event, such as stream, Barranquilla,and rain fall report).The units shown above quantity vs. item
Table III. : Results of testing in the training algorithms
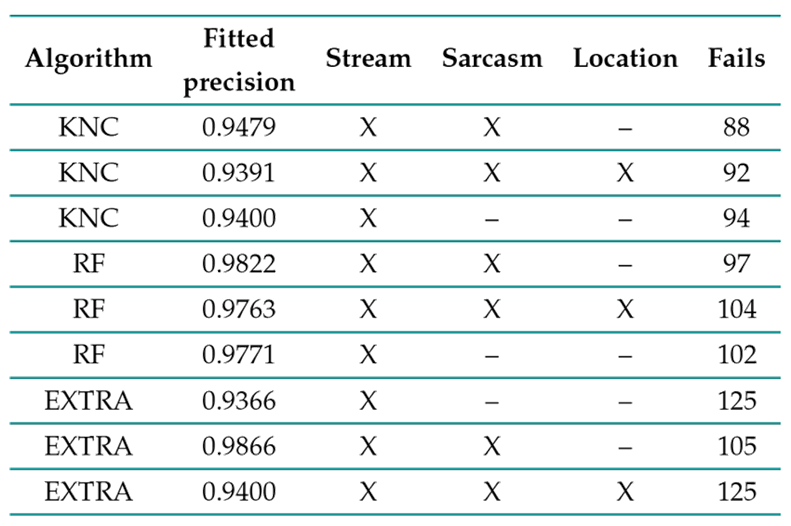
The ”Extra Tree” of the trained algorithms showed a statistically significant performance that performed best in the statistics. The ”Extra Tree” obtained up to 93.66% accuracy on one classification variable (event). However, the same algorithm obtained 78.99% of R2 in the regression. When two variables (event, sarcasm) were analyzed, the algorithm obtained an accuracy of 98.66%, and with three variables (event, sarcasm, location) obtained 98.24%. The second-best performing algorithm was the K-Neighbors Classifier, which obtained 94% accuracy with one variable (event), while the regression showed an R2 close to 73.56%. Under two variables (event, sarcasm), the second algorithm obtained 94.79% accuracy, while under three variables (event, sarcasm, location), the algorithm obtained 93.91% accuracy (Table III). The two best algorithms were then tested using 400 data. The best result was obtained with the K-Neighbors Classifier, which only produced 88 errors out of 400 data.
Finally, according to the data collected and processed through the K Neighbors Classifier algorithm, the process was completed where, according to the model, it returns the frequency of tweets for each stream and the location of each tweet issued that is related to stream overflows, finding that the proposed model works in the best case with an error rate of 0.22, generating an alert to the population according to the location and proximity of these events as shown in Figure 6.
Figure 6: Web map generated by the early warning model for stream overflow events in Barranquilla based on community data. The map shows an example of identified overflow events, as they match the location associated with the analyzed Twitter posts
Discussion
An early warning model was built from information on stream overflow events in the city of Barranquilla, Colombia, obtained from the social network ''X.'' To improve information filtering, a filter by coverage area was added, which allowed obtaining information only from the required area. This search method immensely helped to delimit the collection of required information and reduce the data that generated noise in the data cleaning and subsequent training. Therefore, it is possible to consider data cleaning as the totality of operations performed on the data to eliminate anomalies and obtain an accurate and unique representation 20. One of the major drawbacks was the high degree of duplicity in the information, since when searching by area of coverage and keywords, the information contained repeated results; this significantly increased the amount of information in the database. In the same sense, before training the algorithm, it was necessary to label the data obtained; this classification was done manually since the classification criteria can be subjective.
Some of the most representative diagrams obtained during the exploratory analysis were the bar diagram, scatter, and intensity plots. These allowed during the exploratory study to determine the behavior of each variable 14 and from the graphs and statistics obtained to generate initial hypotheses of the behavior of each of the tested algorithms, unlike statistical inference where the hypotheses are born preliminarily and are subsequently challenged and tested from the confirmatory tests 21. Other exploratory analysis techniques also allow for comparing the data distribution by applying a statistical model. Thus, it is possible to determine which statistical model best fits the trend and behavior of the data 19. In this work, it was possible to obtain different regression graphs and models that allowed for the analysis of the behavior of the data and its trend; likewise, these results allowed for the identification of the models with the best behavior. However, this preprocessing required a pre-trained algorithm, which had to be focused on the Spanish language; for this study, an algorithm trained with news in Spanish was used 17.
During the processing and training of the algorithm using tweets, it is critical to highlight the importance of natural language processing, whose objective is the interaction between the computer and human language 22. It can also be indicated that natural language processing is the ability of machines to process information communicated in human language 23, i.e., natural language processing aims to analyze, understand, and generate language that humans use naturally 24. Thus, text processing seeks to detect and write rules that form structural patterns and then find those patterns in linguistic units such as letters, words, and sentences 22 to be embedded in vectors 24. Additionally, natural language processing has different levels of complexity; each of these represents a type of analysis to be performed to extract specific information; among these levels, it is possible to find morphological, lexical, syntactic, semantic, and pragmatic (25-27).
The morphological level is responsible for analyzing the composition of words, the linguistic level is responsible for establishing the individual meaning of each word, the syntactic level is responsible for investigating the function of each word within the sentence, the semantic level is responsible for establishing the meaning of the sentence from the interaction of words, and the pragmatic level is responsible for analyzing the comprehension of a text 25. The techniques immersed in natural language processing are sentence detection, word segmentation, and discrimination, grammatical tagging, also known as Part of Speech (POS), morphological segmentation, and stopword elimination 28.
Among the best-known applications in the field of natural language processing are content classification and summarization, automatic contextual extraction, sentiment analysis, speech-to-text conversation, and, finally, machine translation 24,29,30. The advances in data augmentation and its usefulness in applying different problems 31. This system is also used as a text classifier using various algorithms 32, where the main challenge is to discriminate from ambiguities 33, obtaining. As a result, there is a binary answer in the classification.
Natural language processing methods are usually used to classify texts. These methods allow for identifying the data’s tendencies, so they are widely used for classification depending on the probability of similarity to a target variable. Among the mostusedmethodstoclassifytextsareK-Neighbor,Logistic Regression, Naive Bayes, SVM, Random Forest 34, and, in some cases, regressions such as Linear regression 35. Algorithms such as Extra Tree and random forest are among the family of random forest methods. This type of algorithm combines the randomness of the subspace and bagging, which trains multiple decision trees slightly different from the data set 36. On the other hand, the K-Neighbor Algorithm is a statistical model that uses the Euclidean distance to determine which data is closer to the data to be classified. Depending on the count found, the target data will be classified accordingly 37. For the case of this study, the K-Neighbor classification algorithm (KNC) was chosen since it presented the best behavior when analyzing and sorting actual data. During the last years, several research has focused on this field, which has allowed rapid progress in the subject to the point that nowadays, it is possible to find natural language applications in cellphone and virtual assistants or different types of call centers 33,38,39.
Finally, this study applied training techniques such as tokenization, which seeks to divide sentences into semantic units; vectorization, which aims to convert the union of semantic units into vectors and, in somecases, the identification of the part of speech (POS) 40, which seeks to identify the function of the previously tokenized word in the context, i.e., whether it is a verb, adverb, adjective, connector and thus establish the weight within the sentence. This type of preprocessing helps to condition the algorithm’s training so that the necessary coincidences and structures are found to predict the classification variables later. Having the information vectorized, mathematical operations are applied to the vectors, seeking as objective the vector similarity between the target variable and the text to be classified. Likewise, although the algorithms with the best statistics were chosen, it was not the ones that showed the best adjustment when evaluating the selected one since overfitting in the models is denoted, which caused unreliable classifications. Given the above, the k-neighbor algorithm was the one that presented the best classification results.
Conclusions
The proposed modelallowed the collection of information relevant to the case study, which allowed the detection of possible events from the collected data and georeferencing them, whereby by changing the different prioritized filters (location and keywords), it is possible to adapt to a problem unique to the region. On the other hand, the exploratory analysis from the regression allowed us to correctly determine a group of algorithms with better behavior, as well as the words with higher frequency in a stream event. An essential factor to mention was the impact of the column or variable ”sarcasm,” as it obtained a significant weight in the exploratory analysis and training since, at the time of vectorizing the data, the selected text favors the resolution of ambiguities in the tweets collected and filtered due to the semantics of each text analyzed, which is strongly altered by the popular vocabulary of the study area
Acknowledgements
Acknowledgements
The authors would like to thank the Twitter team for providing a Twitter academic license, which was useful for data search and algorithm training. These processes involved long time intervals, but the collected information constituted a sufficient and necessary input for executing this research project.
References
License
Copyright (c) 2024 Iván Andrés Felipe Serna-Galeano, Ernesto Gómez-Vargas, Julián Rolando Camargo-López

This work is licensed under a Creative Commons Attribution-NonCommercial-ShareAlike 4.0 International License.
From the edition of the V23N3 of year 2018 forward, the Creative Commons License "Attribution-Non-Commercial - No Derivative Works " is changed to the following:
Attribution - Non-Commercial - Share the same: this license allows others to distribute, remix, retouch, and create from your work in a non-commercial way, as long as they give you credit and license their new creations under the same conditions.





2.jpg)


