DOI:
https://doi.org/10.14483/23448350.19068Published:
01/02/2023Issue:
Vol. 46 No. 1 (2023): January-April 2023Section:
Ingeniería y TecnologíaEvaluation of Strategies Based on Wavelet-ICA and ICLabel for Artifact Correction in EEG Recordings
Evaluación de estrategias basadas en Wavelet-ICA e ICLabel para la corrección de artefactos sobre registros EEG
Keywords:
Artifacts, Alzheimer, alpha, electroencephalography, effect size, E280A, pipelines, precuneus, preprocessing, wICA (en).Keywords:
Artefactos, Alzheimer, Alfa, electroencefalografía, E280A, precuña, preprocesamiento, tamaño del efecto, wICA (es).Downloads
References
Babiloni, C., Barry, R. J., Başar, E., Blinowska, K. J., Cichocki, A., Drinkenburg, W. H. I. M., Klimesch, W., Knight, R. T., Lopes da Silva, F., Nunez, P., Oostenveld, R., Jeong, J., Pascual-Marqui, R., Valdes-Sosa, P., Hallett, M. (2020). International Federation of Clinical Neurophysiology (IFCN) – EEG research workgroup: Recommendations on frequency and topographic analysis of resting state EEG rhythms. Part 1: Applications in clinical research studies. Clinical Neurophysiology, 131(1), 285-307. https://doi.org/10.1016/J.CLINPH.2019.06.234 DOI: https://doi.org/10.1016/j.clinph.2019.06.234
Bigdely-Shamlo, N., Mullen, T., Kothe, C., Su, K. M., Robbins, K. A. (2015). The PREP pipeline: Standardized preprocessing for large-scale EEG analysis. Frontiers in Neuroinformatics, 9, 1-19. https://doi.org/10.3389/FNINF.2015.00016/BIBTEX DOI: https://doi.org/10.3389/fninf.2015.00016
Castellanos, N. P., Makarov, V. A. (2006). Recovering EEG brain signals: Artifact suppression with wavelet enhanced independent component analysis. Journal of Neuroscience Methods, 158(2), 300-312. https://doi.org/10.1016/J.JNEUMETH.2006.05.033 DOI: https://doi.org/10.1016/j.jneumeth.2006.05.033
Chen, Z., Lu, G., Xie, Z., Shang, W. (2020). A unified framework and method for EEG-Based early epileptic seizure detection and epilepsy diagnosis. IEEE Access, 8, 20080-20092. https://doi.org/10.1109/ACCESS.2020.2969055 DOI: https://doi.org/10.1109/ACCESS.2020.2969055
Cohen, B. A., Sances, A. (1977). Stationarity of the human electroencephalogram. Medical & Biological Engineering & Computing, 15(5), 513-518. https://doi.org/10.1007/BF02442278 DOI: https://doi.org/10.1007/BF02442278
Cohen, J. (1988). Statistical power anaylsis for the behavioral sciences (2nd ed.). Lawrence Erlbaum Associates
Donoho, D. L., Johnstone, I. M. (1992). Ideal spatial adaptation by wavelet shrinkage. Department of Statistics, Stanford University
Duque-Grajales, J. E., Tobón, C., Aponte-Restrepo, C. P., Ochoa-Gómez, J. F., Muñoz-Zapata, C., Hernández-Valdivieso, A. M., Quiroz-Zapata, Y. T., Lopera, F. (2014). Quantitative EEG analysis disease during resting and memory task in carriers and non-carriers of PS-1 E280A mutation of familial Alzheimer's. Revista CES Medicina, 28(2), 165-175
Fabietti, M., Mahmud, M., Lotfi, A., Averna, A., Guggenmos, D., Nudo, R., Chiappalone, M. (2020). Artifact detection in chronically recorded local field potentials using long-short term memory neural network. En 14th IEEE International Conference on Application of Information and Communication Technologies, Tashkent, Uzbekistan. https://doi.org/10.1109/AICT50176.2020.9368638 DOI: https://doi.org/10.1109/AICT50176.2020.9368638
Glerean, E. (2015). Bramila t-test. https://version.aalto.fi/gitlab/BML/bramila/-/blob/master/README.md
He, B., Sohrabpour, A., Brown, E., Liu, Z. (2018). Electrophysiological source imaging: A noninvasive window to brain dynamics. Annual Review of Biomedical Engineering, 20, 171-196. https://doi.org/10.1146/annurev-bioeng-062117-120853 DOI: https://doi.org/10.1146/annurev-bioeng-062117-120853
Iversen, J. R., Makeig, S. (2019). MEG/EEG data analysis using EEGLAB. In S. Supek & C. Aine (Eds.), Magnetoencephalography: From Signals to Dynamic Cortical Networks (2nd ed., pp. 391-406). Springer. https://doi.org/10.1007/978-3-030-00087-5_8 DOI: https://doi.org/10.1007/978-3-030-00087-5_8
Jadah, R. H. S. (2020). Basic electroencephalogram and its common clinical applications in children. In H. Nakano (Ed.), Electroencephalography - From Basic Research to Clinical Applications. IntechOpen. https://doi.org/10.5772/INTECHOPEN.94247 DOI: https://doi.org/10.5772/intechopen.94247
Jiang, X., Bian, G. Bin, Tian, Z. (2019). Removal of artifacts from EEG signals: A review. Sensors, 19(5), e987. https://doi.org/10.3390/S19050987 DOI: https://doi.org/10.3390/s19050987
Kaur, R., Korolkov, M., Hernández, M. E., Sowers, R. (2020). Automatic identification of brain independent components in electroencephalography data collected while standing in a virtually immersive environment - A Deep Learning-Based approach. En 42nd Annual International Conference of the IEEE Engineering in Medicine & Biology Society (EMBC), Montreal, QC, Canada. https://doi.org/10.1109/EMBC44109.2020.9175741 DOI: https://doi.org/10.1109/EMBC44109.2020.9175741
Kim, J., Cho, Y. H., Sung, K., Park, T. K., Lee, G. Y., Lee, J. M., Song, Y. Bin, Hahn, J.-Y., Choi, J.-H., Choi, S.-H., Gwon, H.-C., Yang, J. H. (2019). Impact of cannula size on clinical outcomes in peripheral venoarterial extracorporeal membrane oxygenation. ASAIO Journal, 65(6), 573-579. https://doi.org/10.1097/MAT.0000000000000858 DOI: https://doi.org/10.1097/MAT.0000000000000858
Klug, M., Gramann, K. (2020). Identifying key factors for improving ICA-based decomposition of EEG data in mobile and stationary experiments. bioRxiv. https://doi.org/10.1101/2020.06.02.129213 DOI: https://doi.org/10.1101/2020.06.02.129213
Lee, S. S., Lee, K., Kang, G. (2020). EEG artifact removal by Bayesian Deep Learning ICA. En 42nd Annual International Conference of the IEEE Engineering in Medicine & Biology Society (EMBC), Montreal, QC, Canada. https://doi.org/10.1109/EMBC44109.2020.9175785 DOI: https://doi.org/10.1109/EMBC44109.2020.9175785
Lema-Condo, E. L., Bueno-Palomeque, F. L., Castro-Villalobos, S. E., Ordóñez-Morales, E. F., Serpa-Andrade, L. J. (2017). Comparison of wavelet transform symlets (2-10) and daubechies (2-10) for an electroencephalographic signal analysis. En IEEE XXIV International Conference on Electronics, Electrical Engineering and Computing (INTERCON), Cusco, Peru. https://doi.org/10.1109/INTERCON.2017.8079702 DOI: https://doi.org/10.1109/INTERCON.2017.8079702
Maestú, F., Cuesta, P., Hasan, O., Fernandéz, A., Funke, M., Schulz, P. E. (2019). The importance of the validation of M/EEG with current biomarkers in Alzheimer’s disease. Frontiers in Human Neuroscience, 13, e17. https://doi.org/10.3389/fnhum.2019.00017 DOI: https://doi.org/10.3389/fnhum.2019.00017
Mamun, M., Al-Kadi, M., Marufuzzaman, M. (2013). Effectiveness of wavelet denoising on electroencephalogram signals. Journal of Applied Research and Technology, 11, e339. https://doi.org/10.1016/S1665-6423(13)71524-4 DOI: https://doi.org/10.1016/S1665-6423(13)71524-4
Monachino, A. D., López, K. L., Pierce, L. J. B., Gabard-Durnam. (n.d.). The HAPPE plus Event-Related (HAPPE+ER) software: A standardized processing pipeline for event-related potential analyses. bioRxiv. https://doi.org/10.1101/2021.07.02.450946 DOI: https://doi.org/10.1101/2021.07.02.450946
Ochoa, J. F., Alonso, J. F., Duque, J. E., Tobón, C. A., Baena, A., Lopera, F., Mañanas, M. A., Hernández, A. M. (2017a). Precuneus failures in subjects of the PSEN1 E280A family at risk of developing Alzheimer’s disease detected using quantitative electroencephalography. Journal of Alzheimer’s Disease, 58(4), 1229-1244. https://doi.org/10.3233/JAD-161291 DOI: https://doi.org/10.3233/JAD-161291
Ochoa, J. F., Alonso, J. F., Duque, J. E., Tobón, C. A., Mañanas, M. A., Lopera, F., Hernández, A. M. (2017). Successful object encoding induces increased directed connectivity in presymptomatic early-onset Alzheimer’s disease. Journal of Alzheimer’s Disease, 55(3), 1195-1205. https://doi.org/10.3233/JAD-160803 DOI: https://doi.org/10.3233/JAD-160803
Paradeshi, K. P., Kolekar, U. D. (2017). Removing jaw clench, teeth squeeze and forehead movement EMG artifacts from EEG signal using dynamic size segmentation and multilevel decomposed wavelet with adaptive thresholding. Indian Journal of Science and Technology, 10(29), 1-7. https://doi.org/10.17485/IJST/2017/V10I29/115354 DOI: https://doi.org/10.17485/ijst/2017/v10i29/115354
Pedroni, A., Bahreini, A., Langer, N. (2019). Automagic: Standardized preprocessing of big EEG data. NeuroImage, 200, 460-473. https://doi.org/10.1016/j.neuroimage.2019.06.046 DOI: https://doi.org/10.1016/j.neuroimage.2019.06.046
Pion-Tonachini, L., Kreutz-Delgado, K., Makeig, S. (2019). ICLabel: An automated electroencephalographic independent component classifier, dataset, and website. NeuroImage, 198, 181-197. https://doi.org/10.1016/j.neuroimage.2019.05.026 DOI: https://doi.org/10.1016/j.neuroimage.2019.05.026
Salis, C. I., Malissovas, A. E., Bizopoulos, P. A., Tzallas, A. T., Angelidis, P. A., Tsalikakis, D. G. (2013). Denoising simulated EEG signals: A comparative study of EMD, wavelet transform and Kalman filter. En 13th IEEE International Conference on BioInformatics and BioEngineering, Chania, Greece. https://doi.org/10.1109/BIBE.2013.6701613 DOI: https://doi.org/10.1109/BIBE.2013.6701613
Sintra, T. (1992). Independent component analysis, A new concept. http://mlsp.cs.cmu.edu/courses/fall2014/lectures/extra/ICA.pdf
Suárez-Revelo, J., Ochoa-Gómez, J., Duque-Grajales, J. (2016). Improving test-retest reliability of quantitative electroencephalography using different preprocessing approaches. En 38th Annual International Conference of the IEEE Engineering in Medicine and Biology Society (EMBC), Orlando, FL, USA. https://doi.org/10.1109/EMBC.2016.7590861 DOI: https://doi.org/10.1109/EMBC.2016.7590861
Swarnkar, R., Miyapuram, K. P. (2020). Temporal EEG neural activity predicts visuo-spatial motor sequence learning. Communications in Computer and Information Science, 1333, 204-211. https://doi.org/10.1007/978-3-030-63823-8_25 DOI: https://doi.org/10.1007/978-3-030-63823-8_25
Thomson, D. J. (1982). Spectrum estimation and harmonic analysis. Proceedings of the IEEE, 70(9), 1055-1096. https://doi.org/10.1109/PROC.1982.12433 DOI: https://doi.org/10.1109/PROC.1982.12433
Vajravelu, A., Abdul Jamil, M. M., Wan Zaki, W. S, Govindassamy, M. (2021). Survey and analysis of preprocessing of EEG signal. https://www.lens.org/lens/scholar/article/036-198-693-947-283/main
Wessel, J. R. (2018). Testing multiple psychological processes for common neural mechanisms using EEG and Independent Component Analysis. Brain Topography, 31(1), 90-100. https://doi.org/10.1007/S10548-016-0483-5/tables/1 DOI: https://doi.org/10.1007/s10548-016-0483-5
Winkler, I., Debener, S., Muller, K. R., Tangermann, M. (2015). On the influence of high-pass filtering on ICA-based artifact reduction in EEG-ERP. En 37th Annual International Conference of the IEEE Engineering in Medicine and Biology Society (EMBC), Milan, Italy. https://doi.org/10.1109/EMBC.2015.7319296 DOI: https://doi.org/10.1109/EMBC.2015.7319296
How to Cite
APA
ACM
ACS
ABNT
Chicago
Harvard
IEEE
MLA
Turabian
Vancouver
Download Citation
Recibido: de febrero de 2022; Aceptado: de septiembre de 2022
Abstract
In quantitative electroencephalography, it is of vital importance to eliminate non-neural components, as these can lead to an erroneous analysis of the acquired signals, limiting their use in diagnosis and other clinical applications. In light of this drawback, preprocessing pipelines based on the joint use of the Wavelet Transform and the Independent Component Analysis technique (wICA) were proposed in the 2000s. Recently, with the advent of data-driven methods, deep learning models were developed for the automatic labeling of independent components, which constitutes an opportunity for the optimization of ICA-based techniques. In this paper, ICLabel, one of these deep learning models, was added to the wICA methodology in order to explore its improvement. To assess the usefulness of this approach, it was compared to different pipelines which feature the use of wICA and ICLabel independently and a lack thereof. The impact of each pipeline was measured by its capacity to highlight known statistical differences between asymptomatic carriers of the PSEN-1 E280A mutation and a healthy control group. Specifically, the between-group effect size and the P-values were calculated to compare the pipelines. The results show that using ICLabel for artifact removal can improve the effect size (ES) and that, by leveraging it with wICA, an artifact smoothing approach that is less prone to the loss of neural information can be built.
Keywords:
alzheimer, artifacts, E280A, effect size, electroencephalography, pipelines, precuneus, preprocessing, wICA..Resumen
En la electroencefalografía cuantitativa es de vital importancia la eliminación de componentes no neuronales, ya que estos pueden conducir a un análisis erróneo de las señales adquiridas, limitando su uso al diagnóstico y otras aplicaciones clínicas. Dado este inconveniente, en la década de 2000 se propusieron flujos de preprocesamiento basados en el uso conjunto de la Transformada Wavelet y la técnica de Análisis de Componentes Independientes (wICA). Recientemente, con la llegada de los métodos basados en datos, se desarrollaron modelos de aprendizaje profundo para el etiquetado automático de componentes independientes, lo que generó una oportunidad para la optimización de las técnicas basadas en ICA. En este estudio, se añadió ICLabel, uno de estos modelos de aprendizaje profundo, a la metodología de wICA para explorar su mejora. Para evaluar la utilidad de este enfoque, se comparó con diferentes flujos que muestran el uso de wICA e ICLabel de forma independiente y en su ausencia. El impacto de cada flujo se midió mediante su capacidad para resaltar diferencias estadísticas conocidas entre los portadores asintomáticos de la mutación PSEN-1 E280A y un grupo de control sano. Se calcularon específicamente el tamaño del efecto entre grupos y los valores P para comparar los flujos. Los resultados muestran que el uso de ICLabel para la eliminación de artefactos puede mejorar el tamaño del efecto (ES) y que, al aprovecharlo con wICA, se puede construir un enfoque de suavizado de artefactos menos susceptible a la pérdida de información neuronal.
Palabras clave:
alzheimer, artefactos, E280A, electroencefalografía, flujos, precuña, preprocesamiento, tamaño del efecto, wICA..Resumo
Na eletroencefalografia quantitativa é de vital importância a eliminação de componentes não neurais, pois estes podem levar a uma análise errônea dos sinais adquiridos, limitando seu uso em diagnósticos e outras aplicações clínicas. Diante dessa desvantagem, pipelines de pré-processamento baseados no uso conjunto da Transformada Wavelet e da técnica de Análise de Componentes Independentes (wICA) foram propostos na década de 2000. Recentemente, com o advento dos métodos orientados a dados, foram desenvolvidos modelos de aprendizado profundo para rotulagem automática de componentes independentes, configurando uma oportunidade para a otimização de técnicas baseadas em ICA. Neste artigo, o ICLabel, um desses modelos de aprendizado profundo, foi adicionado à metodologia wICA para explorar sua melhoria. Para avaliar a utilidade dessa abordagem, ela foi comparada a diferentes pipelines que exibem o uso de wICA e ICLabel de forma independente e sua falta. O impacto de cada pipeline foi medido por sua capacidade de destacar diferenças estatísticas conhecidas entre portadores assintomáticos da mutação PSEN-1 E280A e um grupo de controle saudável. Especificamente, o tamanho do efeito entre grupos e os valores P foram calculados para fazer a comparação entre os pipelines. Os resultados mostram que o uso do ICLabel para remoção de artefatos pode melhorar o tamanho do efeito (TE) e que, aproveitando-o com o wICA, uma abordagem de suavização de artefatos menos suscetível à perda de informação neural pode ser construída.
Palavras-chaves:
Alzheimer, artefatos, E280A, eletroencefalografia, pré-cunha, pré-processamento, tamanho do efeito, wICA..Introduction
Electroencephalography (EEG) is a noninvasive technique with established clinical applications in epilepsy and potential applications in other conditions (Chen et al., 2020; Jadah, 2020; Lee et al., 2020). It is a low-cost, portable alternative and has become an appropriate tool to explore new diagnostic tests and research applications. This technique could provide accurate information to understand the current state of neurological conditions such as Alzheimer’s disease (Maestú et al., 2019). Furthermore, it allows the researcher to obtain a representation of electrophysiological brain activity with a high temporal resolution (He et al., 2018). However, one of the limitations for the clinical use of EEG is the amount of noise, which impedes clear findings.
The EEG signal contains a large amount of noise from both internal and external sources, such as eye blinking, muscular activity, and the electrical line frequency (Fabietti et al., 2020). As a result, the preprocessing stage has become vital, as it increases the quality of the final data. Among the commonly used preprocessing stages that allow the researcher to achieve an optimal signal-to-noise ratio are line noise removal, the detection and interpolation of bad channels, epoch segmentation to ensure the assumption of quasi-stationarity, the elimination of defective EEG epochs, and the removal of physiological artifacts (Bigdely-Shamlo et al., 2015; Kim et al., 2019; Suárez-Revelo et al., 2016). Different studies show that preprocessing EEG signals has a big impact on the final results (Vajravelu et al., 2021; Pedroni et al., 2019). Therefore, it is necessary to find ways to identify and separate the different sources of noise in order to obtain a clean EEG signal for subsequent analyses (Jiang et al., 2019; Kaur et al., 2020).
One way to extract different neural sources in an EEG signal is the method known as independent component analysis (ICA), introduced in the 1990s to solve the problems associated with blind source separation (Sintra, 1992). This technique decomposes the multichannel EEG into maximally independent processes related to brain activity or artifacts. In EEG processing, ICA has positioned itself as one of the main techniques for artifact correction, and research continues to be done in order to optimize the procedure. For example, Klug and Gramann (2020) recently pinpointed that the high-pass filter frequency cut-off must be adjusted differently depending on whether the EEG was acquired on a mobile or stationary setting. Moreover, obtaining an optimal ICA decomposition is important not only for artifact correction, but also for analyzing information from the neural point of view (Wessel, 2018).
It is possible to perform a manual inspection to classify the sources obtained by the ICA method. However, this can be a tedious task since the independent components (ICs) do not have a particular order or clearly defined interpretations. Recently, with the advent of data-driven methods, machine learning models were developed for the automatic labelling of ICs, which constitutes an opportunity for the optimization of ICA-based techniques. One of the most popular implementations of this is ICLabel, a deep learning model trained on over 200 000 ICs (Pion-Tonachini et al., 2019). This classifier allows categorizing ICs into seven classes: brain, muscle, eye, heart, line noise, channel noise, and ‘others’. The classification is based on features such as scalp topography measurements and power spectral densities (PSD). Other approaches have been developed, such as the work carried out by Lee et al. (2020), who implemented a Bayesian deep learning classifier, albeit trained on a considerably smaller dataset.
Although ICA can be used to separate neural components from artifactual sources, and ICLabel delivers the labels of each of the sources, an optimized technique is needed to perform an adequate cleaning of the signal. This is because the ICA technique operates in the time domain, and, as some sources are in a very narrow frequency range, the separation is not perfect, which can lead to neural information being misclassified. One of the dangers of this misclassification is that, when the researcher eliminates one of the sources according to a mistaken label, he/she may be eliminating representative data of the EEG signal. This drawback can be avoided by performing a frequency-domain analysis with approaches such as wavelet analysis, a time-frequency technique that can be used to perform isolated denoising of the components delivered by ICA, thus avoiding the loss of information. Many methodologies combining ICA and wavelet analysis (wICA) have been developed. In particular, Castellanos and Makarov (2006) developed a simple and automated technique based on wavelet-thresholding for the identification of artifact-contaminated epochs.
This paper aims to explore a new preprocessing pipeline based on the combined use of the wICA and ICLabel techniques. This approach is compared to other pipelines that showcase the independent use of both tools and a lack thereof. Comparing the preprocessing pipelines in terms of their effectiveness for artifact correction is ideal. However, this would imply having a ground truth for clean signals. Therefore, the comparison is performed by evaluating each pipelines’ impact on the statistical discrimination capacity between two groups known to be statistically different: asymptomatic subjects carrying the PSEN1-E280A mutation and healthy non-carriers, as reported by Duque-Grajales et al. (2014) and Ochoa et al. (2017). This mutation is involved in the production of amyloid-β, altering the gene of the Presenilin-1, and causes an early onset familial Alzheimer’s disease.
The paper is organized as follows: the methodology section describes the EEG dataset to be used, the preprocessing pipelines explored, and how the comparisons are carried out. The results section shows the values obtained for each of the pipelines from various perspectives. Finally, the last two sections discuss and draw conclusions from the results.
Methodology
EEG Dataset
EEG data were recorded from 58 electrodes with a midline reference and a sampling rate of 250 Hz, following the international 10-10 standard. The EEG records correspond to two distinct groups. The first group (ACr) consisted of 22 subjects carrying the PSEN1-E280A mutation of the Colombian family. These participants were between 20 and 45 years old and do not have cognitive impairment. The second group (Ctrl-1) comprised 18 subjects from the PSEN1 kindred, but they do not carry the E280A mutation, nor do they have cognitive symptoms or memory complaints. They were between 20 and 59 years old (Ochoa et al., 2017). These groups were previously shown to be statistically different regarding their resting-state relative power at the alpha-2 and theta bands (Ochoa et al., 2017; Duque-Grajales et al., 2014).
Preprocessing Pipelines
Based on the pipeline approaches proposed by Suárez-Revelo et al. (2016), four similar automated preprocessing lines were explored using the FastICA implementation of the Scikit-learn library and the EEGLAB toolbox (Iversen and Makeig, 2019). Here, a common stage is first applied, based on the PREP pipeline (Bigdely-Shamlo et al., 2015), which performs line-noise removal, robust referencing, and faulty channel interpolation. Moreover, this stage includes a 1 Hz high-pass filter (FIR filter with zero phase sinc using a Hamming window, order = 3300, transition bandwidth = 1 Hz) in order to remove the low-frequency trends of the signal, as it is well-known that ICA is sensitive to them (Winkler et al., 2015).
The next step in some of the preprocessing pipelines is to apply the FastICA algorithm in order to obtain the independent components needed for the wICA and the ICLabel algorithms. In essence, the ICA algorithm outputs two matrices as solutions to the separation problem: the mixing and the unmixing matrices. Once these solutions are available, the EEG signal is transformed from sensor space to source space via matrix multiplication. The sources are obtained by ‘unmixing’ the EEG data, which is accomplished by multiplying it by the unmixing matrix. Similarly, to mix the data, the sources are multiplied by the mixing matrix. It is important to note that, in order to solve the separation problem through ICA, it is necessary to define the number of sources that are expected to be mixed in the EEG data. Naturally, the real value of this number is unknown, but, by setting it to the rank of the EEG data matrix, one can still obtain physiologically meaningful sources. This is the approach used in this paper.
The overall goal of this work is to assess the influence of the mentioned algorithms on the EEG recordings. In this sense, four pipelines, as shown in Figure 1, are evaluated in order to characterize their impact in the between-group effect size obtained from contrasting the relative powers of the EEG bands. The following EEG frequency bands were used: delta (1.5-6 Hz), theta (6-8.5Hz), alpha 1 (8.5-10.5 Hz), alpha 2 (10.5-12.5 Hz), beta 1 (12.5-18.5 Hz), beta 2 (18.5-21 Hz), beta 3 (21-30 Hz), and gamma (30-45 Hz).
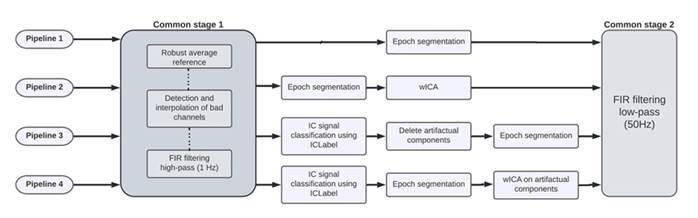
Figure 1: Summary of EEG preprocessing pipelines. The solid line represents an independent workflow for each pipeline. The dotted line represents an internal workflow. Common stage 1 corresponds to the PREP pipeline with a 1 Hz high-pass FIR filter. Common stage 2 corresponds to a 50 Hz low-pass FIR filter.
As shown in Figure 1, the pipelines are implemented in the following steps:
Pipeline 1. Here, only the common stage 1 is applied, along with segmentation into 5 s epochs. Small-time windows hinder the quantification of slow rhythms (1.5 Hz lower delta limit in our case). Similarly, in large windows, the signal may no longer be stationary. 12 s are considered to be the stationarity upper limit, as suggested by B. A. Cohen and Sances (1977). Thus, choosing 5 s constitutes a midpoint that is short enough to assume stationarity and simultaneously allows for at least seven cycles of our lowest frequency of interest.
Pipeline 2. Following the common stage 1, an ICA decomposition is obtained through FastICA. Subsequently, the wICA algorithm is implemented as suggested by Castellanos and Makarov (2006). It consists of wavelet-thresholding not the observed EEG, but the de-mixed independent components. Specifically, a discrete wavelet transform is applied to the independent components, which is based on the Daubechies 6 mother wavelet, following the conclusions of Salis et al. (2013). Nevertheless, much has been discussed about which wavelet function is best for EEG denoising (see, among others, Lema-Condo et al., 2017; Mamun et al., 2013). For the thresholding, the universal fixed form relation proposed by Donoho and Johnstone (1992) is used. After the wICA correction is done, the signal is transformed back into sensor space in order to obtain the denoised EEG.
Pipeline 3. After the common stage 1, independent components are found through the FastICA algorithm and are afterwards classified using the ICLabel tool into one of the following classes: ocular, muscular, cardiac, neuronal, line noise, channel noise, and others. In this case, only the neural components were retained for EEG reconstruction.
Pipeline 4. Once the common stage 1 has been applied and the components have been classified, the segmentation of the signal is implemented, following the same methodology described for pipeline 2, but with wICA being applied only to those components labeled by the ICLabel model as ocular, muscular, cardiac, line noise, channel noise, and others.
Finally, a 50 Hz low-pass filter (FIR filter with zero phase sinc, with Hamming window, order = 264, transition, bandwidth = 12.5 Hz) is applied in all pipelines. This filter is applied because the main feature of this study is the power of the resting-state EEG signal, which is between 0.5 and 45 Hz (Babiloni et al., 2020). This filter is not applied prior to the ICA procedure, as high-frequency information may be relevant to the separation of sources. After the preprocessing pipelines is complete, the relative power is obtained by estimating the power spectral density using the multitaper technique (Thomson, 1982). This spectrum is then divided into the EEG bands for study, and, finally, each band is normalized with respect to the total power of the spectrum. The obtained relative powers can be interpreted as the percentage of power that each band contributes with respect to the total power spectrum (Suárez-Revelo et al., 2016).
Comparisons Between Groups
A single dataset was used to assess the impact of each of the preprocessing pipelines studied on the between-group effect size (ES) by using the Hedgesg test and a non-parametric T-test. To evaluate the ES, the Hedgesg test provides information on the differences between the comparison groups in terms of standard deviations (J. Cohen, 1988). The rule of thumb used for interpretation consists of labeling ESs around 0.50 as ‘medium’ and those around or above 0.80 as ‘large’ (J. Cohen, 1988). On the other hand, the Bramila test is a ‘non-parametric’' two-sample T-test that, instead of relying on the t-distribution, uses permutations of group labels to estimate the null distribution (Glerean, 2015). Relative power among the frequency bands was calculated by focusing on four regions of interest (ROIs), as shown in Figure 2A: frontal, temporal, central, and parietal-occipital (Babiloni et al., 2020).
In addition to the ROIs, one of the independent components found by Ochoa et al., (2017a) (Figure 2B) was evaluated. This component is associated by the author to the precuneus region. Hereafter, it is labeled as the ‘precuneus component’ (PC). Moreover, the ratio between the theta and alpha-2 powers is also explored, as it was selected by Ochoa et al. (2017a) as an index to track changes in the E280A population and was able to successfully discriminate between the two groups explored: asymptomatic carriers and healthy controls.
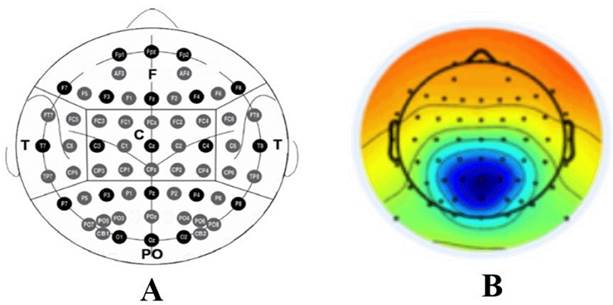
Figure 2: A) Schematic picture of the 10-10 electrode system and the ROIs generated: F: frontal, T: temporal, C: central, PO: parietal-occipital. B) Precuneus component topography.
The ES is presented for each pipeline and each ROI (including the PC), with this value being the main comparison metric between pipelines. As the main interest is to validate pipelines, focus is placed on the bands that have already shown statistically significant differences between groups, such as theta (Ө), alpha-2 (α2), and their ratio (Ө/α2) (Duque-Grajales et al., 2014; Ochoa et al., 2017). The above implies having an ES for each of the bands studied, which complicates the comparison. To solve this problem, the results are aggregated into a single score (‘ES Score’) defined as the cumulative sum of the absolute values of each of the effect sizes of a pipeline along the evaluated bands:
 (1)
(1)
As suggested by the Equation, for the pipeline i, the absolute values of the effect sizes are aggregated along the studied bands (subindex j). Thus, the proposed ES Score reflects the accumulated ES of all the bands for a given pipeline with a single number. The larger the ES Score for a given pipeline, the greater the ES for that pipeline along the explored bands (although not necessarily in the same proportion for each one).
Results
The relative power graphs obtained for each of the defined regions (ROIs) are presented below (Figure 3) by applying the different pipelines to two different study groups (ACr and Ctrl-1) for each EEG band. In the delta (δ), theta (Ө), alpha-1 (α1), and beta-2 (β2) bands, the Ctrl-1 group shows an increase in relative power with respect to the ACr group. This pattern is broken in the following cases: pipelines 1 and 2 in the delta band at the frontal region, and pipeline 1 in the alpha-1 band at the central, temporal, and parieto-occipital regions. On the other hand, the beta-3 (β3) and alpha-2 (α2) bands present a pattern where the ACr group has greater relative power than the Ctrl-1 group. In the beta-1 (β1) band, no noticeable differences were found. Finally, the gamma (૪) band does not follow a clear pattern, except in the parieto-occipital region, where the ACr group has a greater relative power.
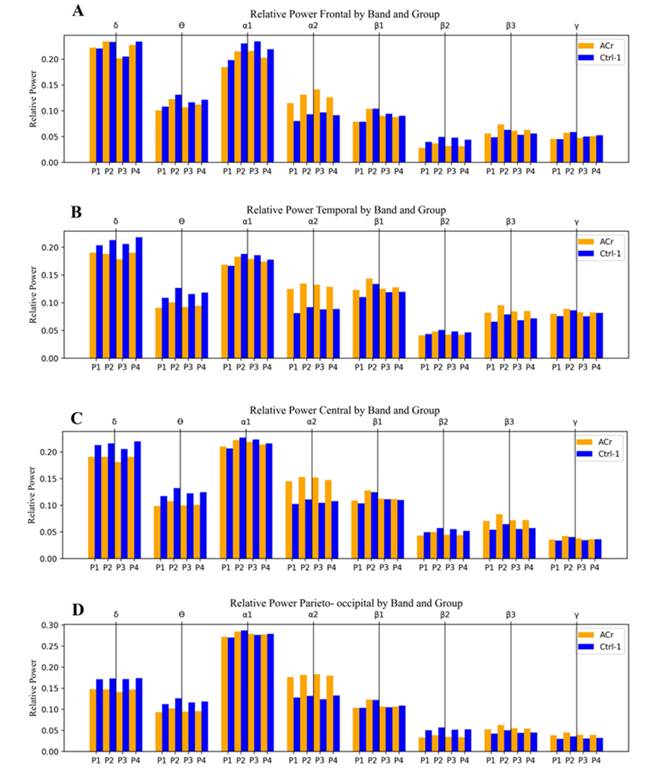
Figure 3: Relative power in the different ROIs: A) frontal, B) temporal, C) central, D) parieto-occipital. P1: pipeline 1, P2: pipeline 2, P3: pipeline 3, P4: pipeline 4.
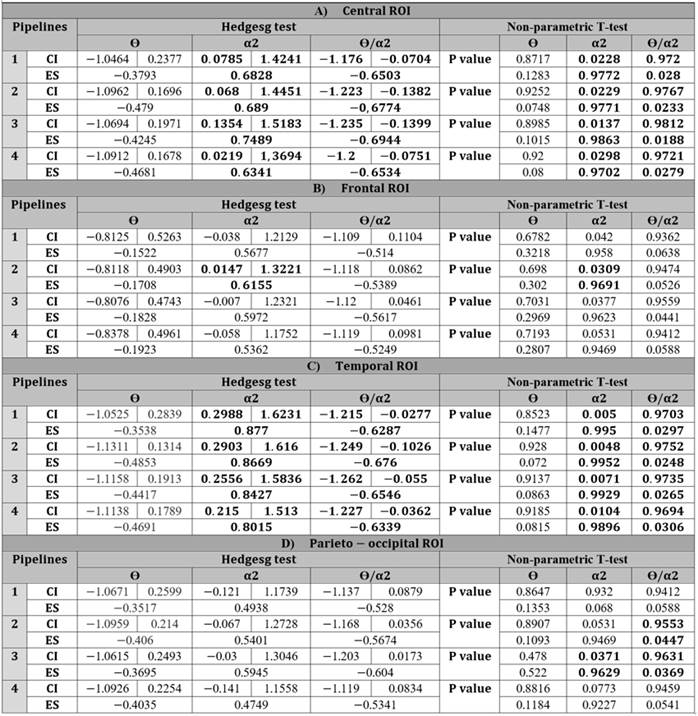
For the theta and alpha-2 bands, the statistical significance of the results shown in Figure 3 is presented in Table 1.
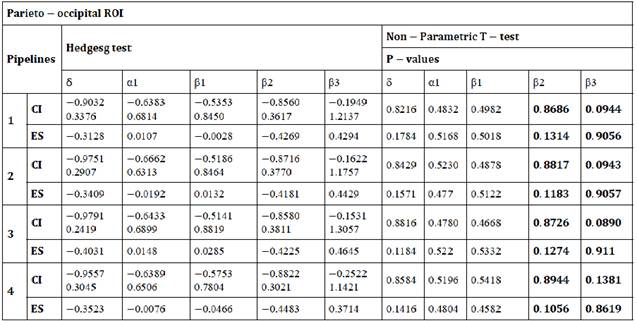
Table 1: Differences between pipelines estimated for ROIs: A) Central, B) Frontal, C) Temporal, D) Parieto-occipital. ES: effect size, CI: Confidence Interval for effect size.
For the other bands, the statistical significance of the results is shown in Appendix 1. Figure 4 shows a comparison of the application of different pipelines to the same signal, where notable differences are observed for the indicated region. Figure 4A shows the signal obtained after applying only the common preprocessing pipeline while using the FIR filter and the robust reference. In Figure 4B, a smoothing of the signal is observed when applying pipeline 2 which, in addition to what is applied in pipeline 1, has the wICA method. In Figure 4C, a notable change is evidenced by eliminating the components corresponding to the identified artifacts. Finally, in Figure 4D, the effect of pipeline 4 is observed, where, in contrast to pipeline 2, only the artifactual components are filtered by the wICA procedure.
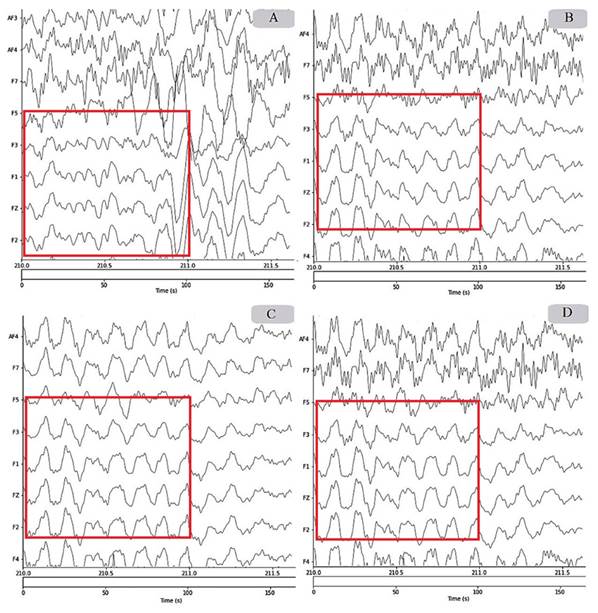
Figure 4: Comparison of the preprocessing pipelines: A) without wICA, B) wICA, C) deleted artifactual components, D) wICA in artifactual components.
The following Tables present the results of the Hedgesg and Bramila tests applied in MATLAB. The Hedgesg test is used to calculate the effect sizes (ES), and a confidence interval (CI) is assigned to each one. The ES was calculated in such a way that a positive value indicates that the carriers have higher values than the non-carriers, and a negative value indicates that the carriers have lower values than the non-carriers. ESs with confidence intervals that crossed the zero boundary were ignored. In addition to the effect size, the Bramila test is used to calculate the p-value, which supports the ES inferred by the Hedgesg test. P-values lower than 5% are considered statistically significant.
The data to be analyzed is distributed in two ways: Table 1 shows the results for the previously defined ROIs, and Table 2 contains information about the power from the precuneus component. For all Tables, the statistically significant values are highlighted in bold.
Table 2: Differences between the pipelines estimated for the precuneus component. ES: effect size, CI: Confidence Interval for effect size. The ES Score aggregates the results along the three bands to allow for an overall comparison of the pipelines.
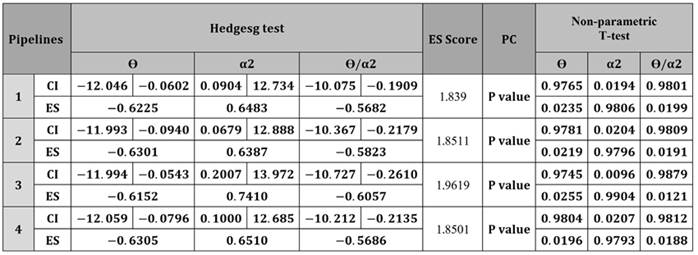
Table 2 has the advantage that all its results are statistically significant, so it is used to compare the pipelines.
Discussion
In this article, the effect of different artifact correction pipelines on EEG signals was explored. The pipelines made use of ICA-based methods supplemented with the ICLabel tool in order to determine the artifactual sources present in the recordings. Nevertheless, the results, regardless of the pipeline, will be discussed first. For Table 1, the theta band resulted in negative values for all pipelines and ROIs, indicating that the control group presented higher values than the ACr group. Similarly, for the alpha-2 band, positive values were obtained for all pipelines and ROIs, indicating that the ACr group has higher values than the control group. The above shows that the results of Table 1 agree with the theta and alpha-2 relative powers of the ROIs shown in Figure 3.
The relevance of activity in the theta and alpha-2 bands during the neurodegenerative process has been demonstrated by Duque-Grajales et al. (2014), and our results regarding the theta and alpha-2 bands agree with the ones reported in that study, mainly because, for the theta band there is a significant increase in the control group in comparison to the ACr group and, for the alpha-2 band, there is a noticeable increase in the ACr group in relation to the control group for the different regions of interest. Despite agreeing with Duque-Grajales et al. (2014), in our results, not all band-ROI combinations have statistical significance; the theta band, for example, does not have statistical significance in any of the ROIs (Table 1). Likewise, for the alpha-2 band, the temporal and central ROIs had statistical significance in every pipeline, but, for the frontal ROI, the results are only significant for pipeline 2. In the parietal-occipital ROI, the results are not significant in any of the pipelines. The results obtained for the precuneus component (Table 2) show that the difference between the ACr and Ctrl-1 groups is statistically significant for all pipelines in the theta and alpha-2 bands, along with their ratio. Overall, this study only shows statistical significance for every pipeline in the precuneus component (theta, alpha-2, and its ratio), as well as for the central and temporal ROIs (alpha-2 band and the theta/alpha-2 ratio).
In addition to the power analysis, the effect of applying different preprocessing pipelines is discussed from the visual inspection shown in Figure 4. Some differences were found when comparing the performance of the wICA-based preprocessing pipelines to pipeline 1, demonstrating the beneficial effect of this procedure. In general, noise reduction and signal smoothing against brain artifacts is evidenced in pipelines 2, 3, and 4. Despite the fact that pipeline 3 shows the smoothest signal in Figure 4, it is possible that, because of its drastic removal of components, it induces losses of relevant neuronal information. Although hard evidence of this cannot be provided, a wICA-based approach may be more appropriate, as it is less drastic. In particular, Paradeshi and Kolekar (2017) showed that the use of the wICA technique preserves neural activity. On the other hand, it is difficult to spot differences between pipelines 2 and 4 by visual inspection of Figure 4. Therefore, the comparison must be made in a more quantitative manner.
This numerical comparison between pipelines can be done through Table 2, as all its values are statistically significant. When comparing the pipelines through the ES Score proposed in the methodology section, it was found that pipeline 3 has the highest value. Ochoa et al. (2017a) obtained analogous results by using a preprocessing approach similar to pipeline 2. However, in the theta band, their results (ES = -0.75) were considerably better than those found in this study (ES = -0.6152, Table 2). Similarly, in the alpha-2 band, the effects sizes (ES = 0.77) are greater than the ones obtained herein (ES = 0.7410, Table 2), but, in this case, the difference is smaller. There are many possible causes for these differences. For example, Ochoa’s implementation was in MATLAB, whereas our implementation was in Python.
As was mentioned before, pipeline 3 has the best ES Score, but it is debatable whether it can be regarded as the best. For example, if it is discovered by manual inspection that a neural component was mislabeled as an artifactual one, then pipeline 3 will lose this information. The closest alternative to pipeline 3 is pipeline 4, as they both make use of ICLabel to assign classes to the independent components found, with the main difference being what is done with this information: pipeline 3 drastically removes the components, whereas pipeline 4 merely smooths them. Which pipeline is sounder depends on our stance regarding the confidence and certainty of the classes provided by ICLabel. Another possible strategy may be changing pipeline 3 to only perform the cancellation if the label is provided with a high certainty, i.e., if the class probability overcomes a certain threshold.
On the other hand, pipelines 2 and 4 are closely tied to 2nd place, as they have similar ES Scores. Pipeline 4 can be regarded as even softer than pipeline 2 since the former only smooths the artifactual components and the latter smooths everything. The fact that pipeline 2 obtained a slightly better score than pipeline 4 may be caused by the softer nature of the latter. A possibly better alternative to pipeline 4 is given in recent studies, which have used another way of combining the wICA technique with an ICA labeling tool (be it MARA, ICLabel, or another) (Monachino et al., n.d.; Swarnkar and Miyapuram, 2020). It consists of performing wICA in all components and then a new ICA decomposition, which is then labeled with some tool. Finally, a subsequent cancellation of artifactual components is carried out. Although this approach was not explored in our work, it is considered that it may improve upon pipeline 3 and 4, as it follows the logic of the wICA stage, bettering the signal quality for the later ICA decomposition, which results in a better component labeling and thus in a lower probability of label mismatches for the artifactual components cancellation. Nevertheless, label mismatches are still possible, so considering the class probability when canceling components is recommended.
From a clinical perspective, the most relevant results correspond to the findings obtained for the precuneus component and the alpha-2 band in the temporal ROI. The precuneus component has the advantage of having a completely statistical significant Table, but the magnitude of the ES values only achieves the ‘medium’ category (mean = 0.625) when using the classification proposed by B. A. Cohen and Sances (1977). On the other hand, the Table for the temporal region (Table 1C), even though it does not have statistical significance in all its values, does indeed stand out in the alpha-2 band by having both high ES values (mean = 0.847) and statistically significant results. Overall, the best differentiating factor corresponds to the alpha-2 band in the temporal region through pipeline 1 (ES = 0.8770, P-value = 0.005). This result is quite unexpected, as the first pipeline is precisely the one without artifact correction measures. Nevertheless, this pattern was only observed in the temporal ROI; in general, pipeline 1 does not show better results with respect to its alternatives when examining the other ROIs and the precuneus component. This indicates that, overall, it is better to perform the artifact correction measures.
Conclusions
In this article, different pipelines were evaluated in order to identify which of them could optimize the effect size. Regarding the precuneus component, it was identified that the pipeline that obtained the best performance with respect to the ES was pipeline 3, followed by pipelines 2 and 4. From the point of view of future development, the approach of pipeline 4 is more susceptible to be improved upon, as it leverages both well-known and recent techniques (wICA and ICLabel). As the automatic labeling of ICA components has the potential to largely impact EEG preprocessing pipelines focused on automatization, future work will focus on exploring other ways to approach the joint use of wICA and ICLabel. One of the proposed approaches is making use of class probability thresholds to cancel only the artifactual components that comply with a certainty criterion. This work highlights the relevance of preprocessing pipelines as tools to improve existing statistical differences between clinically different populations. Many relevant results may be hidden underneath the artifacts that contaminate physiological signals.
Acknowledgements
Acknowledgements
The authors would like to thank the Ministry of Science, Technology, and Innovation (MinCiencias) for its financial support to the project Identificación de biomarcadores preclínicos en enfermedad de Alzheimer a través de un seguimiento longitudinal de la actividad eléctrica cerebral en poblaciones con riesgo genético [Identification of preclinical biomarkers in Alzheimer’s disease by means of longitudinal monitoring of brain activity in populations with genetic risk], identified with code 111577757635.
References
Appendix 1
Table A: Differences between pipelines in δ, α1, β1, β2, β3 estimated for the frontal ROI. ES: effect size, CI: Confidence Interval for effect size.
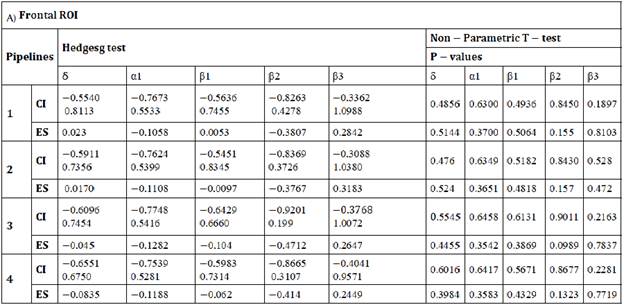
Table B: Differences between pipelines in δ, α1, β1, β2, β3 estimated for central ROI. ES: effect size, CI: Confidence Interval for effect size.
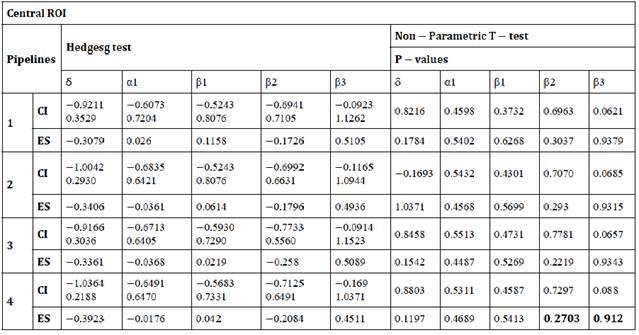
Table C: Differences between pipelines in δ, α1, β1, β2, β3 estimated for temporal ROI. ES: effect size, CI: Confidence Interval for effect size.
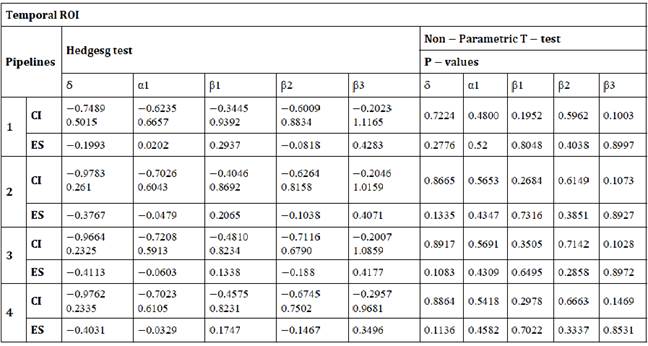
Table D: Differences between pipelines in δ, α1, β1, β2, β3 estimated for parietal-occipital ROI. ES: effect size, CI: Confidence Interval for effect size.
License
Copyright (c) 2023 Luisa-María Zapata-Saldarriaga, Angie-Dahiana Vargas-Serna, Jesica Gil-Gutiérrez, Yorguin-Jose Mantilla-Ramos, John-Fredy Ochoa-Gómez

This work is licensed under a Creative Commons Attribution-NonCommercial-ShareAlike 4.0 International License.
When submitting their article to the Scientific Journal, the author(s) certifies that their manuscript has not been, nor will it be, presented or published in any other scientific journal.
Within the editorial policies established for the Scientific Journal, costs are not established at any stage of the editorial process, the submission of articles, the editing, publication and subsequent downloading of the contents is free of charge, since the journal is a non-profit academic publication. profit.

