DOI:
https://doi.org/10.14483/23448393.20025Publicado:
2023-10-19Número:
Vol. 28 Núm. 3 (2023): Septiembre-diciembreSección:
Ingeniería MecánicaConstruction of Formability Limit Curves for Low-Carbon Steels Used in the Manufacture of Pressure Cylinders
Construcción de curvas límite de formabilidad para aceros de bajo carbono utilizados en la manufactura de cilindros a presión
Palabras clave:
anisotropy, deep drawing, metallic sheet, mechanical properties, stretching (en).Palabras clave:
anisotropía (es).Descargas
Referencias
J. E. Barbosa, I. H. García, and J. Fuentes, “Estimación vía experimental de la formabilidad de láminas de aluminio de pureza comercial,” Rev. Lat. Metalurgia Mat., vol. 29, no 2, pp. 128-134, Dec. 2009. [Online]. Available: http://ve.scielo.org/scielo.php?script=sci_arttext&pid=S0255-69522009000200008
D. R. Askeland and W. J. Wright, Ciencia e ingeniería de los materiales. México, D.F: Cengage Learning, 2017.
C .L. Casadiego, J. E. Barbosa, and I. H. García, “Determinación experimental de la formabilidad de láminas de acero SG295 mediante sus propiedades tensiles,” Rev. Col. Tec. Av., vol. 1, no. 29, pp. 9-15, 2017. [Online]. Available: https://doi.org/10.24054/16927257.v29.n29.2017.2480 DOI: https://doi.org/10.24054/16927257.v29.n29.2017.2480
ASM International, Metals handbook volume 14. Forming and forging. USA: ASM International, 1996.
A. E. Tekkaya and T. Altan, Sheet metal forming: Fundamentals. USA: ASM International, 2012. [Online]. Available: http://search.ebscohost.com.bibliotecavirtual.unad.edu.co/login.aspx?direct=true&db=nlebk&AN=513307&lang=es&site=eds-live&scope=site
R. Gedney, Tensile testing for determining the formability of sheet metals. Norwood, MA, USA: ADMET Inc., 2013.
J.A. Schey, Introduction to manufacturing processes. USA: McGraw-Hill, 2000.
S. Kalpakjian and S. R. Schmid, Manufactura, ingeniería y tecnología. México, DF: Pearson Educación, 2008.
R. Gedney, Measuring the plastic strain ratio of sheet metals. Norwood, MA, USA: ADMET Inc., 2013.
J. E. Barbosa, I. H. García, and V. García, “Análisis de la formabilidad de láminas de acero AISI 304 con diferentes espesores mediante sus propiedades de tracción” Rev. UIS Ing., vol. 21, no 4, pp. 97-106, Dec. 2022. https://doi.org/10.18273/revuin.v21n4-2022009 DOI: https://doi.org/10.18273/revuin.v21n4-2022009
Standard test methods for determining forming limit curves, ASTM E 2218, ASTM International, West Conshohocken, 2015.
S. K. Paul, “Prediction of complete forming limit diagram from tensile properties of various steel sheets by a nonlinear regression based approach,” J. Manuf. Processes, vol. 23, pp. 192-200, 2016. https://doi.org/10.1016/j.jmapro.2016.06.005 DOI: https://doi.org/10.1016/j.jmapro.2016.06.005
S. K. Paul, “Controlling factors of forming limit curve: A review,” Adv. Ind. Manuf. Eng., vol. 2, art. 100033, 2021. https://doi.org/10.1016/j.aime.2021.100033 DOI: https://doi.org/10.1016/j.aime.2021.100033
R. Shang, Z. Shao, and J. Lin, “A review on modeling techniques for formability prediction of sheet metal forming,” Int. J. Lightweight Mat. Manuf., vol. 1, no. 3, pp. 115-125, Sep. 2018. https://doi.org/10.1016/j.ijlmm.2018.06.003 DOI: https://doi.org/10.1016/j.ijlmm.2018.06.003
Standard test methods for tension testing of metallic materials [metric], ASTM E 8M, ASTM International, West Conshohocken, 2013.
Standard test methods for tensile strain-hardening exponents (n – values) of metallic sheet materials, ASTM E 646, ASTM International, West Conshohocken, 2016.
Standard test methods for plastic strain ratio r for sheet metal, ASTM E 517, ASTM International, West Conshohocken, 2018.
Steel sheet, plates and strip for gas cylinders, JIS G 3116, Japanese Standards Association (JIS), Tokyo, 2020.
M. J. Serenelli, M. A. Bertinetti, and J. W Signorelli, “Influencia de la textura cristalográfica en la dispersión de coeficientes de lankford en una chapa de acero galvanizada de bajo carbono,” Mec. Comp., vol. XXVII, no. 14, pp. 993- 1001, Nov. 2008. [Online]. Available: https://cimec.org.ar/ojs/index.php/mc/article/view/1467
J. A. Newell, Ciencia de materiales, aplicaciones en ingeniería. México, DF: Alfaomega, 2010.
D. R. Kumar, “Formability analysis of extra-deep drawing steel,” J. Mat. Processing Tec., vol. 130-131, pp. 31-41, Dec. 2002. https://doi.org/10.1016/S0924-0136(02)00789-6 DOI: https://doi.org/10.1016/S0924-0136(02)00789-6
K. Sipos, J. Martínez, N. Burgos, and H. Pesenti, “Aceros para embutido profundo: fabricación, caracterización, microestructura y texturas,” Rev. Metalurgia, vol. 41, no. Extra, pp. 58-63, Dec. 2005. http://dx.doi.org/10.3989/revmetalm.2005.v41.iExtra.999 DOI: https://doi.org/10.3989/revmetalm.2005.v41.iExtra.999
S. P. Keeler and W. G. Brazier, “Relationship between laboratory material characterization and press-shop formability,” Microalloying, vol. 75, pp. 517-530, 1975.
Cómo citar
APA
ACM
ACS
ABNT
Chicago
Harvard
IEEE
MLA
Turabian
Vancouver
Descargar cita
Recibido: 12 de octubre de 2022; Revisión recibida: 5 de julio de 2023; Aceptado: 22 de agosto de 2023
Abstract
Context:
The aim of this study is to determine the formability of SG295 (2,2 mm thick) and SG325 (2,3 mm thick) steel sheets, as well as their relationship with the sheets’ behavior in deep drawing and stretching operations. To this effect, chemical, metallographic, and mechanical analyses of the sheets were carried out.
Method:
The chemical analysis was carried out via optical emission spectrometry, and the metallographic structure was analyzed using the ASTM E3 standard. The intrinsic properties related to the formability of materials such as the elongation to fracture for a 50 mm gauge length, the conventional yield limit at 0,2% elongation, the ultimate strength, the strain hardening exponent, and the anisotropy coefficient at 15% elongation were determined through tensile tests according to ASTM E8M, ASTM E646, and ASTM 517. Forming limit curves were determined under ASTM E2218, for which a device was designed, built, and attached to a universal testing machine.
Results:
The results for the SG295 and SG325 steel sheets were as follows: tensile strength; 450 and 520 MPa; elongation at fracture: 24,9 and 17,2 %; strain hardening exponent: 0,24 and 0,19; normal anisotropy: 1,64 and 1,29; planar anisotropy: 0,23 and -0,02. The FLD0 determined from the formality limit curves (FLCs) for the two steel sheets showed ε1 values of 0,281 and 0,336, respectively.
Conclusions:
Although the intrinsic properties (such as A50, n, and rm) of the SG295 steel sheet show values related to a greater formability, the FLCs show that SG325 steel performs slightly better due to its greater thickness.
Keywords:
anisotropy, deep drawing, metallic sheet, mechanical properties, stretching.Resumen
Contexto:
El objetivo de este trabajo fue determinar la formabilidad de láminas de acero SG295 (2,2 mm de grosor) y SG325 (2,3 mm de grosor), así como su relación con el comportamiento de éstas frente a operaciones de estirado y embutido profundo. Para tal fin, se realizaron análisis químicos, metalográficos y mecánicos en las láminas.
Método:
El análisis químico se realizó mediante espectrometría de emisión óptica, y la estructura metalográfica se analizó utilizando el estándar ASTM E3. Las propiedades intrínsecas relacionadas con la formabilidad de los materiales, tales como el alargamiento a la fractura para una longitud de referencia de 50 mm, el límite de rendimiento convencional al 0,2% de elongación, la resistencia última, el exponente de endurecimiento por deformación y el coeficiente de anisotropía al 15% de elongación se determinaron mediante pruebas de tracción de acuerdo con ASTM E8M, ASTM E646 y ASTM 517. Las curvas límite de formabilidad se determinaron bajo la norma ASTM E2218, para lo cual se diseñó, construyó y acopló un dispositivo a una máquina universal de ensayos.
Resultados:
Los resultados para las láminas de acero SG295 y SG325 fueron los siguientes: resistencia a la tracción: 450 y 520 MPa; elongación hasta fractura: de 24,9 y 17,2 %; exponente de endurecimiento por deformación: 0,24 y 0,19; anisotropía normal: 1,64 y 1,29; anisotropía planar: 0,23 y -0,02. Los FLD0 determinados a partir de las curvas límite de formalidad (CLF) para las dos láminas de acero mostraron valores para ε1 de 0,281 y 0,336 respectivamente.
Conclusiones:
Aunque las propiedades intrínsecas (como A50, n y rm) de la lámina de acero SG295 presentan valores relacionados con una mayor formabilidad, las CLF muestran que el acero SG325 se desempeña ligeramente mejor debido a su mayor espesor.
Palabras clave:
anisotropía, embutido profundo, lámina metálica, propiedades mecánicas, estirado.Introduction
The mechanical formability of metal sheets is very important in the manufacture of structural elements for the automotive industry, electrical appliances, and the overall metalworking industry 1. Formability is the measure of the amount of deformation of a metal sheet before it fails, either by fracture or by localized necking, and it cannot be defined based on a single parameter, but depends, among others, on the particular forming process (for example, deep drawing and stretching operations), on the thickness of the sheet, and, to a large extent, on the intrinsic properties of the material 2,3.
The formability and quality of a product are directly or indirectly influenced by intrinsic properties such as ultimate strength (σu), the elastic limit (σy, 0,2 %), elongation to fracture, the strain hardening exponent (n), normal anisotropy (rm), and planar anisotropy (δr) 4,5.
Elongation to fracture is a measure of the ductility of a material and is therefore related to the formability of a metal sheet 2. The strain hardening exponent n, is a measure of how rapidly a metal becomes stronger and harder due to plastic deformation 6. In a material with a high value of n, the thickness is reduced more uniformly in drawing operations, and the elongation is greater before localized necking appears, which is why it is an indicator of good formability 7. The normal anisotropy rm defines the behavior of a metal sheet in terms of thinning during deep drawing and stretching operations. This occurs in the formation process and is defined by the preferential orientation of the grains and by the alignment of impurities and inclusions through the thickness (mechanical fibration) 8. Additionally, it indicates the ability of the metal sheet to resist thinning or thickening when subjected to drawing operations 6,9. Finally, sheets with a high value of rm, are preferred, given that, in sheets with a low normal anisotropy, localized cracks or necks may appear during the manufacturing process. On the other hand, the planar anisotropy Δr value should be as close to zero as possible; if its value is high, the sheet will deform more in some directions, forming the so-called ears in the drawing process 10.
One of the tests that allow predicting the ease of forming metal sheets and has had an important development is the forming limit diagram (FLD) 1. In this test, a series of metallic strips of different widths, which are marked with a network of circles, are tested according to ASTM E 2218 11. The deformations of the circles are measured along the major and minor axes (ε1 and ε2), classifying the points as good (no localized necking), marginal (localized necking), and fractured. The forming limit curve (FLC) is plotted on the boundary between the good and the marginal points 11. In the sheet forming process, the deformation is uniform up to the maximum stress (i.e., maximum load capacity of the material). Then, diffuse necking occurs, and the deformation is localized only in this area until fracture takes place 12,13.
Over the years, theoretical and empirical models have been developed to predict the formability of sheet metal. Some intrinsic properties of the sheet material have been used by some authors to develop empirical approximations of the FLD, with different levels of adjustment to the experimental results, such as the one proposed by 12 and those described by 14.
The main purpose of this work was to experimentally measure the formability of SG295 and SG325 steel sheets (2,2 and 2,3 mm thick) used by the metalworking industry. To this effect, various specimens were subjected to standardized traction tests: ASTM E 8M 15, ASTM E 646 16, and ASTM E 517 17. This, in addition to the simulative test for determining the FLC as per the ASTM E 2218 standard 11. To support the analysis of the results, the chemical composition of the sheets was determined, and a metallographic analysis was conducted.
This article is structured as follows. Section 2 describes the materials and methods used in the chemical, metallographic, and mechanical characterization of steel sheets. In Section 3, the results are presented, and a discussion is proposed. Finally, Section 4 presents the main conclusions of this research.
Materials and methods
Chemical composition and metallographic análisis
The material’s chemical composition was determined using an optical emission spectrometer (OES). The microstructure was observed and micrographs were taken in a reflected light optical microscope (ZEISS, Axio Scope A1).
Tensile test
The specimens were prepared according to 15, in order to determine the conventional yield limit at a 0,2% elongation (σy, 0,2 %), the ultimate strength (σu), and the elongation to fracture for a 50 mm gauge length (A50) (Fig. 1).
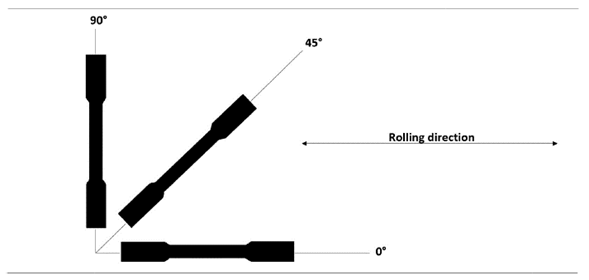
Figure 1: Assembly for cutting the specimens. Orientations of 0, 45, and 90° with respect to the last lamination
The tensile properties were calculated from the data obtained via a universal testing machine (SHIMADZU, AG 250) (Fig. 2).
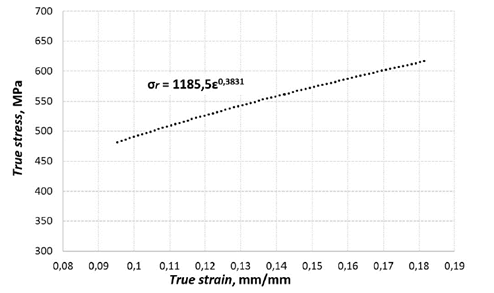
Figure 2: True stress-true strain diagram from the elastic limit to maximum stress
Strain hardening exponent, n
To determine this parameter, the specifications given by the ASTM E 646 standard 16 were followed. As suggested in said document, method B was used because the elastic deformations are much lower than 10% of the total deformation. The value of n was obtained from the slope of the curveσr vs ε in Fig. 2, calculated from Eqs. (1), (2), and (3).

-
σr= true stress
-
ε = true strain
-
k= strength coefficient
-
n = strain-hardening exponent
-
σr= engineering stress
-
ϵ= engineering strain
Normal anisotropy coefficient, r
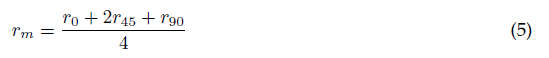
This parameter was determined according to ASTM E 517 17. Four specimens were tested for each orientation with respect to the rolling direction (0, 45, and 90°), up to a deformation of 15%of the original length (lo) and at a test speed of 4 mm/min. rm and Δr were calculated using Eqs. (4), (5), and (6), taking the dimensions shown in Fig. 3 as reference.
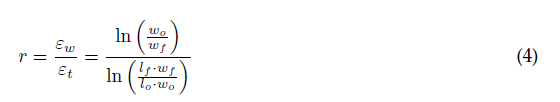
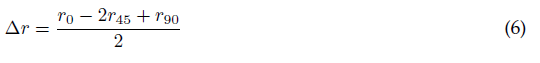
w = width strain
εt = thickness strain
lo = original gauge length
lf = final gauge length
wo = original width
wf = final width
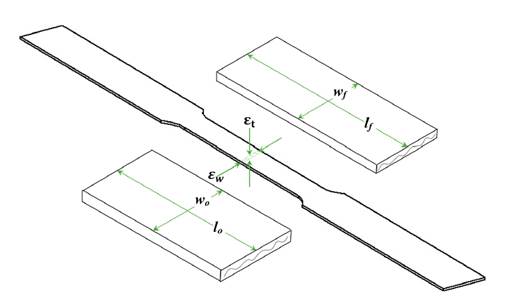
Figure 3: Dimensions for determining the r-values
Forming limit curves
The FLCs were determined according to ASTM E 2218 11. Seven specimens (rectangular strips) with lengths of 175 mm and widths from 25 to 175 mm with 25 mm increments were manufactured and engraved with a grid of circles 2,5 mm in diameter. The sheets were deformed with a lubricated hemispherical punch which was designed exclusively for the test and attached to a universal machine (IBERTEST) (Fig. 4). The deformation percentage of the circles along the length and width of the sheets was determined, and the curve of each sheet was drawn.
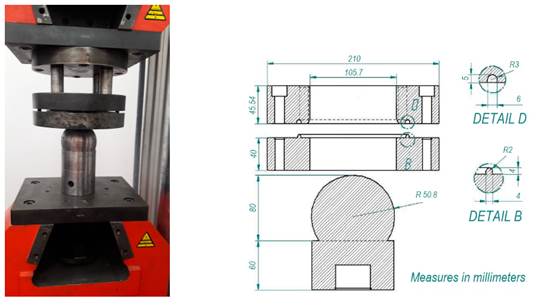
Figure 4: a) Device to determine the FLCs attached to the IBERTEST universal machine; b) measurements of the device according to 11
Analysis and discussion of results
Chemical composition
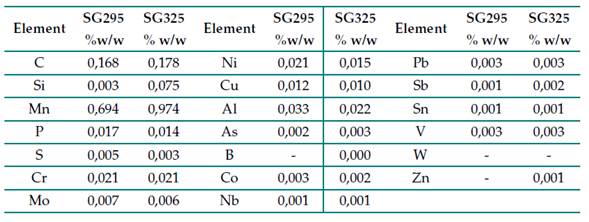
The results of the chemical analysis for the SG295 and SG325 steel sheets are presented in Table I. The values for the main components (carbon, manganese, silicon, phosphorus, and sulfur) are within the limits established for SG295 and SG325 steel sheets as per the JIS G3116 standard 18. Given their chemical composition, the two steels can be classified as carbon steels, and more specifically as mild steels 2.
Table I: Chemical analysis of SG295 and SG325 steels
Microstructure
The metallographic structure of the steels is shown in Fig. 5. As can be seen, the microstructure of SG295 steel is ferrite (90 %) and pearlite (10 %) with very fine equiaxed grains (10 ASTM). No grain elongation is observed in the rolling direction due to the recrystallization process inherent to hot rolling.
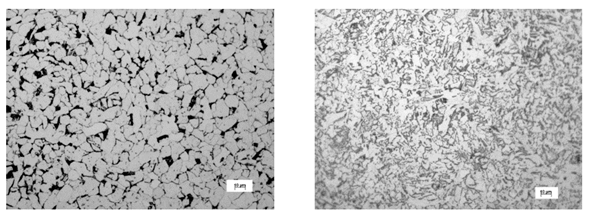
Figure 5: Micrograph of the steel samples: (a) SG295 and (b) SG325. Magnification: 500X; scale bar: 10 μm.
The microstructure of SG325 steel is ferrite (80 %) and pearlite (20 %), with the presence of small globules of retained carbide. The grains are equiaxed due to the recrystallization process inherent to hot rolling. The grain size is very fine (10-11 ASTM), which indicates higher strength but lower ductility. In the case of sheet metal, this fine grain size causes the appearance of orange peel. It should be noted that, in sheet metal forming operations, an ASTM grain size of 7 is preferred 8.
Conventional yield limit at 0,2% elongation, σy (0,2 %), and ultimate strength, σu
The values of these properties are different depending on the orientation in which they were measured (Table II). The average tensile strength for both cases is slightly above the expected limits, i.e., 440 and 490 MP for SG295 and SG325 steel sheets according to JIS G3116 18.
Table II: Results of the tensile tests for the two steel sheets
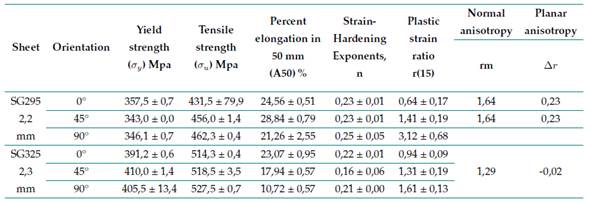
Regarding σy (0,2 %), the values are much higher than expected (295 and 325 MPa) for SG295 and SG325 steel sheets according to 18.
Elongation to fracture for a 50mm gauge length, A50
The tested sheets have a value slightly below the established limits (26 and 22 %) for SG295 and SG325 steel sheets according to 18.
Strain hardening exponent, n
In both cases, the sheets with an orientation of 45° with respect to the last rolling show the lowest value, especially in SG325 steel. These values are slightly below those reported by 8 for annealed low carbon steel (0,26), but they coincide with those presented by 6 for hot-rolled 0,2% carbon steel (0, 22.
Anisotropy coefficient, r
The rm values are slightly above the ranges published by 8 for hot-rolled steel (0,8-1,0). However, they are similar to the range mentioned by 9 for hot-rolled 0,2% carbon steel (1,0-1,6). In both cases, there is a high dispersion of the data, and an increase in anisotropy with the orientation angle is observed, especially in the case of the SG295 sheet. These differences can be associated with the crystallographic texture of the material, as suggested by some authors 19,20.
Forming limit diagrams, FLD
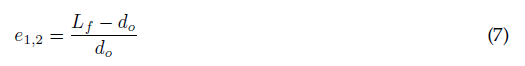
The morphology of the rectangular samples after deformation is shown in Figs. 6 and 7. To measure the deformation of the initial network of circles, the resulting ellipses were classified according to their appearance as good (no localized necking), marginal (localized necking), or fractured. The real deformations in the major (ε1) and the minor axes (ε2) were determined according to Eqs. (7) and (8).

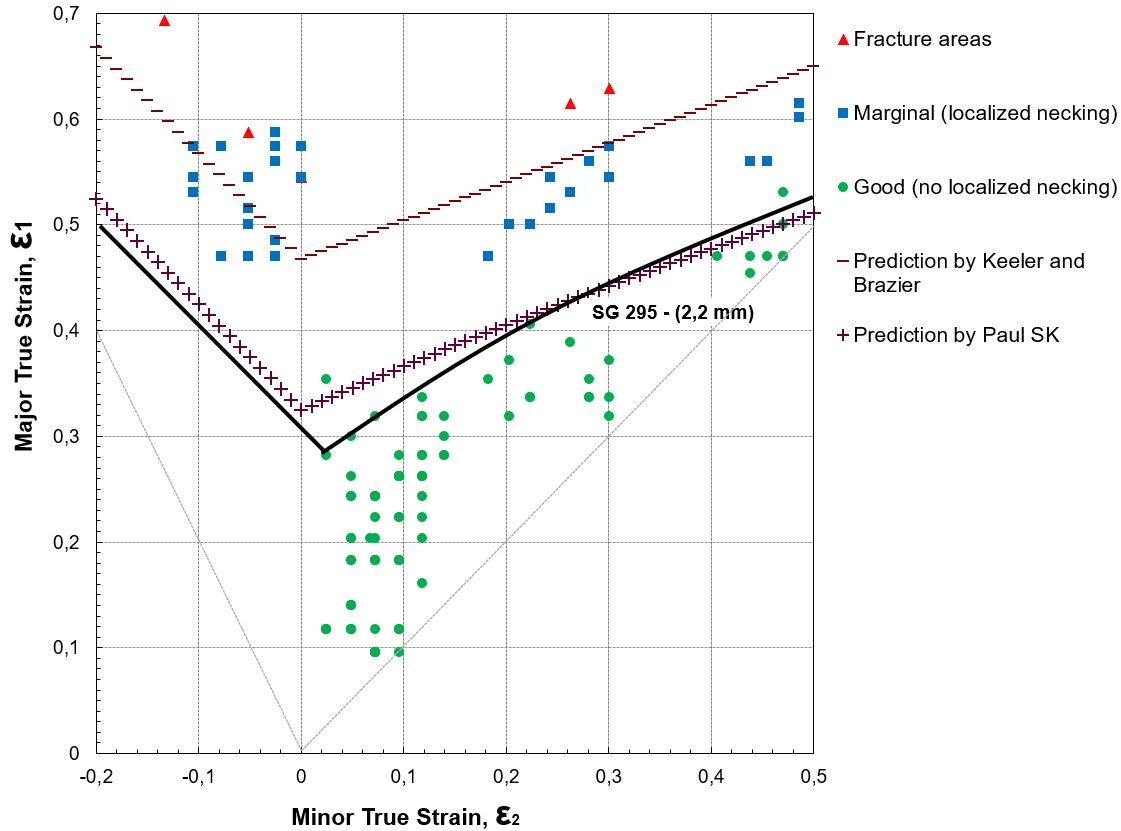
In Figs. 8 and 9, the deformation data of the initial network of circles are represented for SG295 and SG325, respectively. The various points correspond to the deformations of the circles in and around the fault region. Triangles represent ellipses where fractures or fissures occurred, squares represent ellipse marginals, and circles represent good ellipses. Thus, the forming limit curve is the line that separates the good points at the limit or border of the region that contains them.
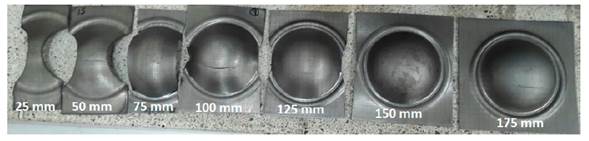
Figure 6: The seven SG325 steel specimens deformed to failure
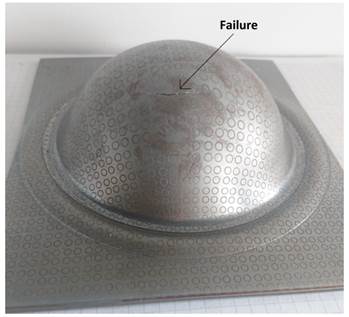
Figure 7: 150 mm wide specimen, where the failure after the test is shown in detail
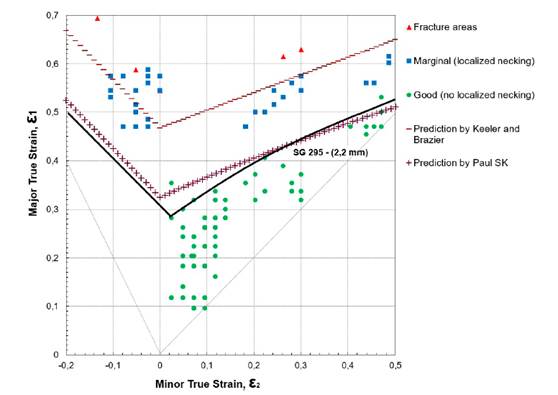
Figure 8: FLD for metallic sheets of SG295 steel
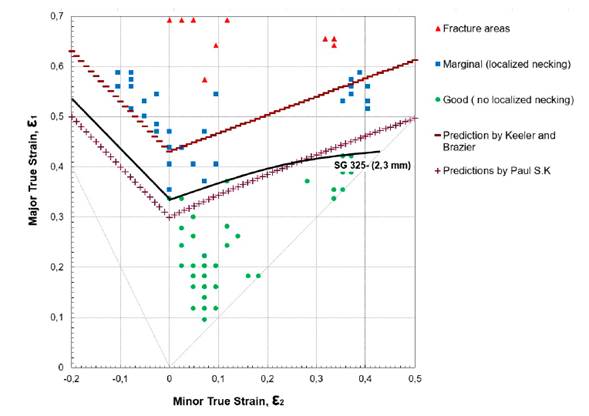
Figure 9: FFLDs for metallic sheets of SG325 steel
The formability limit curves in Figs. 8 and 9 exhibit a similar behavior in both steel sheets. However, the values of the largest true strain ε1, in the flat strain condition FLD0 (the lowest point of the curve) were different: 0,281 and 0,336 for SG295 and SG325, respectively. These values are lower than the 0,385 found by 8 for low-carbon steel and the 0,460 and 0,457 determined by 21 and 22 in low-carbon steels for deep drawing with 2 and 1,4 mm thickness, respectively.
The only difference between the two curves is on the left: the SG325 slider has a steeper slope, and therefore a greater area in the safe zone. This behavior may be the effect of its greater thickness since previous studies have found that the curve rises with the thickness of the sheet (4, 12).
In addition to the experimental curve, Figs. 8 and 9 show two curves with empirical predictions made with the equations of the Keeler and Brazier 23 and Paul S. K. 12 models and the data in Table II. The Keeler and Brazier approximation model depends on the thickness of the shell and the strain hardening exponent n in order to determine the FLD0, while the Paul S. K. model also includes the ultimate strength σu, the elongation to fracture A50, and the anisotropy coefficient r. In both models, the left side of the curve is a straight line with a slope (-1), while the slope on the right side of the curve is 20° in 23 and is determined depending on the value of FLD0 in 12.
In the two steel sheets, it can be seen that the Paul S. K. prediction, the one that contemplates the greatest number of variables in the model, is the one with the best fit and is below the experimental curve, whereas that of Keeler and Brazier 23 is above it.
Conclusions
The results of the chemical and metallographic analysis of the materials classifies them as carbon steels, more specifically mild steels, with ferrite as the main microconstituent and the presence of pearlite and retained carbon globules.
SG325 steel reported better values in the characteristics of tensile strength σu, and the elastic limit σy (0,2 %), while SG295 behaved better against the elongation to fracture A50, the strain hardening exponent n, and the normal anisotropy rm.
In both materials, the values of the anisotropy coefficient increase with the angle of orientation regarding the last lamination.
The forming limit curves are very similar. However, the SG325 sheet achieves a greater area of deformation in the safety condition, which may be due to its greater thickness
Acknowledgements
Acknowledgments
The authors express their gratitude to Universidad Francisco de Paula Santander (UFPS) and Universidad Nacional Abierta y a Distancia (UNAD) for their support.
References
Licencia
Derechos de autor 2023 Jhon Erikson Barbosa Jaimes, Ismael Humberto García-Paez, Claudia Liliana Casadiego-Peralta

Esta obra está bajo una licencia internacional Creative Commons Atribución-NoComercial-CompartirIgual 4.0.
![]()
A partir de la edición del V23N3 del año 2018 hacia adelante, se cambia la Licencia Creative Commons “Atribución—No Comercial – Sin Obra Derivada” a la siguiente:
Atribución - No Comercial – Compartir igual: esta licencia permite a otros distribuir, remezclar, retocar, y crear a partir de tu obra de modo no comercial, siempre y cuando te den crédito y licencien sus nuevas creaciones bajo las mismas condiciones.

2.jpg)