DOI:
https://doi.org/10.14483/23448393.22383Published:
2025-04-21Issue:
Vol. 30 No. 1 (2025): January-AprilSection:
Biomedical EngineeringDevelopment and Validation of a Computer Vision-Based Tool for Automated 3D Dental Model Arch Prediction
Desarrollo y validación de una herramienta basada en visión por computadora para la predicción automatizada de la forma del arco dental en modelos 3D
Keywords:
3D Dental Models, Arch Form Analysis, Dental Morphometrics, Computer Vision, Orthodontic Automation (en).Keywords:
modelos dentales 3D, análisis de la forma del arco, morfometría dental, visión por computadora, automatización en ortodoncia (es).Downloads
References
S.-J. Lee, S. Lee, J. Lim, H.-J. Park, and T.T. Wheeler, “Method to classify dental arch forms," Amer. J. Orthodon. Dentofac. Orthoped., vol. 140, no. 1, pp. 87-96, 2011. https://doi.org/10.1016/j.ajodo.2011.03.016
H.-X. Yang, F.-L. Li, and L.-M. Li, “Comparison of maxillary anterior mathematical proportions among 3 dental arch forms," J. Prosthetic Dent., vol. 130, no. 4, pp. 614-619, 2023. https://doi.org/10.1016/j.prosdent.2021.11.025
J. Tomášik et al., “AI and face-driven orthodontics: A scoping review of digital advances in diagnosis and treatment planning," AI, vol. 5, no. 1, pp. 158–176, 2024. https://doi.org/10.3390/ai5010009
K. Arai and L. A. Will, “Subjective classification and objective analysis of the mandibular dental-arch form of orthodontic patients," Amer. J. Orthodon. Dentofac. Orthoped., vol. 139, no. 4, pp. e315-e321, 2011. https://doi.org/10.1016/j.ajodo.2009.12.032
R. S. Bharadwaj, S. H. Kalgeri, A. T. Shivakumar, V. Doddawad, P. M. Shankar, and S. K. B. B., “Revolutionizing dental health care: An in-depth exploration of technological advancements," Euro. J. Gen. Dent., vol. 13. bo. 1, pp. 001-014, 2024. https://doi.org/10.1055/s-0043-1776321
X. Yang, K. Huang, D. Yang, W. Zhao, and X. Zhou, “Biomedical big data technologies, applications, and challenges for precision medicine: A review," Global Chall., vol. 8, no. 1, art. 2300163, 2024.https://doi.org/10.1002/gch2.202300163
A. Sikri, J. Sikri, V. Piplani, and Y. Thakur, “Applications of artificial intelligence in dentistry: A narrative review," South Asian Res. J. Oral. Dent. Sci., vol. 6, no. 1, pp. 1–10, 2024. https://doi.org/10.36346/sarjods.2024.v06i01.001
Y. Cen et al., “Application of three-dimensional reconstruction technology in dentistry: a narrative review," BMC Oral Health, vol. 23, no. 1, art. 630, 2023. https://doi.org/10.1186/s12903-023-03142-4
Z. H. Ahmed et al., “Artificial intelligence and its application in endodontics: A review," J. Contemp. Dental Prac., vol. 24, no. 11, pp. 912-917, 2024. https://doi.org/10.5005/jp-journals-10024-3593
J. Liu, Y. Chen, S. Li, Z. Zhao, and Z. Wu, “Machine learning in orthodontics: Challenges and perspectives," Adv. Clin. Exp. Med., vol. 30, no. 10, pp. 1065–1074, 2021. https://doi.org/10.17219/acem/138702
C. Elkhill, J. Liu, M. G. Linguraru, S. LeBeau, D. Khechoyan, B. French, and A. R. Porras, “Geometric learning and statistical modeling for surgical outcomes evaluation in craniosynostosis using 3D photogrammetry," Comp. Meth. Prog. Biomedicine, vol. 240, art. 107689, 2023. https://doi.org/10.1016/j.cmpb.2023.107689
M. Vodanovi´c, M. Subaši´c, D. P. Miloševi´c, I. Gali´c and H. Brki´c, "Artificial intelligence in forensic medicine and forensic dentistry," J. Forensic Odonto-Stomatology, vol. 41, no. 2, pp. 30-41, 2023. https://pmc.ncbi.nlm.nih.gov/articles/PMC10473456/
Pretty, I. A., "Forensic dentistry: 1. Identification of human remains," Dental Update, vol. 34, no. 10, pp. 621-630, 2007. https://doi.org/10.12968/denu.2007.34.10.621
S. R. Dutta, P. Singh, D. Passi, D. Varghese, and S. Sharma, "The role of dentistry in disaster man- agement and victim identification: An overview of challenges in Indo-Nepal scenario," J. Maxillofac. Oral Surg., vol. 15, no. 4, pp. 442-448, Dec. 2016. https://doi.org/10.1007/s12663-016-0896-4
R. Ren, H. Luo, C. Su, Y. Yao, and W. Liao, “Machine learning in dental, oral and craniofacial imaging: A review of recent progress," PeerJ, vol. 9, e11451, 2021 https://doi.org/10.7717/peerj.11451
M. Cicciù et al., “3D digital impression systems compared with traditional techniques in dentistry: A recent data systematic review," Materials, vol. 13, no. 8, art. 1982, 2020. https://doi.org/10.3390/ma13081982
S. Kapila, S. R. Vora, S. Rengasamy Venugopalan, M. H. Elnagar, and S. Akyalcin, “Connecting the dots towards precision orthodontics," Orthodont. Craniofac. Res., vol. 26, pp. 8–19, 2023. https://doi.org/10.1111/ocr.12725
F. Schwendicke, W. Samek, and J. Krois, “Artificial intelligence in dentistry: Chances and challenges," J. Dental Res., vol. 99, no. 7, pp. 769–774, 2020. https://doi.org/10.1177/0022034520915714
L. T. Reyes, J. K. Knorst, F. R. Ortiz, and T. M. Ardenghi, “Scope and challenges of machine learning-based diagnosis and prognosis in clinical dentistry: A literature review," J. Clin. Translat. Res., vol. 7, no. 4, pp. 523, 2021. https://www.ncbi.nlm.nih.gov/pmc/articles/PMC8445629/
I. Shafi, A. Fatima, H. Afzal, I. de la Torre Díez, V. Lipari, J. Breñosa, and I. Ashraf, “A comprehensive review of recent advances in artificial intelligence for dentistry e-health," Diagnostics, vol. 13, no. 13, art. 2196, 2023. https://doi.org/10.3390/diagnostics13132196
G. Tullock, “Problems of majority voting," J. Pol. Econ., vol. 67, no. 6, pp. 571-579, 1959. https://doi.org/10.1086/258244
A. Tiwari, A. Garg, B. Virang, S. Sahu, N. Shah, and N. Verma, “Arch form in orthodontics: A review," J. App. Dent. Med. Sci., vol. 4, no. 1, p. 118, 2018. ISSN:2454-2288
M. Memarpour, M. Oshagh, and M. R. Hematiyan, “Determination of the dental arch form in the primary dentition using a polynomial equation model," J. Dent. Child., vol. 79, no. 3, pp. 136-142, 2012. jodc/2012/00000079
S. AlHarbi, E. A. Alkofide, and A. AlMadi, "Mathematical analyses of dental arch curvature in normal occlusion," The Angle Orthodontist, vol. 78, no. 2, pp. 281-287, 2008. https://doi.org/10.2319/121806-516.1
X. Wang et al., "Accuracy of dental arch form in customized fixed labial orthodontic appliances," Amer. J. Orthodon. Dentofac. Orthoped., vol. 162, no. 2, pp. 173-181, 2022. https://doi.org/10.1016/j.ajodo.2021.02.026
How to Cite
APA
ACM
ACS
ABNT
Chicago
Harvard
IEEE
MLA
Turabian
Vancouver
Download Citation
Recibido: 17 de junio de 2024; Revisión recibida: 18 de marzo de 2024; Aceptado: 16 de abril de 2025
Abstract
Context:
Accurate dental arch shape prediction is crucial for orthodontic treatment and personalized dental appliance creation. This study introduces a computer vision-based tool for predicting arch shapes in 3D dental models.
Objective:
To automate the selection of dental arch shapes through mathematical model analysis.
Method:
A dataset of 484 digital dental models was narrowed to 50 through specific criteria. Experts classified these into ovoid, square, and tapered shapes using 3M templates. An automated 3D dental arch shape prediction tool was developed, incorporating automatic alignment, cusp detection, curve fitting with a sixth-order polynomial, and model comparison. Our validations employed attribute agreement analysis, the root mean squared error, the sum of squared errors, and a Gage R&R study.
Results:
This study achieved a 90% agreement rate in the evaluator vs. standard comparison for the lower jaw, as well as 78% for that of the upper jaw. The Gage R&R study confirmed measurement reliability, and the sixth-order polynomial model was identified as optimal for arch shape description. The tool's predictive accuracy was validated through comparative analysis.
Conclusion:
This research introduces an effective automated method for selecting dental arch shapes. The tool demonstrated substantial accuracy, with the potential to significantly enhance orthodontic diagnostic and treatment planning processes. Future research could further refine this methodology by exploring advanced mathematical models and incorporating machine learning techniques to optimize the selection process.
Keywords:
3D dental models, arch form analysis, dental morphometries, computer vision, orthodontic automation.Resumen
Contexto:
La predicción precisa de la forma del arco dental es crucial para el tratamiento ortodóncico y la creación de aparatos dentales personalizados. Este estudio introduce una herramienta basada en visión por computadora para predecir las formas de arcos en modelos dentales digitales 3D.
Objetivo:
Automatizar la selección de formas del arco dental mediante el análisis matemático de modelos.
Método:
De 484 modelos dentales digitales, se seleccionaron 50 mediante criterios específicos, que fueron clasificados por expertos en formas ovoides, cuadradas y cónicas usando plantillas 3M. Se desarrolló una herramienta de predicción automatizada de la forma del arco dental 3D, incorporando alineación automática, detección de cúspides, ajuste de curvas con un polinomio de sexto orden y comparación de modelos. Nuestras validaciones emplearon el análisis de concordancia de atributos, la raíz del error cuadrático medio, la suma de errores cuadráticos y un estudio Gage R&R.
Resultados:
El estudio logró una tasa de concordancia del 90 % en la comparación de evaluador vs. estándar para la mandíbula inferior, además de 78 % para la mandíbula superior. El estudio Gage R&R afirmó la fiabilidad de la medición, y el modelo de polinomio de sexto orden fue identificado como óptimo para la descripción de la forma del arco. La precisión de la herramienta fue validada mediante análisis comparativo.
Conclusión:
Esta investigación introduce un método automatizado para seleccionar formas de arcos dentales. La herramienta demostró una precisión sustancial, con potencial para mejorar significativamente los procesos de diagnóstico y planificación de tratamientos ortodóncicos. Futuras investigaciones podrían refinar esta metodología explorando otros modelos matemáticos e incorporando técnicas de aprendizaje automático.
Palabras clave:
modelos dentales 3D, análisis de la forma del arco, morfometría dental, visión por computadora, automatización en ortodoncia.1 Introduction
The analysis and classification of dental arch shapes play a pivotal role in orthodontics and dentistry. Dental arch shapes are not only indicative of individual oral health but also serve as fundamental elements in the diagnosis and treatment planning of various dental conditions 1,2. Understanding the variations in dental arch forms is essential for effective diagnosis, treatment planning, and orthodontic interventions 3. Traditionally, the classification of dental arch shapes has heavily relied on manual observation and subjective interpretation by orthodontic professionals 4. However, with the rapid advancements in digital imaging technology and computational methods, there are unprecedented opportunities to enhance the accuracy and objectivity of arch shape classification 5-7.
The integration of digital imaging technology has revolutionized the field of dentistry, providing clinicians with high-resolution, three-dimensional representations of dental structures 8. These digital models offer detailed insights into the morphology and spatial relationships of dental arches, allowing for more precise analysis and classification 9. Moreover, computational methods, such as machine learning algorithms and geometric modeling techniques, have emerged as powerful tools for automating the classification process and reducing the inherent subjectivity associated with manual assessments 10,11. Recent developments in these methods have shown particular promise in reconstructing complete jaw morphology from partial fragments - a capability with significant implications for both clinical dentistry and forensic investigations 12.
Beyond clinical applications, dental arch analysis holds significant value in forensic odontology. The unique morphological characteristics of dental arches serve as reliable biometric markers for human identification in mass disasters, criminal investigations, and anthropological studies 13. Unlike other biological features that may degrade postmortem, dental structures maintain their integrity, which makes them crucial for identification when traditional methods fail. Automated classification systems can significantly enhance the efficiency and accuracy of matching antemortem and postmortem dental records, providing valuable tools for forensic experts 14. The potential to predict complete jaw morphology from fragmentary remains could revolutionize disaster victim identification, particularly in cases involving traumatic injuries or skeletal fragmentation.
In addition to these technological advancements, recent studies have explored the efficacy of various machine learning models in accurately classifying dental arch shapes based on specific geometric features and landmarks. For instance, neural networks and support vector machines have shown promising results in identifying unique dental arch characteristics with high levels of precision 15. These computational models benefit from large datasets of digital dental impressions, enhancing their learning capabilities and accuracy over time 16.
By leveraging digital imaging technology and computational methods, orthodontic professionals can now conduct comprehensive analyses of dental arch shapes with greater efficiency and precision 17. Automated classification algorithms can rapidly process large volumes of digital data, identifying subtle variations and patterns that may go unnoticed during manual assessments 18. Furthermore, these algorithms can incorporate objective criteria and standardized metrics, leading to more consistent and reproducible classification outcomes across different practitioners 20.
This study aims to develop a novel methodology for the automated prediction and classification of dental arch shapes using digital dental models and computational techniques. By integrating expertise from orthodontics, mathematics, and computer science, it seeks to address the limitations of traditional classification methods and provide a robust framework for the objective analysis of arch shapes. This methodology is grounded in the application of geometric modeling techniques to identify patterns and distinctive features in digital models of dental arches. Furthermore, the goal is to develop a classification system that can adapt to various dental morphologies and provide accurate and consistent results across different clinical settings.
This document is structured to first introduce the innovative methodology for the automated prediction and classification of dental arch shapes, which leverages digital models and computational techniques. It then presents the findings from the application of this novel approach, followed by a discussion on its efficiency, accuracy, and potential implications for clinical practice. Finally, the conclusions section summarizes the study's contributions to the field of dental arch shape classification and outlines suggestions for future research and development.
2 Methodology
2.1 Data collection
The dataset used included the Colombian population, covering various sexes and ethnic origins, represented through original dental models made from plaster. These models were digitized using the AutoScan-DS-EX scanner, a key step in capturing the intricate details necessary for analyzing dental arch shapes. This study utilized a database of 484 digital models of dental pairs from patients at the Faculty of Dentistry of Universidad Nacional de Colombia, which were collected between 2016 and 2019. To this extensive collection, a detailed selection process was applied, guided by the following inclusion criteria.
This allowed refining the dataset to 50 dental digital models. A significant number of models from the initial group were excluded due to factors such as poor scanning quality or missing teeth in the plaster models.
Table I: Inclusion and exclusion criteria
Inclusion criteria
Exclusion criteria
✓Fully erupted and complete dentitions from first molar to first molar
✓At least one missing tooth in maxilla or mandible
✓ Digital plaster models of good quality, ensuring visibility of all teeth
✓Incomplete dental models
✓ Individuals must be legal adults, aged 18 years and older
✓Altered digital dental models (improperly scanned, few points of view and other errors)
✓Direct and indirect restoration work that affects the normal size and shape of the teeth
✓Congenital defects or deformed teeth
2.2 Arch form classification
This study involved the participation of three evaluators with experience in orthodontics:
-
Evaluator 1: Resident from the Orthodontics and Maxillofacial Orthopedics specialty at Universidad Nacional de Colombia
-
Evaluator 2: Resident from the Orthodontics and Maxillofacial Orthopedics specialty at Universidad Nacional de Colombia
-
Evaluator 3: General dentist from Universidad Autónoma de Manizales
Three evaluators, experts in traditional arch shape classification methods such as observation and the use of morphometric templates, were tasked with classifying the arch shapes. For this analysis and diagnosis, an approach based on the majority vote 21 among the evaluators was used, in order to minimize the subjectivity of individual assessment, thereby improving the objectivity of the evaluation. In total, 50 dental models were classified, and each model was evaluated twice with a 15-day interval to assess the reproducibility and repeatability of the evaluators' classifications.
The arch shapes were classified into three main types: ovoid, square, and tapered. This classification aligns with common clinical practice in orthodontics 22.
The study protocol received approval from the Ethics Committee of the Faculty of Dentistry at Universidad Nacional de Colombia. This took place on September 28, 2020, under minute number 20-20 B.CIEFO-154-2020. This approval demonstrates the ethical and methodological rigor with which the study was approached.
2.2.1 Utilization of 3M morphometric arch form templates
In this study, we used 3M arch form templates designed to classify dental arches into three main shapes: ovoid, tapered, and square (Fig. 1).
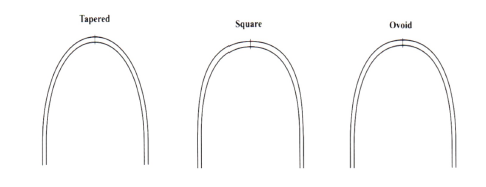
Figure 1: 3M morphometric arch form templates: standardized shapes for orthodontic assessment, showcasing tapered, square, and ovoid forms for classifying patient arch types
2.2.2 Majority voting method
The majority voting method is an approach for aggregating assessments by multiple evaluators into a consensual decision. This method excels in scenarios with evaluators of varied experience levels and mitigates subjectivity in decision-making. By employing this technique, the collective judgment of the evaluators was harnessed for a more precise classification of dental arch shapes (ovoid, tapered, and square) as commonly carried out in orthodontics.
Majority vote consensus for dental arch classification. During the dental arch shape classification, the evaluators independently assessed each model and cast their vote for one of the three shapes. The classification receiving the majority of votes was designated as the winner for that particular model. Mathematically, the consensual decision C for a sample can be represented as follows:
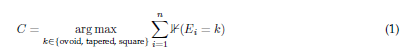
where Ei denotes the classification chosen by evaluator i, and ¥ is an indicator function equal to 1 if the internal condition is true (i.e., if evaluator i chooses classification k), and 0 otherwise. The classification k accumulating the highest total sum of indicator function values among all evaluators is selected as the consensus classification.
Weighted majority vote. To further refine the technique and account for the varying levels of experience among evaluators, a weighted majority vote was implemented. Here, the votes of each evaluator were assigned a weight reflecting their level of expertise, thereby enhancing the reliability of the decision-making process based on experience. The weighted consensus decision C w was determined by
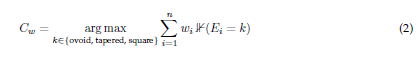
where wi represents the weight given for experience, which is attributed to the vote of evaluator i, wherein more experience carries more weight. This approach ensures that the final classification decision is fair by the evaluators and thus yields a more reliable result.
The use of majority vote consensus and weighted majority voting methods provides reliability to the classification of dental arch shapes, integrating the collective expertise of the evaluators.
2.3 Tool development
This study introduces a comprehensive four-phase methodology for analyzing dental arch shapes, which leverages advanced imaging and mathematical modeling techniques. The initial phase focuses on automatic dental alignment through 3D to 2D image transformation, simplifying the complexity of spatial structures for a more accessible analysis. The subsequent phases involve detailed cusp detection, precise curve fitting using a sixth-order polynomial model based on 21 reference points, and the optimization of arch shape selection through model comparison.
2.3.1 First phase: automatic dental alignment
This phase is based on the 3D to 2D projection and allows applying 2D image processing techniques. This not only simplifies the spatial complexity inherent in 3D shapes but also aligns the models to the center of the image in order to ensure a uniform orientation across all dental models.
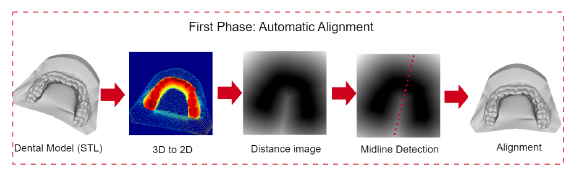
Figure 2: Automatic alignment overview: transformation and alignment of 3D dental models to 2.5D for consistent analysis orientation
Transformation of images from 3D to 2D. The transformation of 3D point clouds into 2D images facilitates the use of established image processing techniques by encoding spatial information into a two-dimensional format. This is achieved through a projection mechanism that maps 3D coordinates onto a 2D plane, thus simplifying the representation of spatial structures.
The projection is executed using a virtual camera system, which is conceptually placed on a plane parallel to the XY plane of the 3D space. The orientation of the camera is defined such that its viewing direction is perpendicular to this plane, aligned along the negative Z-axis in order to capture the depth of the points as variations in pixel intensity.
The mathematical expression for this is given by

where P 3D (x, y, z) represents the coordinates of a point within the three-dimensional space, while P 2D (x,y) corresponds to the resulting coordinates on the two-dimensional flat image. The projection function, denoted as Project, maps each point in the 3D space (P 3D ) to a pixel on the 2D image (P2D). This mapping process encodes the depth information of the Z-axis of each 3D point into the grayscale intensity of the 2D image pixels. By adopting this approach, we preserve the spatial relationships of the original 3D structure, allowing for further analysis and visualizations within a computationally more accessible two-dimensional framework.
When two or more points from the 3D space are projected onto the same point in the 2D space, their centroid is calculated. The centroid represents the average position of all the points, effectively summarizing their collective position in the two-dimensional representation. This approach helps to maintain the integrity of the spatial information despite the projection from 3D to 2D, ensuring that overlapping points are represented by a single, meaningful location on the 2D image.
Distance transformation. The concept of the distance transform (DT) fundamentally deals with calculating the distance from each point on a plane to a specified subset within it. Consider a map I : Ω ⊂ℤ 2 - [0,1] where the domain Q is discretely defined as {1,n} x {1,n}. This mapping I is analogous to a digital binary image, with 0 denoting black and 1 representing white.
The foreground set Ow ∈ Ω is defined as the collection of all pixel locations in Ω where the image value equals 1 (white pixels):

In contrast, the background set OwC ∈ Ω constitutes the complement of Ow, encompassing all pixels not in the foreground.
The DT then generates a map DT : Ow →ℝ, where each pixel p ∈ Ow is assigned the shortest distance to the set OwC. This is formally expressed as follows:

Here, d(p, q) signifies a distance metric between points p and q, with the goal of identifying the nearest point to p in OwC. To this effect, the Euclidean distance is employed for d, thereby designating DT as the Euclidean distance transform (EDT).
To enhance the utility of the EDT, we incorporate three subsequent refinement steps: i) identifying the maximum EDT value along the Y-axis, ii) conducting a simple linear regression analysis, and iii) aligning the model with the centerline of the Cartesian plane, which serves as a standardized reference in our methodology.
Midline detection. The final step in our methodology involves aligning the dental model with the Cartesian plane's centerline. This is achieved by calculating the angle between the detected dental midline and a standard 90° reference line, utilizing the slope ß 1 derived from our regression analysis. The angle 0, representing the deviation from the vertical, is determined as follows:

This equation accommodates the orientation of the gradient ß1, ensuring that the angle 0 finely tunes the model's alignment to the vertical axis of the Cartesian plane by standardizing the reference alignment for all models.
2.3.2 Second phase: cusp detection
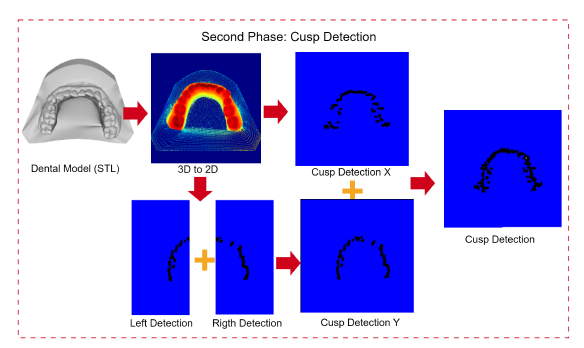
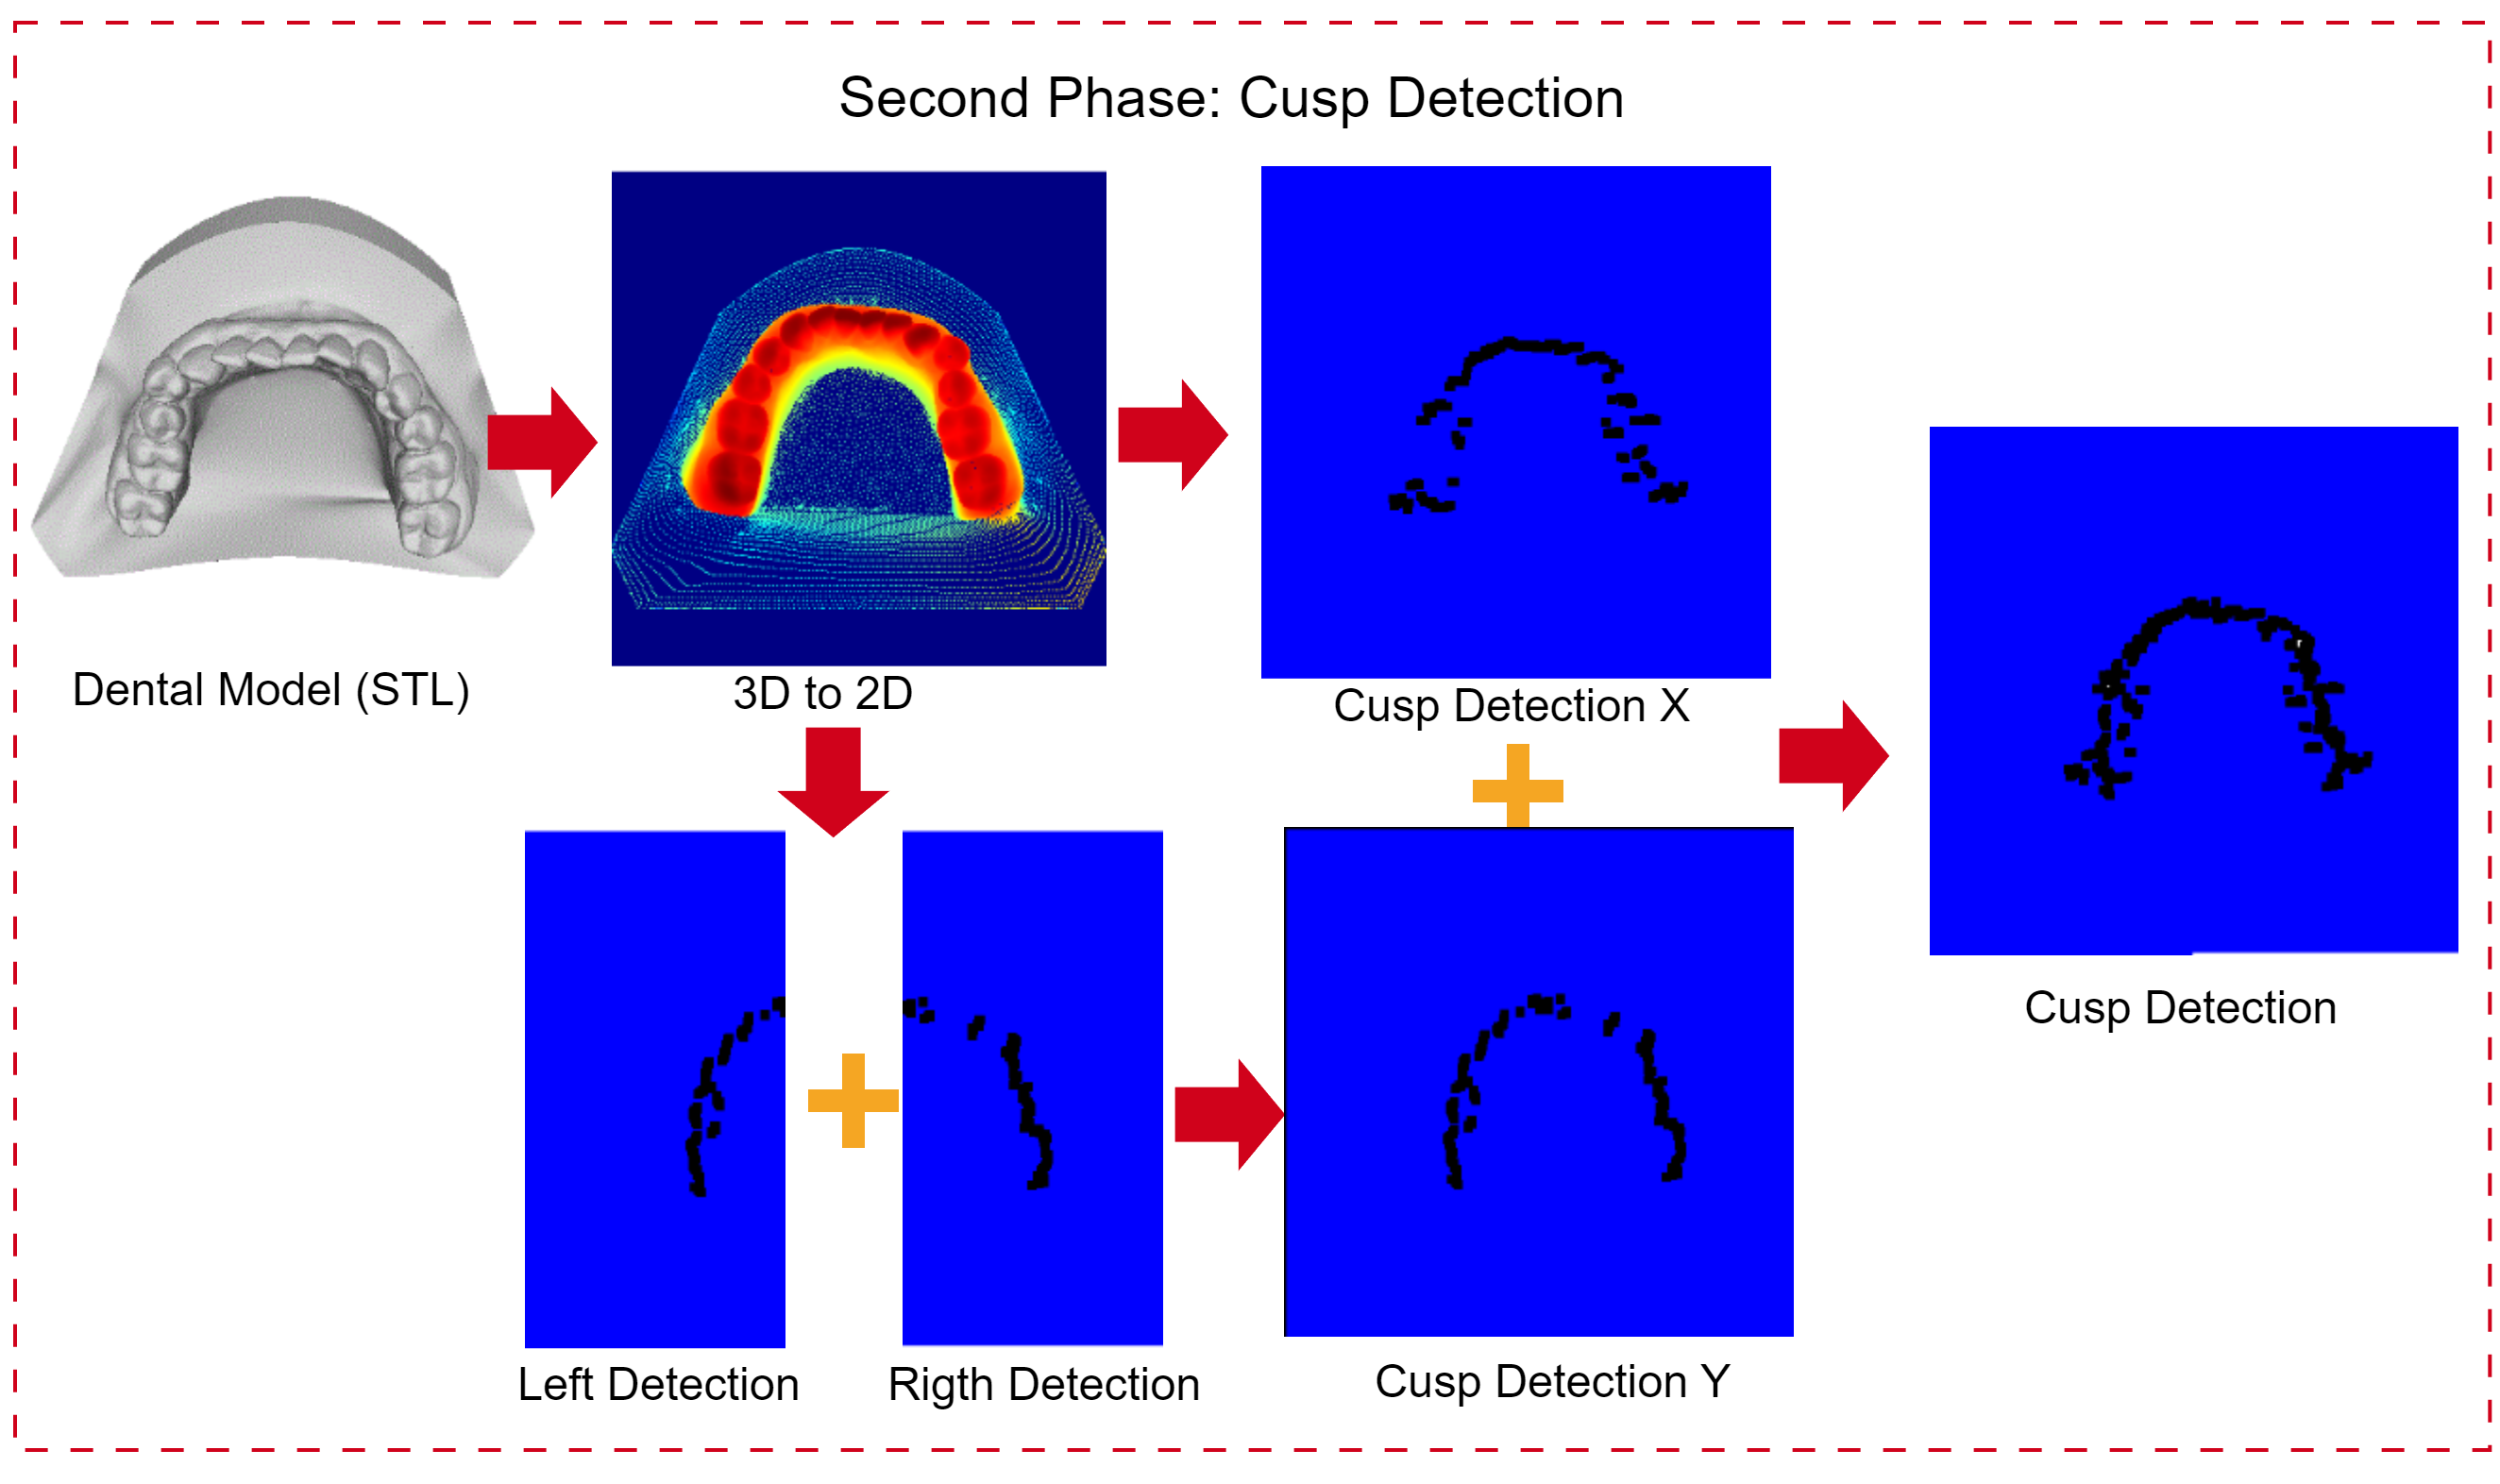
Figure 3: Cusp detection. This approach transforms a 3D dental model into a 2D representation, detects cusps separately on each half along the Y-axis, integrates these detections, and further applies cusp detection along the X-axis, resulting in a detailed cusp image.
This phase begins by transforming the projections from 3D to 2D and then duplicating the 2D image to identify the maximum intensity values along both the X- and Y-axes. It is important to note that this 2D representation is not a simple flat image; it serves as a false-color depth map, where the depth information is encoded in the image's colors
For the Y-axis, an additional process is carried out: the image is bisected to locate the maximum values or cusps. Once these maximum values are identified, the images are merged to produce a complete representation of the cusps in the digital dental model.
During this phase, the following steps were taken:
1. Image halving along the Y-axis. The projected image is divided along the X-axis, enabling a targeted search for maximum pixel values, which enhances cusp detection precision.
2. Maximum value search along the Y-axis. Within each half, an exhaustive search is conducted to find the maximum values along the Y-axis. The corresponding equation is given by:

3. Maximum value search along the X-axis. Unlike that for the Y-axis, the search along the X-axis spans the entire width of the image, so it is not necessary to divide the image to search for the maximum intensity pixels on this axis. The corresponding equation is given by:

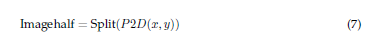
4. Image integration. The previously found maxima are merged into an image that contains all the cusps or maximum intensities along the X- and Y-axes. The process is mathematically represented as:

This formula illustrates the merging of the maximum intensity values found in the left and right halves of the image (along the Y-axis) with those found on the X-axis. The Merge function integrates these individual findings into a single image, highlighting the cusps in the digital dental model.
This strategy enables the localization of essential markers on the dental arch, facilitating a representation of the cusps to be analyzed in subsequent phases.
2.3.3 Third phase: curve fitting
In the third phase, the focus is on selecting mathematical models to accurately describe the shape of the dental arch. This phase utilizes 21 reference points, which are based on morphometric templates and arranged following the Fibonacci series, for mathematical approximation. Various mathematical models were evaluated, but a sixth-order polynomial model was chosen due to its balance between adaptability and the right mix of computational efficiency and precision in modeling the dental arch form 23-25.
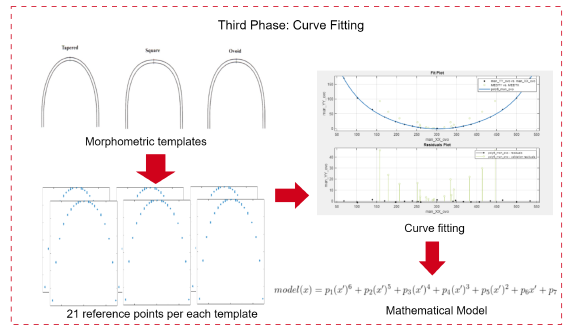
Figure 4: Third phase: curve fitting. This diagram demonstrates how the models for the dental arch shapes are created using templates (tapered, square, ovoid) with 21 reference points. These points enable precise curve fitting with a sixth-order polynomial, representing each arch.
Annotation with reference points. Each template is annotated with 21 reference points to represent the geometry of the dental arch. This includes a central point, complemented by ten points on each side, placed according to the Fibonacci sequence or golden ratio, thus reflecting the natural proportions observed in biological forms.
Exploration of mathematical models. A variety of mathematical models are evaluated, including polynomial functions, Fourier series, exponential models, and Gaussian distributions, in order to identify the most suitable representation of the dental arch shape.
Application to main arch forms. Our curve-fitting process is applied to morphometric templates representing the three main arch forms in orthodontics (ovoid, square, and tapered). This categorization is applied to both the lower and upper jaw, thereby recognizing the unique characteristics and clinical significance of each arch form in the dental model. This approach ensures that the developed mathematical models are broadly applicable and reflect the diverse arch geometries observed in clinical practice.
Selection of the sixth-order polynomial model. The sixth-order polynomial model was chosen for its ability to capture the curvatures of dental arch shapes, offering a balance between model complexity and computational tractability. This decision was supported by extensive literature documenting the effectiveness of polynomial models in modeling dental forms. The model is defined as follows:

where f (x) represents the curve fitting function, with the coefficients p1,... ,p7 optimized to align with the arch shapes.
2.3.4 Fourth phase: optimization of arch shape selection through model comparison
This phase is characterized by a detailed comparative analysis between the cusp images and the sixth-order polynomial models fitted based on the 21 reference points annotated on the morphometric templates.
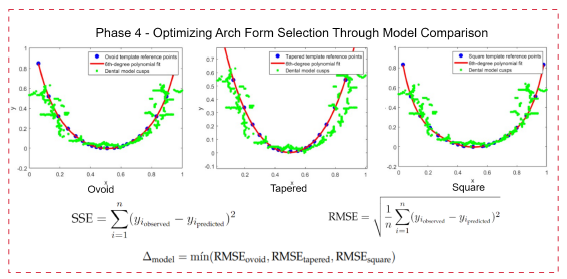
Figure 5: Comparative analysis of dental arch shapes. This diagram illustrates the optimization process of selecting the most accurate mathematical model for each dental arch shape, using error metrics (SSE and RMSE) against reference points from the cusp image.
The comparative analysis was conducted using advanced curve-fitting techniques, where the similarity between theoretical models and empirical data was assessed using error metrics such as the sum of squared errors (SSE) and the root mean square error (RMSE). These metrics provide a quantitative measure of the models' fidelity in replicating the actual shapes of the arch as outlined by the cusp images.
Below is a description of the aforementioned error metrics used to quantify the alignment between the mathematical models and the cusp images:
-
Sum of squared errors (SSE). This metric aggregates the squared differences between the observed cusp locations in the images and the corresponding predictions made by the mathematical model.
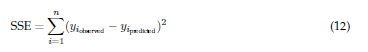
where yi,actual are the actual cusp positions and yi,model are the positions predicted by the model.
-
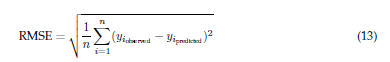
Root mean square error (RMSE). This metric provides a measure of the average magnitude of the error, offering a more interpretable assessment of model performance.
Interpretation of SSE and RMSE in arch shape comparison. The interpretation of the SSE and the RMSE in the context of dental arch shape comparison extends beyond mere numerical values. While high SSE and RMSE values might initially indicate discrepancies between the mathematical models and the actual cusp images, these metrics play a broader and combined role in our analysis:
-
Rather than outright disqualifying models due to high error values, the SSE and RMSE provide insights into which arch shape (ovoid, tapered, or square) best fits the three-dimensional structure of the dental arch under study.
-
Through comparative analysis, these metrics enable the evaluation of relative accuracy among models, identifying the one that most accurately reflects the specific geometries of the empirical data.
Therefore, the essence of SSE and RMSE in our research is to enable a comparative evaluation, highlighting the arch shape model that most faithfully represents the arch form:

Here, Δmodel signifies the model with the lowest RMSE, hence the closest approximation to the actual dental arch shape, emphasizing comparative rather than absolute error analysis to identify the anatomically most accurate model.
For a better understanding of accuracy compared to the other models, we calculated the normalized error percentage for each model while considering the total SSE (the sum of the SSE across all models) and adjusting each model's error in relation to this total:
This percentage reflects the model's error relative to the collective error, where values closer to 100 indicate higher model precision. This numerical representation offers an understandable metric for selecting the most accurate model, which would be the one closest to 100.
2.4 Validation process
This section outlines the methodologies adopted for validating the predictive accuracy of the dental arch form classification model, which integrated attribute agreement analysis, statistical validation metrics, and a Gage R&R study to furnish a thorough evaluation framework.
2.4.1 Attribute agreement analysis
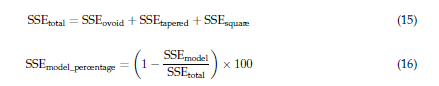
Attribute agreement analysis examines the consistency of assessments by Evaluators 1, 2, 3, and our tool, both within and against a known standard. Fleiss's kappa quantifies this agreement:
where P o is the observed agreement, and P e is the expected agreement by chance.
2.4.2 Statistical validation metrics
As previously mentioned, in order to quantify prediction accuracy, we used the RMSE and SSE, i.e., as expressed in Eqs. (13) and (12), respectively.
2.4.3 Gage R&R study - XBar/R method
The Gage R&R study assesses the measurement system's variability, which is crucial for understanding the sources of variability in the measurements:

Combining these methods ensures a comprehensive and multi-faceted validation of the model's performance, affirming its reliability for clinical application.
3 Results
This research sought to establish an automated process for the selection of dental arch shapes. By employing a comparative analysis of mathematical models, the aim was to autonomously determine a model that exhibits a high degree of alignment with the arch forms commonly observed in clinical orthodontics. The methodology was anchored in the use of morphometric templates and the expertise of evaluators, whose detailed annotations laid the groundwork for model validation. The analysis was divided into four distinct phases, each crafted to achieve the goal of selecting the optimal arch shape.
3.1 Expert labeling
Expert evaluators played an indispensable role in the validation process, providing labeled data that served as the benchmark for comparing models. The precision of their annotations established the gold standard against which the performance of the tool called Automated 3D Dental Arch Shape Prediction was measured.
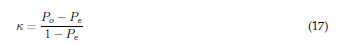
For the labeling of the refined set of models, they were categorized as belonging to the lower or upper jaw. To facilitate an exploratory examination of the results obtained by the evaluators, run charts are presented for both the lower (Fig. 6) and the upper jaw (Fig. 7). These charts aim to visually represent the consistency and variance of expert evaluations, providing insights into the diagnostic agreement across different parts of the dental arch.
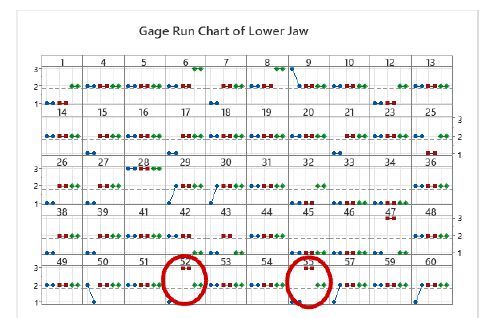
Figure 6: A run chart comparing lower jaw arch form evaluations by three experts at two time points. Arch shapes are coded as 1 (square), 2 (ovoid), and 3 (tapered), with experts labeled as Evaluator 1 (blue), Evaluator 2 (red), and Evaluator 3 (green). Models 52 and 55 resulted in a tie, resolved by a majority weighted vote, where Evaluator 2, the most experienced one, made the final selection.
Comparative Gage R&R study for lower and upper jaw evaluations
The Gage repeatability and reproducibility (R&R) study, utilizing the XBar/R method, was conducted to assess the measurement systems for both lower and upper jaw analyses, showcasing the dynamics between repeatability, reproducibility, and part-to-part variability.
Table II: Comparative variance components from the Gage R&R study for the lower and upper jaws
Source
Lower Jaw
Upper Jaw
VarComp
% Contribution
VarComp
% Contribution
Total Gage R&R
0.029268
12.90%
0.037706
21.55%
Repeatability
0.001257
0.55%
0.004224
2.41%
Reproducibility
0.028011
12.34%
0.033482
19.13%
Part-to-part
0.197693
87.10%
0.137287
78.45%
Total variation
0.226961
100.00%
0.174993
100.00%
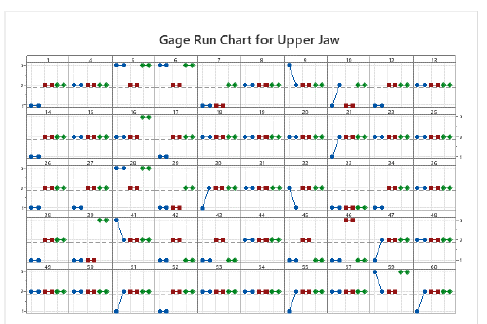
Figure 7: Run chart comparing expert evaluations for upper jaw arch form at two different time points. Arch forms are coded as 1 (square), 2 (ovoid), and 3 (tapered), with evaluators represented by color: Evaluator 1 (blue), Evaluator 2 (red), and Evaluator 3 (green).
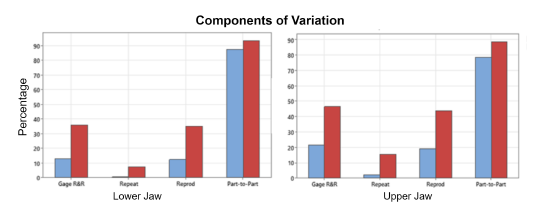
Figure 8: Bar chart illustrating the components of variation in Gage R&R studies for the lower and upper jaws, where blue bars indicate the % contribution and red bars represent the % study variation
3.2 Results of the software tool
Our study evaluated the software comprehensively rather than in isolated segments. From automatic dental alignment to cusp detection and the application of curve fitting techniques, each phase contributed to a unified system. The results provide a comprehensive perspective on the tool's effectiveness in predicting dental arch shapes and highlight its potential impact in the field of dentistry.
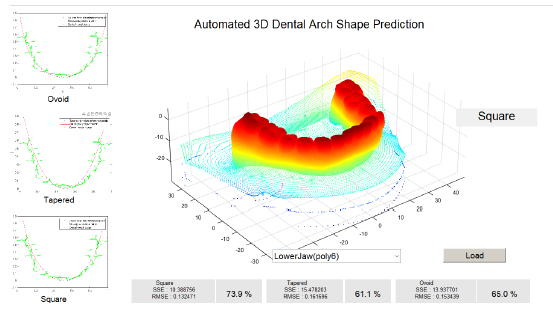
Figure 9: Interface of the tool demonstrating the fit accuracy for different dental arch shapes
3.2.1 Attribute agreement analysis
In the above-presented attribute agreement analysis, the consistency of three evaluators and our method was assessed for both the lower and upper jaws. The analysis aimed to measure the reliability of the evaluators' measurements against each other and against a standard measurement.
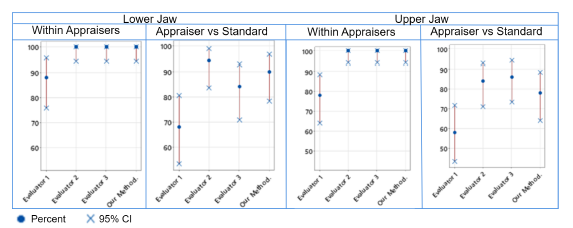
Figure 10: Comparison of intra- and inter-rater reliability in dental arch assessments for lower and upper jaws. The left panels display the within-evaluator agreement (i.e., Eva 1, Eva 2, Eva 3, Our Method) with the corresponding percentages and 95% CIs. The right panels show evaluator vs. standard agreement, including the percentage and the 95% CIs for both jaws.
Each evaluator vs. the standard. This portion assessed the agreement level for each evaluator, providing kappa statistics, standard errors, Z-scores, and p-values for each response and overall (Table III).
All evaluators vs. the standard. This portion summarized the collective agreement, offering kappa statistics for each response and overall, along with standard errors, Z-scores, and p-values, demonstrating the group's consistency with the standard (Table III).
3.2.2 Mathematical model fit and comparison summary
The mathematical models for predicting dental arch shapes were evaluated with a focus on polynomial and non-linear models. The comparison was based on the SSE and the RMSE, aiming to identify a model that accurately captured the complexity of dental arches while maintaining a balance to prevent overfitting (Table IV).
4 Discussion
This study's introduction of a four-phase methodology for analyzing dental arch shapes combines imaging techniques with mathematical modeling to enhance the precision of dental arch shape evaluations.
The initial phase automates the 3D to 2D conversion of dental models, simplifying the analysis by reducing spatial complexity. This step is crucial for standardizing the orientation of all dental models, ensuring consistent evaluation throughout the research. Our study revealed that manual adjustments were necessary for seven dental models (five from the lower jaw and two from the upper jaw) due to their initial horizontal orientation, which rendered the automatic alignment process ineffective. This limitation arose because the alignment algorithm, designed to process models within a vertical orientation range of -90 to 90°, as shown in Eq. (6), solely relies on the Y-axis for adjustments. Consequently, models that are not vertically aligned fall outside the algorithm's capability, necessitating manual correction.
The second phase, focusing on cusp detection, demonstrates the methodology's ability to extract detailed morphological features from the dental arches.
In the third phase of our analysis, the use of a sixth-degree polynomial (poly6) model with 21 reference points for dental arch shape modeling is thoroughly justified by an examination of model fitness data, as detailed in Table IV. This strategy achieves a harmonious balance between accuracy and model complexity. The high R2 values, nearing unity for all arch shapes (ovoid, square, and tapered), underscore the poly6 model's efficacy in capturing a significant portion of the variance in the data, thereby indicating an outstanding fit. Additionally, the model's relatively low SSE and RMSE underscore its precision in predictions with minimal average errors. The poly6 model's moderate complexity, indicated by a number of coefficients (#Coeff.= 7), is pivotal in preventing overfitting, thus ensuring that the model faithfully represents the dental arch shapes without undue influence from data noise. The high adjusted R2 values across various arch shapes further highlight the model's generalization ability, making the poly6 model the preferred choice for dental arch shape analysis within our study.
Table III: Attribute agreement analysis for the jaw
Each evaluator vs. the standard
Lower jaw
Upper jaw
Evaluator
Response
Kappa
SE kappa
Z
P(vs > 0)
evaluator
Response
Kappa
SE kappa
Z
P(vs > 0)
Evaluator 1
1
0.411189
0.100000
4.1119
0.0000
Evaluator 1
1
0.345875
0.100000
3.45875
0.0003
2
0.517622
0.100000
5.1762
0.0000
2
0.345023
0.100000
3.45023
0.0003
3
0.423794
0.100000
4.2379
0.0000
3
0.816850
0.100000
8.16850
0.0000
Overall
0.462560
0.087779
5.2696
0.0000
Overall
0.406666
0.082762
4.91368
0.0000
Evaluator 2
1
0.787385
0.100000
7.8738
0.0000
Evaluator 2
1
0.607843
0.100000
6.07843
0.0000
2
0.890351
0.100000
8.9035
0.0000
2
0.545159
0.100000
5.45159
0.0000
3
0.846390
0.100000
8.4639
0.0000
3
-0.041667
0.100000
-0.41667
0.6615
Overall
0.845600
0.080041
10.5646
0.0000
Overall
0.499687
0.084550
5.90993
0.0000
Evaluator 3
1
0.702381
0.100000
7.0238
0.0000
Evaluator 3
1
0.607843
0.100000
6.07843
0.0000
2
0.533800
0.100000
5.3380
0.0000
2
0.671053
0.100000
6.71053
0.0000
3
0.290780
0.100000
2.9078
0.0018
3
0.633700
0.100000
6.33700
0.0000
Overall
0.558499
0.081112
6.8856
0.0000
Overall
0.642675
0.077394
8.30398
0.0000
Our method
1
0.645641
0.100000
6.4564
0.0000
Our method
1
0.362155
0.100000
3.62155
0.0001
2
0.780702
0.100000
7.8070
0.0000
2
0.378882
0.100000
3.78882
0.0001
3
0.846390
0.100000
8.4639
0.0000
3
0.645390
0.100000
6.45390
0.0000
Overall
0.742666
0.080041
9.2785
0.0000
Overall
0.412707
0.081497
5.06406
0.0000
All evaluators vs. the standard
Response
Kappa
SE kappa
Z
P(vs > 0)
Response
Kappa
SE kappa
Z
P(vs > 0)
1
0.636649
0.0500000
12.7330
0.0000
1
0.480929
0.0500000
9.6186
0.0000
2
0.680619
0.0500000
13.6124
0.0000
2
0.485029
0.0500000
9.7006
0.0000
3
0.601839
0.0500000
12.0368
0.0000
3
0.513568
0.0500000
10.2714
0.0000
Overall
0.652331
0.0411533
15.8513
0.0000
Overall
0.490434
0.0407967
12.0214
0.0000
Table IV: Model fitness by shape
Shape
Model
R-square
SSE
DFE
Adj-R-sq
RMSE
#Coeff.
Ovoid
fourier4
0.99995
2.9067
9
0.99989
0.5683
10
Ovoid
poly6
0.99982
9.6444
12
0.99973
0.89649
7
Ovoid
poly4
0.99914
45.944
14
0.9989
1.8116
5
Ovoid
fourier2
0.99915
45.924
13
0.99882
1.8795
6
Square
fourier4
0.99998
1.1142
9
0.99996
0.35185
10
Square
poly6
0.99986
8.2757
12
0.99978
0.83045
7
Square
poly4
0.99832
98.527
14
0.99784
2.6529
5
Square
fourier2
0.9983
97.393
13
0.99764
2.7371
6
Tapered
fourier4
0.99998
0.99108
9
0.99997
0.33184
10
Tapered
fourier2
0.99978
12.823
13
0.9997
0.99315
6
Tapered
poly6
0.99976
14.168
12
0.99964
1.0866
7
Tapered
poly4
0.9995
29.509
14
0.99935
1.4518
5
The fourth phase of our work concentrated on improving the selection of dental arch shapes through an in-depth comparison of cusp images against sixth-order polynomial models. By employing error metrics such as the SSE and RMSE, this approach enables a comprehensive evaluation aimed at determining which model most faithfully reflects the true architecture of the dental arch.
Expert evaluators played a crucial role in the validation process by providing labeled data that served as a benchmark for comparing models. Their precise annotations established the gold standard against which the performance of the automated 3D dental arch shape prediction tool was measured.
The Gage R&R run charts (Figs. 6 and 7) for lower and upper jaw evaluations by the three experts illustrate the usefulness of majority voting in standardizing dental arch shape classification. Variations in the lower jaw consensus suggest a learning curve or interpretation issues among the evaluators, whereas the upper jaw shows more consistency, hinting at clearer classification or increased evaluator confidence. Weighted voting by experience lends authority to the consensus in cases of disagreement, enhancing the validity of the decision-making process. However, the observed variability, especially in the lower jaw, underscores the need for more definitive guidelines or training to ensure uniformity across evaluations, thus improving the reliability and effectiveness of orthodontic assessments.
The comparative analysis (Table II) between the lower and upper jaw evaluations highlighted a discernible difference in measurement consistency, with the upper jaw exhibiting a higher total variability (21.55%) compared to the lower jaw (12.90%). Notably, the reproducibility component accounted for the majority of this variability, indicating a need for improved evaluator agreement in upper jaw assessments. These results underscore the critical importance of considering anatomical differences between dental arches when developing and validating predictive models.
The attribute agreement analysis conducted in this study underscores a robust intra-rater and inter-rater reliability in the classification of dental arch shapes. The consistent findings within individual evaluators and between each of them and the majority vote standard suggest a high level of agreement (Fig. 10). This concordance points to the reliability of the evaluators and the assessment method, reinforcing the majority vote as a credible standard for dental arch shape classification. It also validates our method as a consistent and reliable approach when compared to expert opinions, which is instrumental for standardizing evaluations in orthodontic practice. In Table III, our method aligns well with expert evaluations in classifying jaw shapes, as evidenced by generally high kappa values. While Evaluator 2 and Evaluator 3 show the highest agreement with the majority vote for the lower and upper jaws, respectively, negative kappa values in certain cases highlight the need for standardized methods to minimize assessment variability and ensure accuracy.
5 Conclusion
Attribute agreement analysis. A robust intra- and inter-rater reliability in the classification of dental arch shapes was demonstrated. The consistency observed both within individual evaluators and between each evaluator and the majority vote standard suggests a high level of agreement, thus validating the proposed tool as a consistent and reliable approach for dental arch shape classification.
Comparative Gage R&R study. Discernible differences in measurement consistency between lower and upper jaw evaluations were highlighted, with the upper jaw exhibiting higher total variability. This underscores the need to improve the agreement between evaluators in upper jaw assessments, as well as the importance of considering anatomical differences between dental arches when developing predictive models.
Mathematical model selection and fit. Mathematical models for predicting dental arch shapes were evaluated with a focus on polynomial and nonlinear models. The sixth-degree polynomial model achieved a harmonious balance between accuracy and model complexity, highlighting its efficacy in capturing a significant portion of the variation in the data.
Clinical applicability. The tool developed in this study can have a significant impact on the field of dentistry by providing an automated tool for selecting dental arch shapes, which could improve treatment outcomes and our understanding of oral health.
References
6 Author contributions
License
Copyright (c) 2025 Juan David Tamayo Quintero, Juan Bernardo Gómez Mendoza, Sonia Victoria Guevara Pérez

This work is licensed under a Creative Commons Attribution-NonCommercial-ShareAlike 4.0 International License.
![]()
From the edition of the V23N3 of year 2018 forward, the Creative Commons License "Attribution-Non-Commercial - No Derivative Works " is changed to the following:
Attribution - Non-Commercial - Share the same: this license allows others to distribute, remix, retouch, and create from your work in a non-commercial way, as long as they give you credit and license their new creations under the same conditions.

2.jpg)