DOI:
https://doi.org/10.14483/23448393.17960Published:
2022-01-04Issue:
Vol. 26 No. 3 (2021): September - DecemberSection:
Electrical and Electronic EngineeringCaracterización de tráfico para el servicio de Video Streaming en vivo sobre DASH en redes 4G basado en analizadores sintácticos
Characterization of Traffic for Live Video Streaming Services on DASH in 4G Networks Based on Syntactic Analyzers
Keywords:
LTE, función de densidad de probabilidad, video streaming en vivo, modelo de tráfico (es).Keywords:
LTE, probability density function, live video streaming, traffic model (en).Downloads
References
“Ericsson Mobility Report June 2021 – Ericsson,” Ericsson, Jul. 14, 2021. https://www.ericsson.com/en/mobility-report/reports/june-2021 (accessed Oct. 23, 2021).
“3GPP TR 21.915 – Release description; Release 15,” iTecTec. https://itectec.com/archive/3gpp-specification-tr-21-915/ (accessed Dec. 15, 2020).
J. Heidemann, K. Obraczka, and J. Touch, “Modeling the performance of HTTP over several transport protocols,” IEEE/ACM Trans. Net. (TON), vol. 5, no. 5, pp. 616-630, Jan. 1997. https://doi.org/10.1109/90.649564 DOI: https://doi.org/10.1109/90.649564
Jbocharov, “Smooth Streaming Transport Protocol,” 2008. https://docs.microsoft.com/en-us/iis/media/smooth-streaming/smooth-streaming-transport-protocol (accessed Jun. 03,2020).
Apple, “HTTP Live Streaming (HLS) - Apple Developer,” 2014. https://developer.apple.com/streaming/ (accessed Jun. 03, 2018).
Adobe, “Adobe HTTP Dynamic Streaming (HDS) Technology Center | Adobe Developer Connection,” 2014. https://www.adobe.com/devnet/hds.html?origref=https%3A%2F%2Fwww.google.es%2F (accessed Jun. 03, 2020).
ISO/IEC, “MPEG Dynamic Adaptive Streaming over HTTP (MPEG-DASH),” 2010. https://mpeg.chiariglione.org/standards/mpeg-dash (accessed Jun. 03, 2018).
S. Fowler, J. Sarfraz, M. M. Abbas, E. Bergfeldt, and V. Angelakis, “Evaluation and prospects from a measurement campaign on real multimedia traffic in LTE vs. UMTS,” in 2014 4th Int. Conf. Wireless Comm., Vehic. Tech., Info.Theory Aerosp. & Elec. Sys. (VITAE), Aalborg, May 2014. https://doi.org/10.1109/VITAE.2014.6934475 DOI: https://doi.org/10.1109/VITAE.2014.6934475
P. Yin, A. Criminisi, J. Winn, and I. A. Essa, “Bilayer Segmentation of Webcam Videos Using Tree-Based Classi-
fiers,” IEEE Tran. Pat. Anal. Mach. Intell., vol. 33, no. 1, pp. 30-42, Jan. 2011. https://doi.org/10.1109/TPAMI.2010.65 DOI: https://doi.org/10.1109/TPAMI.2010.65
W. Y. Campo, H.-F. Bermúdez, and E. Astaiza, “Characterization of traffic of the video streaming service based on lexical analyzers,” Ingeniare. Rev. ch. ing., vol. 26, no. 3, pp. 448-458, Sep. 2018. https://doi.org/10.4067/S0718-33052018000300448 DOI: https://doi.org/10.4067/S0718-33052018000300448
W. Y. Campo, J. L. Arciniegas, R. García, and D. Melendi, “Análisis de Tráfico para un Servicio de Vídeo bajo Demanda sobre Recles HFC usando el Protocolo RTMP,” Info. tecnol., vol. 21, no. 6, pp. 37-48, 2010. https://doi.org/10.4067/S0718-07642010000600006 DOI: https://doi.org/10.4067/S0718-07642010000600006
E. V. Berrío and R. C. H. Reyes, “Asignación Equitativa De Capacidad Para Tráfico Unicast-Multicast En Redes IPTV Con Almacenamiento Distribuido De Contenidos,” Rev. Telec. Infor., vol. 1, no. 1, Jul. 2011. https://revistas.upb.edu.co/index.php/telecomunicaciones/article/view/1248
W. Y. Campo, “Modelo de Tráfico para Servicios Interactivos de una Comunidad Académica Virtual, con contenidos de Audio y Video de Alta Calidad,” Doctoral Thesis, Univ. del Cauca, Popayán, Colombia, 2014.
A. Reaz, D. Murayama, K. Suzuki, N. Yoshimoto, G. Kramer, and B. Mukherjee, “Synthetic traffic generation for streaming video to model IPTV,” in 2011 Fifth IEEE Int. Conf. Ad. Telecom. Sys. Net. (ANTS), Bangalore, India,Dec. 2011. https://doi.org/10.1109/ANTS.2011.6163638 DOI: https://doi.org/10.1109/ANTS.2011.6163638
B. Villanueva Ocampo, D. López Sarmiento, and E. Rivas Trujillo, “Métodos de modelamiento y predicción de tráfico orientados a plataformas de transmisión de video e IPTV usando series de tiempo,” Rev.cien., no. 16, pp. 10-21, 2012. http://revistas.udistrital.edu.co/ojs/index.php/revcie/article/view/4019/6026 DOI: https://doi.org/10.14483/23448350.4019
S. Tanwir and H. Perros, “Modeling live adaptive streaming over HTTP,” Comp. Comm., vol. 85, pp. 74-88, Jul.2016. https://doi.org/10.1016/j.comcom.2016.03.025 DOI: https://doi.org/10.1016/j.comcom.2016.03.025
“H.264 : Advanced video coding for generic audiovisual services. Serie H: Audio Audiovisual And Multimedia Systems; Infrastructure of audiovisual services – Coding of moving video.” https://www.itu.int/rec/T-REC-H.264-201003-S (accessed Mar. 18, 2020).
F. Abdurrahman et al., “Real Time Video Streaming over NS3 based Emulated LTE Networks,” International Journal of Electronics Communication and Computer Technology, vol. 4, no. 3, pp. 659-663, May 2014.
H.-F. Bermudez, R. Sanchez-Iborra, J. L. Arciniegas, W. Y. Campo, and M.- Cano, “Performance validation of NS3-LTE emulation for live video streaming under QoS parameters,” in 2017 IEEE 13th Int. Conf. Wireless Mob. Comp. Net. Comm. (WiMob), Rome, Italy, Oct. 2017. https://doi.org/10.1109/WiMOB.2017.8115836 DOI: https://doi.org/10.1109/WiMOB.2017.8115836
H.-F. Bermudez, R. Sanchez-Iborra, J. L. Arciniegas, W. Y. Campo, and M.-D. Cano, “Statistical validation of an LTE emulation tool using live video streaming over reliable transport protocols,” Telecomm. Sys., vol. 71, pp.491-504, 2019. https://doi.org/10.1007/s11235-018-0521-6 DOI: https://doi.org/10.1007/s11235-018-0521-6
ITU-T, “P.910: Subjective video quality assessment methods for multimedia applications,” Apr. 1999. https://www.itu.int/rec/T-REC-P.910-200804-I/en (accessed Apr. 12, 2020).
“Wireshark,” 2018. https://www.wireshark.org/ (accessed Mar. 05, 2020).
“Wowza,” 2018. https://www.wowza.com/products/streaming-engine (accessed Feb. 08,2020).
“The Apache HTTP Server Project.” http://httpd.apache.org/ABOUT_APACHE.html (accessedApr. 04, 2018).
“LENA,” 2019. http://networks.cttc.es/mobile-networks/software-tools/lena/ (accessed Jun. 27, 2020).
“H.264 : Advanced video coding for generic audiovisual services.” https://www.itu.int/rec/T-REC-H.264-201704-I/en (accessed Mar. 13, 2020).
International Standard ISO/IEC 13818-1, Information technology — Generic coding of moving pictures and as-sociated audio information: Systems, ISO, Dec. 01, 2000.
Y.-K. Wang, R. Even, T. Kristensen, and R. Jesup, “RFC 6184: RTP Payload Format for H.264 Video,” RFC Editor, 2011. https://www.rfc-editor.org/info/rfc6184 (accessed Mar. 18, 2019). DOI: https://doi.org/10.17487/rfc6184
P. J. Leach, T. Berners-Lee, J. C. Mogul, L. Masinter, R. T. Fielding, and J. Gettys, “Hypertext Transfer Protocol– HTTP/1.1.” https://tools.ietf.org/html/rfc2616#section-14.17 (accessed Mar. 18, 2020)
“Open Distribution Fitter app - MATLAB dfittool” Mathworks. https://es.mathworks.com/help/stats/dfittool.html (accessed Jun. 18, 2018).
“R: The R Project for Statistical Computing.” https://www.r-project.org/ (accessed Jun. 18, 2020)
A. M. L. Porras, Diseño estadístico de experimentos, análisis de la varianza y temas relacionados: tratamiento informático mediante SPSS, Granada, Spain: Proyecto sur, 2000.
“Kolmogorov-Smirnov Goodness-of-Fit Test.” https://www.itl.nist.gov/div898/handbook/eda/section3/eda35g.htm (accessed Mar. 22, 2020).
V. K. Rohatgi and A. K. M. E. Saleh, An Introduction to Probability and Statistics, Hoboken, NJ, USA: John Wiley & Sons, 2011.
How to Cite
APA
ACM
ACS
ABNT
Chicago
Harvard
IEEE
MLA
Turabian
Vancouver
Download Citation
Recibido: 7 de mayo de 2021; Revisión recibida: 19 de julio de 2021; Aceptado: 23 de julio de 2021
Abstract
Context:
Mobile data traffic generated by video services increases daily. To address this situation, telecommunication service providers must know the behavior of video traffic and thus adjust network resources to meet and maintain the quality levels required by users. Traffic characterization studies in 4G networks for Live Video Streaming (LVS) services are scarce, and those available are obtained from simulation scenarios in which the real operating conditions of these types of networks are not considered.
Method:
This work focuses on finding a model that characterizes traffic from the probability density functions of LVS services under the adaptive streaming DASH technique in LTE networks. The traces analyzed to carry out the modeling study were acquired in real emulation scenarios considering the operating conditions frequently presented in the actual provision of the service, for which five test scenarios were defined.
Results:
Based on the parameterization of a number of probability density functions found, a description of different traffic models of the service under study is presented, as well as for each of the pre-established test scenarios in a 4G-LTE network.
Conclusions:
From the results, it is concluded that the traffic model depends on the conditions of each scenario, and that there is no single model that describes the general behavior of LVS services under the adaptive streaming DASH technique in an emulated LTE network.
Keywords:
LTE, probability density function, live video streaming, traffic model..Resumen
Contexto:
El tráfico de datos móviles generado por los servicios de video aumenta a diario. Para enfrentar dicha situación, los proveedores de servicios de telecomunicaciones deben conocer el comportamiento del tráfico de video y así ajustar los recursos de la red que permitan satisfacer y mantener los niveles de calidad requeridos por los usuarios. Los estudios de caracterización de tráfico en redes 4G para el servicio Live Video Streaming (LVS) son escasos y los disponibles son obtenidos a partir de escenarios de simulación en los cuales no se consideran las condiciones reales de funcionamiento de este tipo de redes.
Método:
Este trabajo se centra en encontrar un modelado que caracterice el tráfico a partir de las funciones de densidad de probabilidad del servicio LVS bajo la técnica de streaming adaptativo DASH en redes LTE. Las trazas analizadas para realizar el estudio del modelado fueron adquiridas en escenarios reales de emulación considerando las condiciones de funcionamiento frecuentemente presentadas en la prestación real del servicio, para lo cual se definieron cinco escenarios de prueba.
Resultados:
Se presenta la descripción, a partir de la parametrización de algunas funciones de densidad de probabilidad encontradas, de diferentes modelos de tráfico del servicio bajo estudio y para cada uno de los escenarios de prueba preestablecidos en una red 4G-LTE.
Conclusiones:
A partir de los resultados, se concluye que el modelo de tráfico depende de las condiciones de cada escenario y que no existe un modelo único que describa el comportamiento general del servicio LVS bajo la técnica de streaming adaptativo DASH en una la red LTE emulada.
Palabras clave:
LTE, función de densidad de probabilidad, video streaming en vivo, modelo de tráfico..Introduction
The current growth of user subscriptions and video streaming services has generated an exponential increase in traffic in mobile cellphone networks. By late 2020, and according to [1], 8,1 billion users of mobile wireless networks were registered worldwide, with an expected growth of up to 8,9 billion by 2025. Out of this number of users, 50 % will use the LTE wireless access technology, 25 % will use access technologies proposed by 5G, and 25 % will use other technologies (WCDMA/HSPA, GSM/EDGE, etc.). The generated mobile data traffic is estimated at 164 Exabytes by 2025, of which 76 % corresponds to video services [1].
Currently, deployment has begun globally of the 5G network infrastructure. This migration has been defined by the 3GPP from 3GPP TR 21.915 V15.0.0 (2019-09) [2], which defines two possible configurations: independent and non-independent. The independent configuration uses only one radio access technology, whereas the non-independent configuration combines multiple ones. Due to the above, in the Latin American landscape, it is believed that the option to be adopted by the operators, given its economic benefits, capacity expansion, use of frequency bands, and introduction of the technology, is the non-independent configuration (option 3) [2], which uses core LTE (EPC), an evolved node B (eNB) that acts as master and a 5G base station (en-gNB) or NR, which acts as secondary node. The user station would have dual connectivity with the master and secondary nodes, as illustrated in Fig. 1.
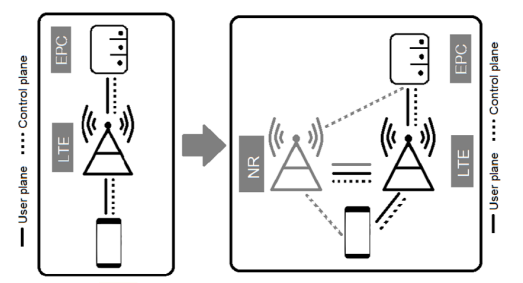
Figure 1: 3GPP non-independent architecture, option 3 (2)
Within this context, user traffic under this migration configuration continues to completely or partially circulate through the LTE access and always through the LTE core, which is why it is of vital importance to deploy the 5G network in developing countries and analyze the traffic behavior prevalent in the network, such as live video streaming (LVS) to keep the LTE core from becoming the bottleneck in the migration process, thus allowing to determine, together with user behaviors, the implementation times of new phases in the 5G start-up process.
The streaming technique used to support video services, specifically video on demand (VoD) and LVS, use the Hypertext Transfer (HTTP) protocol [3]. HTTP streaming is improved by using adaptive streaming techniques. The most popular of these include the HTTP Smooth Streaming (HSS) protocol [4], HTTP2 Live Streaming - HLS [5], HTTP Dynamic Streaming - HDS [6], and the Dynamic Adaptive Streaming protocol over HTTP (DASH), the latter being the international standard ISO/IEC 23009-1:2012 adopted for LTE networks [7].
Regarding the aforementioned, and due to the high level of video traffic in wireless networks, it is necessary for telecommunication operators to make decisions that guarantee minimum conditions in the quality of the services offered to users. Hence, in network and resource management and administration activities, it is of paramount importance to have tools such as traffic models that characterize the behavior of the networks. Although there are mathematical models and simulation environments that allow characterizing data traffic in wireless networks, these lack truthful information of the real conditions of the environment [8]. In response to this situation, there is currently great interest by the academic and scientific communities in the use and development of test platforms of communication systems that consider real operating conditions. Within this context, traffic models obtained from real operating environments have a high degree of acceptance, and they allow characterizing traffic behavior in the networks without affecting the operation of current systems. [9] presents different approaches to studying traffic modeling, which consider test benches, simulation, emulation environments, and mathematical models. Among these, emulation environments are a hybrid between simulation approaches and test bench that seeks to improve the disadvantages of one with the advantages of the other. Currently, this type of approach has a high degree of acceptance.
Within the context of the emulation scenario approach to conducting traffic characterization studies, in [10], the authors present the traffic characterization of a VoD service in an IPTV network and use a lexical analyzer designed for this activity to facilitate the study. In [11], the authors perform a traffic characterization for the VoD service on HFC networks using the RTMP protocol. In [12], the researchers study and characterize the VoD traffic for IPTV networks, propose an optimization problem, and present its solution through a sub-optimal model. The authors in [13] study, analyze, and model the traffic generated by the interactive services of a Virtual Academic Community (VAC), with high-quality audio and video content typical of the IPTV environment, where the main service is that of VoD supported on IPTV technology. In [14], the authors explore some aspects of the IPTV streaming modeling and present general studies involving generators of synthetic video traces. In addition, they conclude that it is important to study the IPTV parameters before implementing the service in order to evaluate architecture alternatives to configure the network that allows obtaining the best performance. [15] presents the techniques to model and predict video traffic statistically, which is highly useful in the development of this work, but it focuses only on modeling the data traffic with ARIMA time series, specifically with the SARIMA model. Furthermore, the authors argue that it is the most precise form to describe IPTV traffic. The previous works focus on characterizing traffic over IPTV networks. [16] presents an approach to an analytic traffic model of the HTTP adaptive video streaming service, which corresponds to the first model reported in the literature for this type of service. The analytic model proposed is comprised of three components: a video server model, a model for the IP network between the client and the server, and a client model for video playback. To obtain the analytic model, the simulation approach is used, where a model of nested queues is assumed in order to simulate the whole system. Moreover, it is assumed that the traffic of packages presents a binomial distribution. As an additional contribution, this work sought to find the traffic model from an emulation environment, which employs real elements and the consumption of the service in real time, where many of the assumptions given in the simulations are diminished.
According to the above, the characterization process of data traffic includes generation processes of the conceptual model of the service, traffic capture, audio identification, video frames that constitute the traffic under study, and the identification of the PDF that describes its behavior [13]. In this context, the video codecs use the image structure (frames) called Group of Pictures (GoP), which consists of a reference slice coded independently (slice I), followed by a sequence of slices P and B, in which there are only changes of movement with respect to the reference previously coded slice. In addition to these slices, there is the audio information [17]. Due to the degree of difficulty involved in capture, identification, filtering, and exportation activities of each of the slices that make up the video streaming services, which also allow characterizing traffic, it is necessary to use tools such as lexical or syntactic analyzers [10], which permit speeding up these types of processes.
This work sought to characterize LVS traffic in an emulated LTE network that uses the DASH adaptive streaming technique. The principal contributions of this work are the following: (i) designing a syntactic analyzer that facilitates the traffic characterization tasks of the service under study; (ii) providing network operators and the scientific community with a tool that describes the traffic of the LVS service in an LTE network and uses the DASH adaptive streaming technique, which can be used in activities involving the management and administration of networks and resources; and (iii) studying the behavior of the proposed traffic based on traces obtained from a real LTE network, without depending on assumptions or studies from other particular research scenarios.
This article is organized as follows: section 2 presents the methodology used in this research; section 3 shows the results and their discussion; and section 4 presents the conclusions.
Methodology
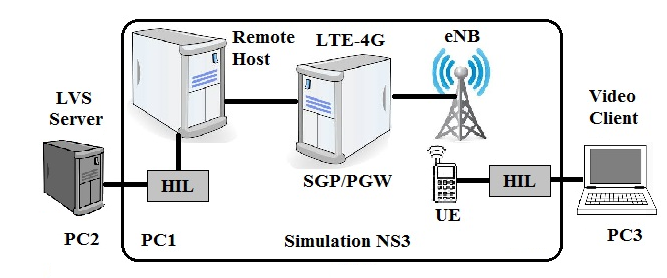
To conduct the study that allows characterizing the traffic from LVS services in an emulated LTE network, the DASH adaptive streaming technique is used, as well as the emulation scenario presented in Fig. 2, adapted from [18] and validated by the authors in [19], [20]. The emulation scenario is made up of a real video server, an LTE network constructed through the NS3 tool, and a client (User Equipment, UE). An overview of the equipment and software used in the test bench is shown in Table I. This scenario uses five test environments. In the first environment, a static UE is located at 30 m from the eNB; in the second, third, and fourth environments, the UE moves away from the evolved Node B (eNB) with rates of 1, 2, and 3 mps in a direction that follows a straight line y = x; and, in the fifth environment, the UE moves around the eNB with random direction and rate. For all the test environments, four video categories were selected for transmission: interview (category A), cartoons (categories B and D), football match (category C), and movie (category E), which are adjusted to the spatial-temporal characteristics defined in Annex I, from the ITUT 910 recommendation [21]. For each type of video, 10 tests are carried out, each lasting 180 s, which is consumed by a client. Upon reproducing the video, the traffic traces are extracted in the receptor (client). These traces are then captured with the Wireshark traffic analysis software [22]. Thereafter, to obtain the traffic mathematical model, it is necessary to extract the audio and video frames from the traffic traces, specifically the arrival times, image sizes, and types of slices. Next, through statistical analysis, the PDF that describes the behavior of each of the components of the service, which corresponds to the mathematical model, is identified.
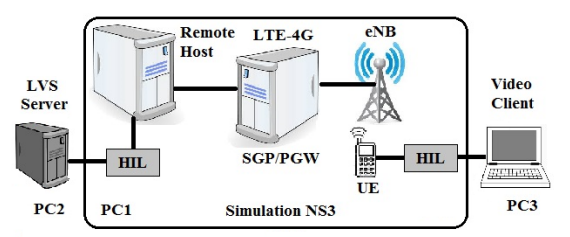
Figura 2: Emulated scenario
Table I: Characteristics of the PCs used in the emulation system
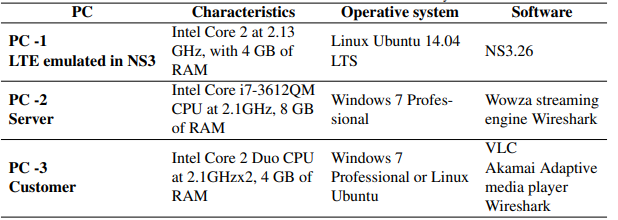
Fig. 3 shows the functional scheme used in the traffic characterization process. To speed up the process of extraction of parameters from the traffic traces, the proposed syntactic analyzer was used.
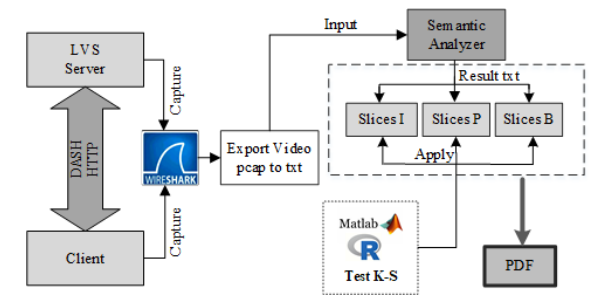
Figure 3: Functional scheme of the traffic characterization process
Emulation scenario
Fig. 2 presents a diagram of the implemented emulated scenario. PC1 is used to simulate the LTE network with NS3.26 on Linux Ubuntu. The other two PCs act as Client-Servers and connect to PC1 through the Ethernet. PC2 uses the Wowza Streaming Engine software [23] as a video server. The Wowza server is compatible with adaptive streaming technologies. For which it employs files from the Synchronized Multimedia Integration Language (SMIL), which allows using flows of various rates of bits in groups for transmission of bitrate-adaptive HTTP. PC3 implements a web-based video reproduction application developed with Apache HTTP [24]. In both PC2 and PC3, the openaccess traffic analysis software and Wireshark protocols were installed [22]. PC1 hosts the LTE network simulated with the LENA tool over NS3 [25]. The LTE network is composed of various nodes: a remote host node, a Serving Gateway/Packet Data Network Gateway (SGW/PGW), an eNB node, and a user equipment (UE) node that acquires the role of mobile device. Thus, real video traffic arrives at the UE node injected into the system through the real LVS server from the simulated LTE network. To allow communication between PC2-Host-Remote and UE-PC3, a Hardware in the Loop (HIL) tool is used, which allows using PC1 as a black box with virtual components. This black box receives and delivers data to the extreme real systems, PC2 and PC3 [18]. Tables II and III show the initial configuration parameters and adjustments for the emulation tool constructed in the test environment.
Table II: LTE network setup
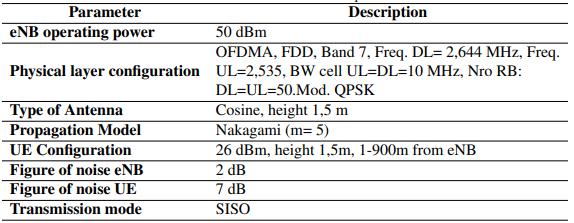
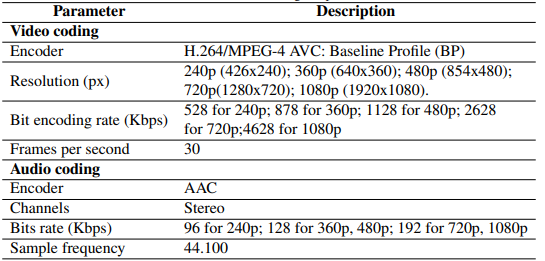
Table III: Coding setup
Live video service
To carry out this study, the Wowza Streaming Engine video server was used, which uses the H.264/MPEG-4 AVC as encoder; the LVS service in LTE networks uses the Baseline Profile (BP) [26]. In the process of encoding a video frame under the H.264 standard, it must be considered that it is divided into two main layers: a first layer called video coding layer (VCL), where the video coding process takes place (Fig. 4); and a second layer called network abstraction layer (NAL), which is in charge of adapting the information that the VCL delivers towards a diverse number of technologies for storage and transport of compressed contents. After the VCL, the video is organized into a ‘NAL Unit’, comprised of a heading, where the type of data from the NAL is indicated, and another bigger part of the unprocessed byte stream payload (RBSP). NAL units may be classified according to their information: possibly VCL NAL units, if these refer to data from the video slice; and non-VCL units, when these are only for control, which, in turn, could be a set that can be applied to various VCL NAL.
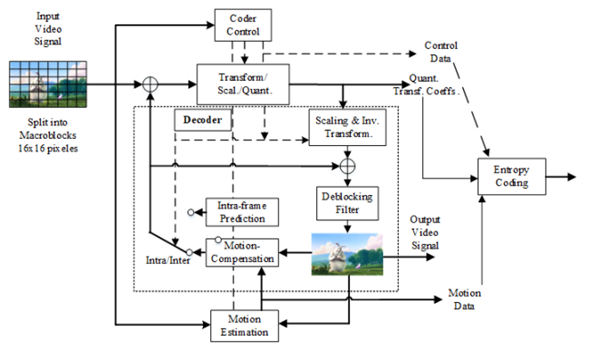
Figure 4: Scheme of the H.264 encoder
Syntactic analyzer
Due to the high volumes of traffic present in a live video service, among the activities requiring the greatest time and work for characterization is the identification of audio and video slices, specifically of the type of video slice (I, P, or B), arrival times, and size. These slices are delivered to the network in an interlaced manner, which makes the data identification and extraction process a complex task. The proposed syntactic analyzer speeds up these activities, automating the slice type identification process through a Matlab® script, automatically delivering the information required for later analysis. For an idea of the high volume of traffic manipulated by the LVS service, Fig. 5 shows, by means of a curve, the packages captured in 60 s for a particular test lasting 180 s. Audio (red) and video (blue) traffic is observed in the form of bars obtained with the Wireshark tool.
The information presented in this format from Fig. 5 allows visualizing the substantial differences between the video and audio throughputs. Additionally, at package level, it could be intuitively stated that the size of the audio shows a uniform behavior, which must be confirmed by obtaining the PDF for this type of slice. However, when the video is made up of the GOP (I, P, B), it needs a more granular analysis, that is, it is necessary to identify the video components and the PDF that represents its behavior. At this point, the proposed syntactic analyzer contrib- utes to automatically identifying, separating, and exporting information on the video and audio slices from the real traffic traces obtained from the experimental scenario.
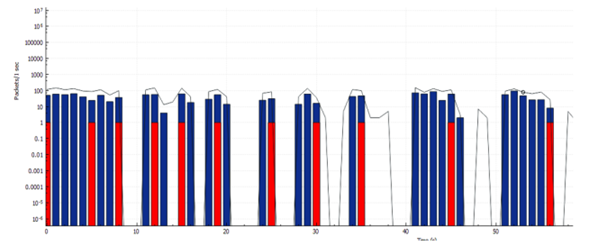
Figure 5: Total packages captured in a test with Wireshark
The tokens are the inputs of a syntactic analyzer, which, in this case, are the traffic traces acquired with Wireshark in plain text format. In the first place, the analyzer identifies, through the Word variable, if it is an audio or video slice; if it corresponds to an audio slice, the arrival time and size are identified. If, on the contrary, it is a video slice, the GOP type must also be identified. Fig. 6 shows the flow diagram of the proposed syntactic analyzer.
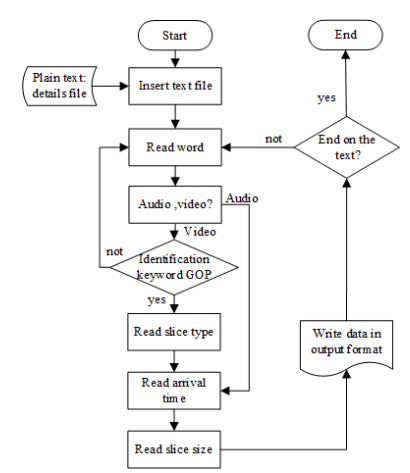
Figure 6: Flow diagram of the proposed syntactic analyzer
While identifying the type of GOP for the video slices, the GOP initiation key word is searched. In this case, and considering the international standard ISO/IEC 13818-1 [27] and what was presented by [28] and [29], this key is defined as ‘00 00 00 01’. When this identification sequence of the GOP is found, the two bytes located after this identifier are analyzed; of these two bytes, the last one, which is hexadecimally encoded, contains information on the type of slice. To extract information from this byte, the least significant bit must be selected from the first hexadecimal character, as well as the most significant bit from the second hexadecimal character. According to [17], the type of slice is coded in the following manner: 00 = P, 01= B, and 10 = I. Fig. 7 presents an example of this, where the Word variable defines that it is dealing with a video slice. Additionally, the slice arrival time and size are observed, in addition to identifying the reassembled TCP segments. After the word identifying the GOP, the following two bytes appear: 00 01. To identify the type of slice, the third and fourth hexadecimally coded characters coded are used: 01H (0000 0001). The bits that encode are highlighted in bold. In binary, the type of slice, for this case 00, corresponds to a type P slice.
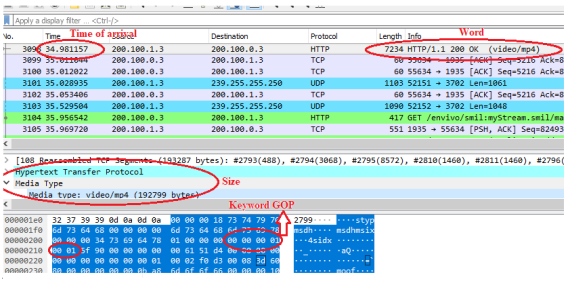
Figure 7: Screenshot of traffic trace with Wireshark
Finally, the output of the syntactic generator delivers the corresponding identification information of the slices (audio and video), type of slice (I, P, or B), arrival times, and size. With this information, and with help from the Matlab dfittool tools [30] and the R statistical analysis software [31], a subsequent statistical analysis is conducted by typing the probability density functions (PDFs) that describe the behavior under study.
From the results delivered by the syntactic analyzer, the R statistical analysis software is used for prior data analysis. For this task, the data provided by the syntactic analyzer are loaded and the box-whisker plot tool is used, which is a visual representation that describes the dispersion and symmetry of the data to be analyzed; the information is observed in a box-whisker plot (Fig. 8). Thus, i) the median is represented by the box line; ii) the interquartile range box distance between the first and third quartiles, Q3-Q1, represents 50 % intermediate of the data; and iii) the whiskers, which extend from any side of the box, represent the ranges of 25 % of the data values from the lower part and 25 % from the upper part, excluding the outlier values. The asymmetry of the diagram indicates that the data may not be distributed normally. Atypical data (extreme and mild) are eliminated, which, according to the Tukey test, are the extreme outliers, while the mild outlier values are kept for this analysis [32].
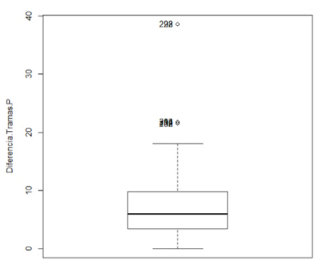
Figure 8: Box-whisker plot
Null hypothesis (Ho)
The null hypothesis (H0) is selected with dfittool, which is an application by Matlab capable of interactively adjusting the probability density distributions of data imported from Workspace and has 22 PDF available for analysis. With dfittool, it is possible to visualize the set of stored data through a histogram, which is overlaid by a PDF trying to fit it. The curve that best fits the histogram is the null hypothesis. This null hypothesis is validated through the Kolmogorov-Smirnov (K-S) goodness-of-fit test [33], for which a script was developed in Matlab, which allowed measuring the degree of correlation existing between the distribution of the set of practical data and the theoretical distribution (null hypothesis). With the dfittool tool, the evaluate function is used. This function allows creating vectors with the cumulative distribution function (CDF), size or arrival times of each set of plots, from which the goodness-of-fit test was performed, which takes this CDF and the set of samples from the traffic as input parameters. To calculate the contrast variable (Dα), with a 95 % confidence interval, Equation (1) is used, as well as for the K-S test with a 0,05 significance level and is applied for values above 50 samples.

where N is the number of samples.
Thereafter, the cumulative probability observed (CPO) of the samples of each slice is calculated, which corresponds with the CDF of the practical data. The cumulative probability expected (CPE) of the null hypothesis corresponds to the CDF generated with the evaluate function of difittool from theoretical data. The value of the estimator or contrast variable of the test (D) corresponds to the maximum value of the absolute difference from CPO and CPE. D is compared with the value of the contrast variable (Dα), and it is determined, by means of Equation (2), whether the null hypothesis is accepted or rejected.

The value of the D estimator from the K-S test, besides determining whether to accept or reject the hypothesis, is also used as a PDF selection criterion. The PDF parameters of the data analyzed are calculated by using maximum likelihood estimators (MLE) [34].
Results and discussion
On carrying out the traffic analysis, for a particular scenario, the response of the proposed analyzer provides organized information on the difference between arrival times, slice size for video, and audio types I and P. Subsequently, the histogram is generated from the dfittool, and the null hypothesis (Ho) is checked. Fig. 9 shows the histogram of the slices of the time difference of the P frames and the PDFs of the possible null hypotheses (H0) to be validated with the K-S goodnessof-fit test. Fig. 10 shows the CPO of the time difference slices and the CPE of the different null hypotheses to be validated.
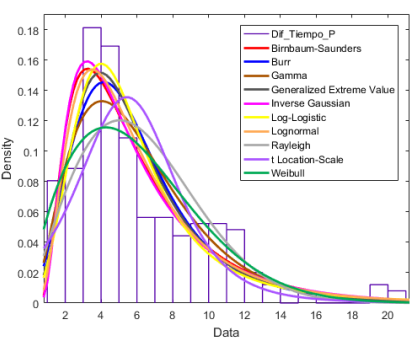
Figure 9: Histogram of time difference of P slices and the PDFs of the possible H0
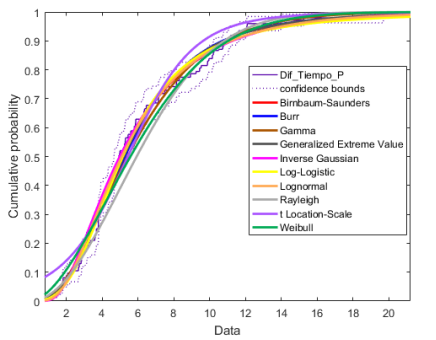
Figure 10: POA of slices of time difference and the probability expected cumulative (PEA) of the H0
Table IV shows the calculated values of the test statistic (D) and their comparison with the contrast value (D 0,05) for the possible null hypotheses shown in Fig. 9 and 10. By analyzing this information, it is obtained that only the null hypothesis, which states that the analyzed data fit an ‘Inverse Gaussian’ PDF is valid. The parameters for the PDF found are shown in Fig. 11, where the type of distribution, the mean, and the variance calculated with the maximum likelihood estimator are presented. Additionally, the parameters that define the distribution are shown along with their statistical error
Table IV: Results of the K-S test for different proposed null hypotheses
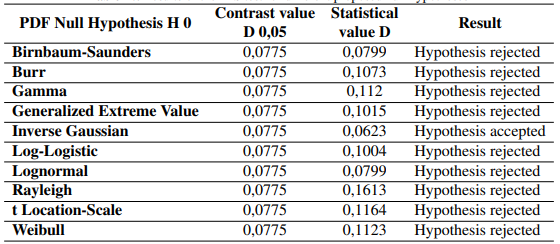
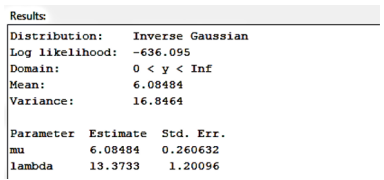
Figure 11: Parameters of the Inverse Gaussian distribution function obtained with dfittool
Tables V and VI present the results obtained from the PDF that describe the behavior of each type of frame, video, and audio for the size and relative time between slices of the four video categories (interview: category A; cartoons: categories B and D; football match: category C; and movie: category E) used in all the test environments already described in the methodology. Moreover, the D estimator is shown for the K-S test, and it is lower than the contrast variable (D0,05) for all cases, where D 0,05 shows values between 0,2104 and 0,163, which correspond to the amount of samples used. All scenarios used between 60 and 100 samples. Due to the profile of the encoder used, the Baseline Profile (BP) of the H.264/MPEG-4 AVC only detects type I and P video slices. Table VII shows the PDF used and the parameters that define it.
Table V: PDF for the slice size from different categories and test scenarios
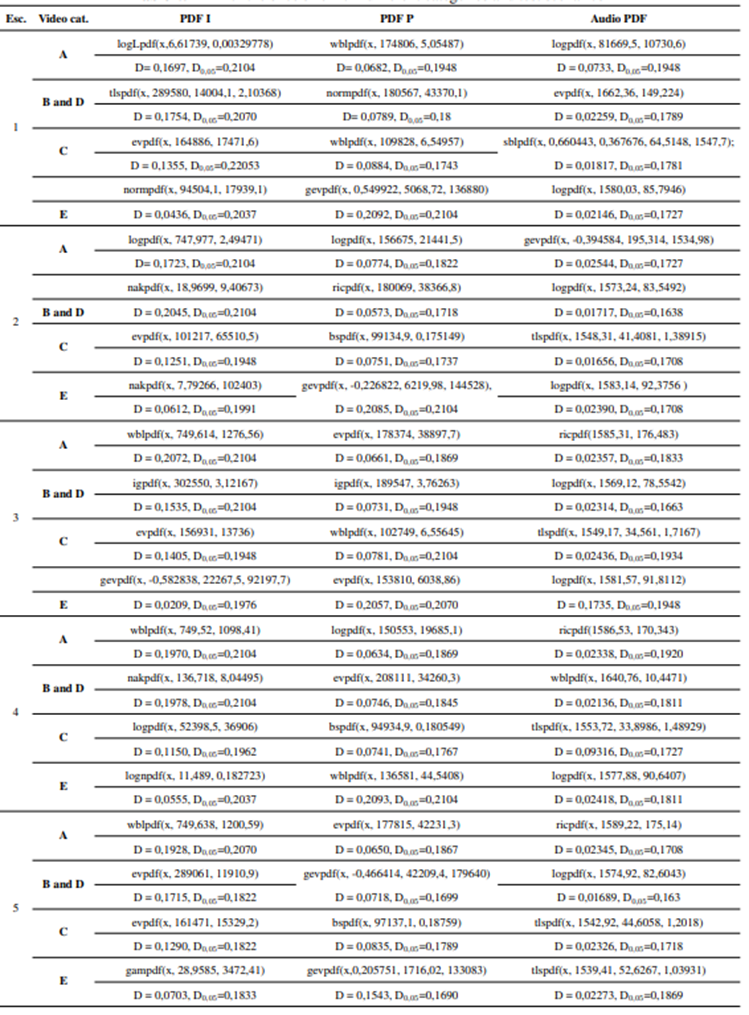
Table VI: PDF for the relative time between slices from different categories and test scenarios
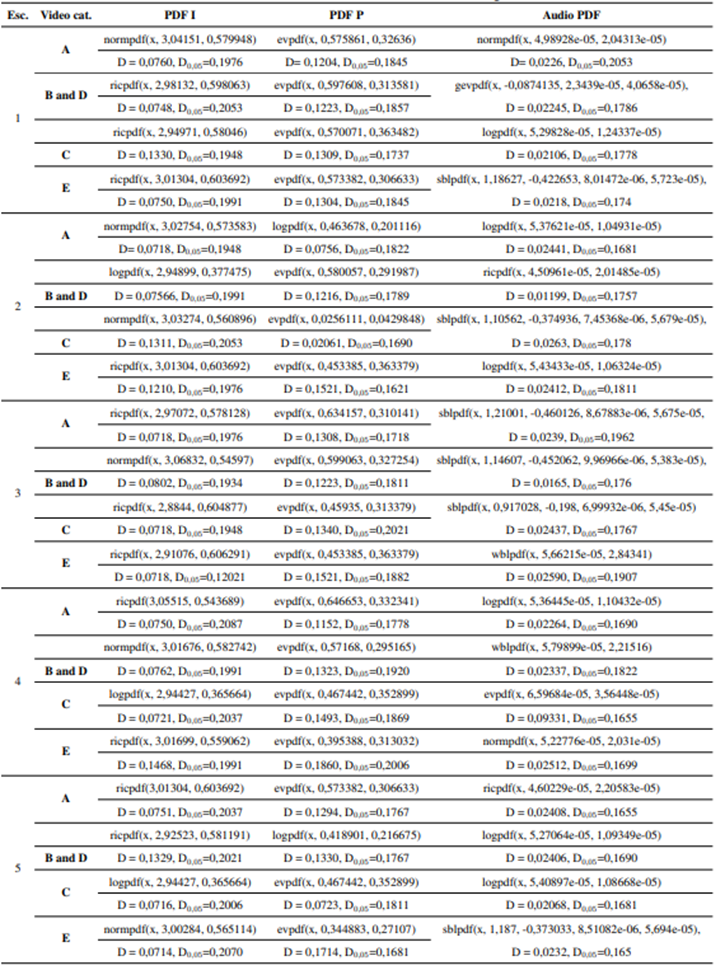
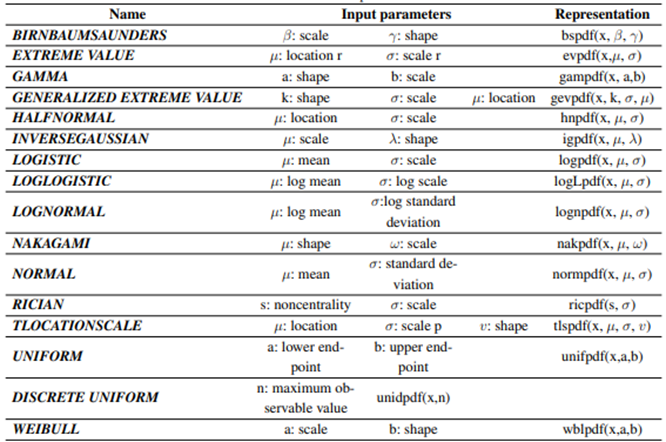
Table VII: PDF and parameters
The following explains a particular case, which is highlighted in Tables IV and V, where a UE reproduces a C category live video (football match), and the user moves away from the eNB at an average rate of 3 mps (7,2 km/h).
In accordance with the results shown for the sizes and arrival times of slices in Tables IV and V, the type of traffic characterized by this scenario can be modelled by the following PDF:
-
The sizes of type I slices are described through a PDF Extreme Value with µ = 156931 and σ = 13736. Through the K-S test, it is possible to obtain a D estimator = 0,1405, which is lower than the contrast variable (D0,05 = 0,1948), which corresponds to N = 70 samples (see Equation (1)).
-
The sizes of type P slices are described through a Weibull-type PDF α = 102749 and b = 6,555. Through the K-S test, it is possible to obtain a D estimator = 0,0781, which is lower than the contrast variable with a 0,05 significance level (D0,05 = 0,2104) for N = 60 samples.
-
The sizes of the audio slices are described through a tLocationScale-type PDF with α = 1549,17, σ =34,56, and v = 1,716. Through the K-S test, it is possible to obtain a D estimator = 0,0243, which is lower than the contrast variable with a 0,05 significance level 0,05 (D0,05 = 0,1934) for N = 71 samples.
-
The arrival times within type I slices are described through a Rician PDF with s = 2,884 and σ = 0,60487. Through the K-S test, it is possible to obtain a D estimator = 0,0718, which is lower than the contrast variable (D0,05 = 0,1948), which corresponds to N = 70 samples.
-
The arrival times within type P slices are described through an Extreme Value PDF with µ = 0,45935 and σ = 0,31337. Through the K-S test, it is possible to obtain a D estimator = 0,1340, which is lower than the contrast variable (D0,05 = 0,2021), which corresponds to N = 65 samples.
-
The arrival times within the audio slices are described through an Extreme Value PDF with µ = 0,45935 and σ = 0,31337. Through the K-S test, it is possible to obtain a D estimator = 0,1340, which is lower than the contrast variable (D0,05 = 0,1948), which corresponds to N = 85 samples.
It can be evidenced, for all scenarios presented in Tables V and VI, that the value of the D estimator from the K-S test is lower than the contrast variable (D0,05), which validates all the proposed hypotheses.
Conclusions
According to the results and for the conditions pre-established in the different experimental scenarios, in order to implement LVS services in an LTE network, the following observations can be made:
-
Statistical traffic modeling is presented for the audio and video components that constitute the LVS service of an emulated LTE network. The model is developed from real traffic traces.
-
It is observed that the traffic modeling of the LVS service shows a very particular description for each of the test scenarios defined. It can be stated that the model found depends on the conditions of each scenario and that there is no single model to describe the general traffic behavior of LVS services in emulated LTE networks. This represents a significant contribution since, for the design and planning of the networks by the operators, it is necessary to characterize the different operating environments in which the end users are normally found. The traffic models that must be taken into account in order to correctly dimension the network depend on this characterization.
-
From the traffic models found for each emulated scenario, it is possible to use the defined PDFs to generate traffic in simulation systems that lead to validating other parameters for this type of networks, such as the number of users, interference study, the performance of resource planners, power management, among others, since it is based on a validated model with a behavior that is statistically equivalent to a real system.
-
The studies presented in this work are a tool that will allow network designers and planners to have more inputs for a performance analysis focused on QoS parameters from which decisions can be made on resizing the resources assigned to current LTE networks. This ensures that end users of the service obtain a higher degree of satisfaction.
Acknowledgements
Acknowledgments
Very special thanks to the Research Group in Telematics Engineering (GIT) at Universidad Politécnica de Cartagena, Spain, where it was possible to implement the emulation scenario that serves as starting point to conduct this research.
References
License
Copyright (c) 2022 Héctor Fabio Bermúdez Orozco, Wilmar Yesid Campo Muñoz, Evelio Astaiza Hoyos

This work is licensed under a Creative Commons Attribution-NonCommercial-ShareAlike 4.0 International License.
![]()
From the edition of the V23N3 of year 2018 forward, the Creative Commons License "Attribution-Non-Commercial - No Derivative Works " is changed to the following:
Attribution - Non-Commercial - Share the same: this license allows others to distribute, remix, retouch, and create from your work in a non-commercial way, as long as they give you credit and license their new creations under the same conditions.

2.jpg)