DOI:
https://doi.org/10.14483/23448393.18145Publicado:
2022-11-20Número:
Vol. 28 Núm. 1 (2023): Enero-AbrilSección:
Ingeniería de SistemasSoftware Tool for the Extrinsic Calibration of Infrared and RGBD Cameras Applied to Thermographic Inspection
Herramienta software para la calibración extrínseca de cámaras infrarrojas y RGBD aplicada a inspección termográfica
Palabras clave:
thermographic inspection, extrinsic calibration, image fusion, thermal image, RGBD (en).Palabras clave:
Inspección termográfica, calibración extrínseca, fusión de imágenes, imagen térmica, RGBD (es).Descargas
Referencias
S. Zhao, Z. Fang, and S. Wen, “A real-time handheld 3D temperature field reconstruction system,” in 2017 IEEE 7th Annual Int. Conf. CYBER Tech. Auto. Cont. Int. Syst., 2017, pp. 289-294. https://doi.org/10.1109/CYBER.2017.8446193 DOI: https://doi.org/10.1109/CYBER.2017.8446193
X. Li, M. Ding, D. Wei, X. Wu, and Y. Cao, “Estimate depth information from monocular infrared images based on deep learning,” in 2020 IEEE Int. Conf. Prog. Info. Comp. (PIC), 2020, pp. 149-153. https://doi.org/10.1109/PIC50277.2020.9350792 DOI: https://doi.org/10.1109/PIC50277.2020.9350792
Z. Zhang, “A flexible new technique for camera calibration,” Pattern Anal. Mach. Intell. IEEE Trans., vol. 22, no. 11, pp. 1330-1334, 2000. https://doi.org/10.1109/34.888718 DOI: https://doi.org/10.1109/34.888718
J.-Y. Bouguet, “Camera calibration toolbox for Matlab,” California Institute of Technology, 2013. [Online]. Available: http://www.vision.caltech.edu/bouguetj/calib_doc/
J. T. Lussier and S. Thrun, “Automatic calibration of RGBD and thermal cameras,” in 2014 IEEE/RSJ Int. Conf. Intell. Rob. Syst-, 2014, pp. 451-458. https://doi.org/10.1109/IROS.2014.6942598 DOI: https://doi.org/10.1109/IROS.2014.6942598
S. Sels et al., “A CAD matching method for 3D thermography of complex objects,” Infrared Phys. Technol., vol. 99, pp. 152-157, Jun. 2019. https://doi.org/10.1016/j.infrared.2019.04.014 DOI: https://doi.org/10.1016/j.infrared.2019.04.014
P. Aksenov et al., “3D thermography for quantification of heat generation resulting from inflammation,” 2003. [Online]. Available: https://citeseerx.ist.psu.edu/viewdoc/download?doi=10.1.1.13.4874&rep=rep1&type=pdf
T. P. Truong, M. Yamaguchi, S. Mori, V. Nozick, and H. Saito, “Registration of RGB and thermal point clouds generated by structure from motion,” in 2017 IEEE Int. Conf. Comp. Vision Workshops (ICCVW), 2017, pp. 419-427. https://doi.org/10.1109/ICCVW.2017.57 DOI: https://doi.org/10.1109/ICCVW.2017.57
A. Chromy and O. Klima, “A 3D scan model and thermal image data fusion algorithms for 3D thermography in medicine,” J. Healthc. Eng., vol. 2017, pp. 1-9, 2017. https://doi.org/10.1155/2017/5134021 DOI: https://doi.org/10.1155/2017/5134021
D. Borrmann et al., “The project ThermalMapper – Thermal 3D mapping of indoor environments for saving energy,” IFAC Proc., vol. 45, no. 22, pp. 31-38, Jan. 2012. https://doi.org/10.3182/20120905-3-HR-2030.00045 DOI: https://doi.org/10.3182/20120905-3-HR-2030.00045
C. Wang, “Point clouds and thermal data fusion for automated gbXML-based building geometry model generation,” PhD dissertation, Sch. Civil Environ. ENg., Georgia I. Tech., Atlanta, GA, USA, 2014. [Online]. Available: http://hdl.handle.net/1853/54008
S. Vidas, P. Moghadam, and M. Bosse, “3D thermal mapping of building interiors using an RGB-D and thermal camera,” 2013 IEEE Int. Conf. Robot. Autom., pp. 2311-2318, May 2013. https://doi.org/10.1109/ICRA.2013.6630890 DOI: https://doi.org/10.1109/ICRA.2013.6630890
C. Yanpeng et al., “Depth and thermal sensor fusion to enhance 3D thermographic reconstruction,” Opt. Express, vol. 26, no. 7, pp. 8179-8193, 2018. https://doi.org/10.1364/OE.26.008179 DOI: https://doi.org/10.1364/OE.26.008179
P. Moghadam and S. Vidas, “HeatWave: the next generation of thermography devices,” in Proc. SPIE 9105, Thermosense: Thermal Infrared Applications XXXVI, 2014, p. 8. https://doi.org/10.1117/12.2053950 DOI: https://doi.org/10.1117/12.2053950
S. Karolj, L. TOMISLAV, S. Ivan, L. Jgenero, and G. Ivan, “4D thermal imaging system for medical applications,” Period. Biol., vol. 113, no. 4, pp. 407-416, 2011.
J. Rangel, M. Soldan, and A. Kroll, “3D thermal imaging: Fusion of thermography and depth cameras,” in 12th Int. Conf. Quant. Infrared Thermog., 2015, pp. 1-10. https://doi.org/10.21611/qirt.2014.035 DOI: https://doi.org/10.21611/qirt.2014.035
S. Vidas, P. Moghadam, and S. Sridharan, “Real-time mobile 3D temperature mapping,” IEEE Sens. J., vol. 15, no. 2, pp. 1145-1152, Feb. 2015. https://doi.org/10.1109/JSEN.2014.2360709 DOI: https://doi.org/10.1109/JSEN.2014.2360709
G. Chernov, V. Chernov, and M. Barboza Flores, “3D dynamic thermography system for biomedical applications,” in Application of Infrared to Biomedical Sciences, E. Ng and M. Etehadtavakol, eds., Singapore: Springer, 2017, pp. 517-545. https://doi.org/10.1007/978-981-10-3147-2_28 DOI: https://doi.org/10.1007/978-981-10-3147-2_28
Y. Shi, P. Payeur, M. Frize, and E. Bariciak, “Thermal and RGB-D imaging for necrotizing enterocolitis detection,” in 2020 IEEE Int. Symp. Medical Meas. App. (MeMeA), 2020, pp. 1-6. https://doi.org/10.1109/MeMeA49120.2020.9137344 DOI: https://doi.org/10.1109/MeMeA49120.2020.9137344
T. Zhang, L. Hu, L. Li, and D. Navarro-Alarcón, “Towards a multispectral RGB-IR-UV-D vision system – Seeing the invisible in 3D,” presented at 2021 IEEE Int. Conf. Robotics Biomimetics (ROBIO), Sanya, China, December 27-31, 2021. https://doi.org/10.1109/ROBIO54168.2021.9739218 DOI: https://doi.org/10.1109/ROBIO54168.2021.9739218
S. Schramm, P. Osterhold, R. Schmoll, and A. Kroll, “Combining modern 3D reconstruction and thermal imaging: generation of large-scale 3D thermograms in real-time,” Quant. Infrared Thermogr. J., pp. 1-17, Oct. 2021. https://doi.org/10.1080/17686733.2021.1991746 DOI: https://doi.org/10.1080/17686733.2021.1991746
J. D. Choi and M. Y. Kim, “A sensor fusion system with thermal infrared camera and LiDAR for autonomous vehicles and deep learning based object detection,” ICT Express, 2022. [Online]. Available: https://doi.org/10.1016/j.icte.2021.12.016 DOI: https://doi.org/10.1016/j.icte.2021.12.016
R. E. Ospina, S. D. Cardona, and B. Bacca-Cortés, “Software tool for thermographic inspection using multimodal fusing of thermal and visible images,” Ing. y Compet., vol. 19, no. 1, pp. 50-65, 2017. https://doi.org/10.25100/iyc.v19i1.2130 DOI: https://doi.org/10.25100/iyc.v19i1.2130
OpenCV, “OpenCV,” OpenCV Python, 2021. [Online]. Available: https://pypi.org/project/opencv-python/4.1.2.30/
C.-T. Hsieh, “An efficient development of 3D surface registration by Point Cloud Library (PCL),” in 2012 Int. Symp. Intel. Signal Proc. Comm. Syst., 2012, pp. 729-734. https://doi.org/10.1109/ISPACS.2012.6473587 DOI: https://doi.org/10.1109/ISPACS.2012.6473587
Kitware, “VTK – The Visualization Toolkit,” 2021. [Online]. Available: https://vtk.org/
P. Kruchten, The Rational Unified Process: An Introduction, 3rd ed., Boston, MA, USA: Addison-Wesley Professional, 2003.
A. Zisserman and R. Hartley, Multiple view geometry in computer vision, 2nd ed., Cambridge, UK: Cambridge University Press, 2004.
Cloudcompare.org, “CloudCompare,” 2021. [Online]. Available: https://www.danielgm.net/cc/
W. Nakagawa et al., “Visualization of temperature change using RGB-D camera and thermal camera,” L. Agapito, M. Bronstein, C. Rother, eds., Cham, Germany: Springer, 2015, pp. 386-400. https://doi.org/10.1007/978-3-319-16178-5_27 DOI: https://doi.org/10.1007/978-3-319-16178-5_27
Cómo citar
APA
ACM
ACS
ABNT
Chicago
Harvard
IEEE
MLA
Turabian
Vancouver
Descargar cita
Recibido: 19 de junio de 2021; Revisión recibida: 25 de abril de 2022; Aceptado: 10 de agosto de 2022
Abstract
Context:
Thermographic inspections are currently used to assess energy efficiency in electrical equipment and civil structures or to detect failures in cooling systems and electrical or electronic devices. However, thermal
images lack texture details, which does not allow for a precise identification of the geometry of the scene or the objects in it.
Method:
In this work, the development of the software tool called DepTherm is described. This tool allows performing intrinsic and extrinsic calibration between infrared and RGBD cameras in order to fuse thermal, RGB, and RGBD images, as well as to record thermal and depth data. Additional features include user management, a visualization GUI for all three types of images, database storage, and report generation.
Results:
In addition to the integration tests performed to validate the functionality of DepTherm, two quantitative tests were conducted in order to evaluate its accuracy. A maximum re-projection error of 1,47±0,64 pixels was found, and the maximum mean error in registering an 11 cm side cube was 4,15 mm.
Conclusions:
The features of the DepTherm software tool are focused on facilitating thermographic inspections by capturing 3D scene models with thermal data.
Keywords:
thermographic inspection, extrinsic calibration, image fusion, thermal image, RGBD..Resumen
Contexto:
Las inspecciones termográficas se utilizan en la actualidad para evaluar la eficiencia energética de equipos eléctricos y estructuras civiles o para detectar fallas en sistemas de enfriamiento y dispositivos eléctricos o electrónicos. Sin embargo, las imágenes térmicas carecen de detalles de textura, lo cual no permite identificar con precisión la geometría de la escena ni los objetos en ella.
Método:
En este trabajo se describe el desarrollo de la herramienta de software DepTherm, la cual permite realizar calibraciones intrínsecas y extrínsecas entre cámaras infrarrojas y RGBD para fusionar imágenes térmicas, RGB y RGBD, así como para registrar datos térmicos y de profundidad. Funcionalidades adicionales incluyen el manejo de usuarios, una GUI para visualización de los tres tipos de imágenes, el almacenamiento en una base de datos y la generación de reportes.
Resultados:
Además de las pruebas de integración para validar la funcionalidad de DepTherm, se realizaron dos pruebas cuantitativas para evaluar su precisión. Se encontró un error máximo de reproyección de 1,47±0,64 pixeles, mientras que el registro de un cubo con 11 cm de lado tuvo un error promedio máximo de 4,147 mm.
Conclusiones:
Las funcionalidades de la herramienta software DepTherm están enfocadas en facilitar las inspecciones termográficas capturando modelos 3D de las escenas con información térmica.
Agradecimientos: Este trabajo contó con financiamiento parcial del proyecto de investigación Sistemas multi-sensoriales de integración para clasificar fallas superficiales en el pavimento (ID No. 21034) de la Universidad del Valle, Cali, Colombia.
Palabras clave:
Inspección termográfica, calibración extrínseca, fusión de imágenes, imagen térmica, RGBD..Introduction
Thermographic inspections have a wide spectrum of applications, such as medical imaging, energy assessment, infrastructure inspection, nondestructive testing, failure detection in electrical and electronic devices, among others. An important reason for this is that current thermal cameras are affordable, their resolution has been improved, and makers have portable options suitable for many applications in the field. However, thermal imaging is limited to 2D analysis, thermal images have poor texture details, which are very important for human beings to identify and locate objects in scenes, and infrared images are shown in gray scale, which makes it very hard to process for humans.
On the other hand, 3D reconstruction of the environment can be performed using depth sensors (Kinect sensors, laser range finders, and Orbbec sensors) or/and visual sensors (monocular and stereo cameras). These kinds of sensors provide a cloud point of data with a resolution and uncertainty that depends on the distance to the main sensor, as well as RGB information which depends on the sensor used.
Thus, combining thermal imaging and depth sensors for 3D reconstruction of the environment with tem- perature information is an interesting option for thermographic inspections. To this end, this work pro- poses a software tool called DepTherm, which aims to extrinsically calibrate a Forward Looking InfraRed (FLIR) camera and a Kinect sensor in order to obtain a 3D temperature visualization of the scene. Incorpo- rating temperature information into 3D data models has various advantages, such as enabling a quantita- tive analysis of temperature distribution in 3D, emphasizing regions of interest by combining infrared, RGB, and depth information, and applying different methods to fuse multi-modal data.
This paper is organized as follows: section 2 presents related works; section 3 describes the extrinsic calibration method proposed; section 4 shows the development of DepTherm; section 5 comprises the results and discussion; and section 6 describes our conclusions.
Related works
The construction of 3D models of the environment with temperature information is an interesting research field. Table I shows a summary of the most representative works from 2003 to 2020. These works were compared considering the sensors, the calibration pattern, the intrinsic and extrinsic calibration methods, the temporal calibration method, the point cloud registration method, and the temperature assignment approach employed. These criteria are important parts of solving the 3D thermal representation of the environment.
Table I: Related works
Ref.
Sensors
Cal. Pat.
Int. Cal.
Ext. Cal.
T. Cal.
Regist.
Temp. A.
(7)
Infrared, stereo
Heated circles
Multires. Corr.
Multires. Corr.
No
ICP
Direct mapping
(8)
Infrared, PointGrey Flea3
Chess board w. conduct. Rubber
Zhang-based
No-linear opt.
No
SFM, COLMAP
Direct mapping
(6)
Infrared, Realsense
Aluminium Calib. Board
No
No
No
No
Direct mapping
(9)
Infrared, LRF 3D
PCB plate
Homog.
Homog.
No
No
Raytracing
(10)
Infrared, LRF 2D
Heated circles bulbs
Zhang-based
No-linear opt.
No
3DTLK
MCA
(11)
Infrared, LRF 3D
Chess board, square holes
Bouguet based
Bouguet based
No
No
Custom
(12)
Infrared, Kinect
Heated chess b.
Zhang-based
Mask-based
Cross corr.
Kinect fusion
Raycasting
(13)
Infrared, Kinect v2
Heated circles
Zhang-based
Mask-based
Motion St. Alig.
ICP
Thermal-ICP
(14)
Infrared, Asus Xtion
Heated holes
Mask-based
Line-based
Cross corr.
ICP
Raycasting
(15)
Infrared, Kinect
Chess board w. holes
Zhang-based
Zhang based
No
N/A
N/A
(16)
Infrared, Kinect
PCB chess board
Zhang-based
No-linear opt.
No
MTS
Direct mapping
(5)
Infrared, Kinect
Styrofoam board
No
No-linear opt.
Motion St. Alig.
No
Direct mapping
(17)
Infrared, Kinect
Heated chess b.
Zhang-based
Mask-based
Cross Corr.
ICP
Raycasting
(1)
Infrared, Asus Xtion
Scene based
Zhang-based
Visual tunning
Synchro-timer ROS
ICP
TSDF
(18)
Infrared, Creative Senz3D
Heated board w. circles
OpenCV
N/A
No
Least squares
Direct mapping
(19)
Infrared, Kinect v2
Heated chess board
GML Cal. Toolbox
GML Cal. Toolbox
No
No
Direct mapping
(2)
Infrared
Not needed
Not needed
Not needed
Not needed
Deep learning
Not needed
(20)
Infrared, UV, RGBD
Aluminum board with holes
Zhang-based
Closed transform
No
No
Direct mapping
(21)
Infrared, RGBD
Metallic chessboard
Zhang-based
Homography-based
No
ICP
Direct mapping
(22)
Infrared, 3D Lidar
Board with holes
Zhang-based
Homography-based
No
No
Direct mapping
Table I also shows different combinations of sensors to obtain a 3D thermal representation of the environment, e.g., infrared and stereo cameras, infrared cameras and laser range finder (LRF) sensors, infrared and depth cameras, and infrared cameras only. Fusing sensors data to obtain an improved representation of the environment implies an extrinsic calibration methodology. As a part of this methodology, the calibration pattern must be visible for these two sensors. As shown in Table I, different calibration patters have been used. In this kind of extrinsic calibration, it is important that the infrared and the other sensors detect the calibration patterns with high contrast. The infrared images obtained must show a high thermal contrast. Most calibration patterns consist of a chessboard with heated circles and a chessboard with square holes, the latter of which can be heated or not. Another popular and cheap option is using a chess-board built with PCB materials, which allows emissivity changes and a high thermal contrast. Another option of interest involves scene-based features 1, but it requires many clearly visible vertical and horizontal edges in the images, which might be not available in inspection sites. Moreover, in 2, deep learning is used to build a cloud of points using one infrared camera in motion, in such a way that no pattern is needed for extrinsic calibration.
Before performing the extrinsic calibration of two sensors, it is important to perform intrinsic calibration. Since most of the sensor combinations involve cameras (infrared and depth cameras), a popular method to obtain the intrinsic parameters is the Zhang method 3. On the other hand, the mask-based algorithm is inspired by 3, but it changes the calibration pattern to support infrared cameras and the non-linear optimization algorithm to the Monte Carlo Method approach. Another method for intrinsic calibration that has been included in many toolboxes and has inspired other calibration methods is the Bouguet method 4. Other works such as 5 and 6 assume that intrinsic calibration has already been performed.
Table I shows various methods for extrinsic calibration. When the experimental setups are close to a stereo configuration, mask, Bouguet, and Zhang-based methods are used to extrinsically calibrate the infrared and depth cameras. In 16 and 8, custom extrinsic calibration methods with non-linear optimizers (Maximum Likelihood Estimators, MCM, or Levenberg-Marquart) are implemented. Line-based 14 and homography-based 9,21,22 methods have the advantage of avoiding a calibration pattern and depending on scene features, and closed transformation methods use geometrical relationships extracted from intrinsic calibration 20.
LRF sensors and infrared and RGBD cameras have different sample times. Therefore, time synchronization is often implemented in a scene’s real video feedback. 5 and 13 use a motion statistics alignment, which uses optical flow vectors of near-infrared and RGBD images to compute an optimal time offset between cameras. Other works have performed temporal calibration to measure the worst acquisition time and setting it as the system sample time 12), (14), (17). In the case of 1, built-in ROS features were used to synchronize sensor data.
Once the sensors involved have been intrinsically, extrinsically, and temporally calibrated, many works perform data registration to obtain a 3D point cloud of the scene. The most popular registration method is ICP (Iterative Closest Points), which, in conjunction with SFM (Structure From Motion) methods, are common in Simultaneous and Localization and Mapping (SLAM) systems. Other methods observed in Table I are based on previous works (i.e., 3DTLK, Kinect Fusion, and MTS methods). Various works in Table 1 do not register data points, since they take one infrared image and one RGBD point cloud.
Assigning temperature data to the cloud points (registered or not) is the final process in order to fuse sensor data. Most works perform direct mapping, which consists of projecting the infrared image on the closest point in the cloud and assigning the temperature value. This is possible thanks to the extrinsic calibration performed earlier. Other works use ray-casting or ray-tracing algorithms extracted from the computer graphics community to increase the accuracy of 3D temperature visualization. Table I also shows other methods for temperature assignment such as surface smoothing, which combines temperature distribution over 3D surfaces as estimated from the cloud point. Furthermore, many works described in Table I use direct mapping and obtain good results.
In light of the above, important properties were considered to develop DepTherm. First, two calibration patterns were implemented: one to extrinsically calibrate the RGB and depth cameras, and another one for the RGB and thermal cameras. Second, the experimental setup in this work consists of a Kinect sensor (v1) and a FLIR E320 thermal camera. Third, in order to obtain the intrinsic calibration patterns, the Zhang-based method was used. Fourth, to extrinsically calibrate the RGB, depth, and thermal cameras, the homography-based method was implemented. Finally, the ICP registration method was used, as well as direct mapping as the temperature assignment method.
Extrinsic calibration between infrared and RGBD cameras
Extrinsically calibrating thermal and RGBD cameras require the following steps: first, defining and building the calibration patterns; second, obtaining the intrinsic calibration parameters of both cameras; and finally, using these results to perform extrinsic calibration. Figure 1 shows the experimental setup and the calibration patterns used in this work.
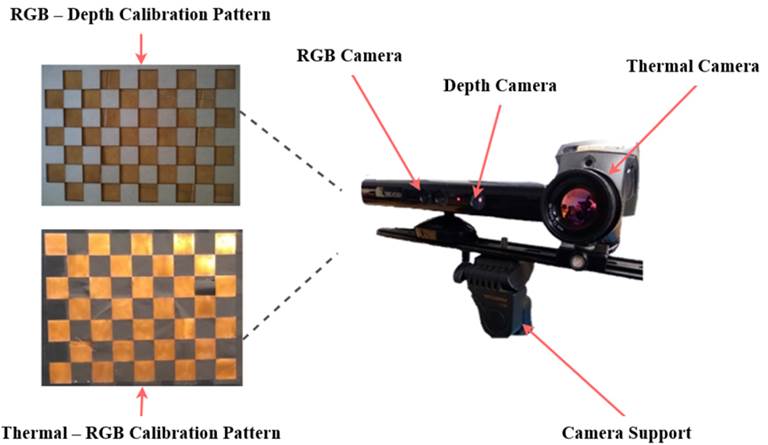
Figure 1: Experimental setup and calibration patterns
Fig. 1 shows the experimental setup with the RGBD (Kinect v1) sensor and the FLIR E320 thermal camera. The related works described in section 2 use active calibration patterns to extrinsically calibrate RGBD and thermal cameras. However, the authors report accuracy and operational issues when trying to use only one calibration pattern. Therefore, this work uses two calibration patterns. The upper calibration pattern shown in Fig. 1 is used to calibrate the RGB and depth cameras, and the bottom one is used to calibrate the thermal and RGB cameras.
The upper calibration pattern consists of a 0,7 x 0,5 m box that is 1 cm deep. It was built using MDF (Medium Density Fiber). On the front face of this box, square 6 x 6 cm holes were drilled. Then, the difference of depth was used to calibrate the depth camera, and the square corners were used to calibrate the RGB camera. The intrinsic and extrinsic parameters of both cameras can be computed using this calibration pattern. The bottom calibration pattern consists of a 0,945 x 0,765 m rectangle made of triplex. It has 8 x 8 cm cooper rectangles on its surface, which are combined with rectangles made with insulating tape. This combination of materials has led to very good calibration results of thermal and RGB cameras in previous works 23.
Before starting the extrinsic calibration, the intrinsic parameters must be computed. In this work, the Zhang approach 3 is employed individually for each camera while using the calibration patterns shown in Fig. 1. Then, as observed in Fig. 2a, it is important that, for each extrinsic calibration procedure described above, the calibration pattern is visible by the two cameras. This must be done at a distance of up to 2,5 m. The extrinsic calibration between the depth, RGB, and thermal cameras follows the pipeline shown in Fig. 2b. The main idea of the proposed extrinsic calibration proposed is to perform two geometric transformations in 2D: first, a transformation between the thermal and the RGB cameras; and second, a transformation between the RGB and depth cameras. Thus, the base coordinate reference will be the depth camera. Formally, Eqs. (1) and (2) show the projection functions for the RGB and thermal cameras, respectively.
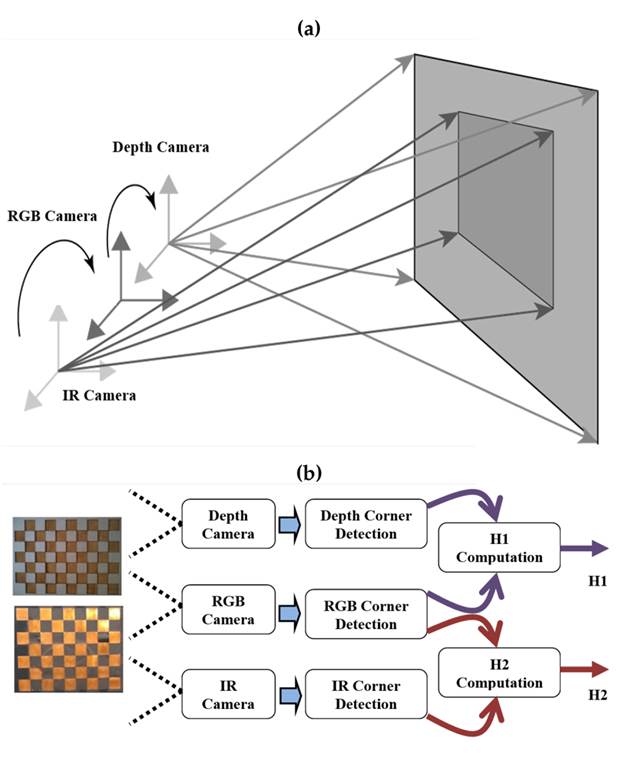
Figure 2: Calibration process: a) coordinated frames of depth, RGB, and IR cameras; b) extrinsic calibration proposal
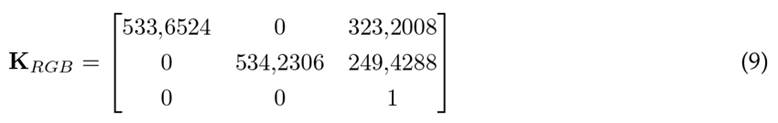
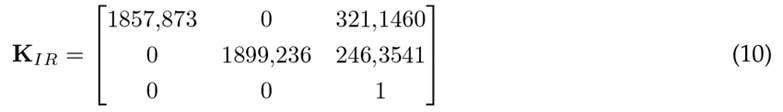
where xRGB and xIR are the image coordinates projected from a point in space Xs,KRGB and KIR are the projecting matrices for the RGB and thermal cameras, and RIR and tIR are the rotation matrix and translation vector that relates the RGB and thermal camera frames.
Then, by substituting Eq. (1) into (2), Eq. (3) is obtained.


where the homography matrixKIR[RIR tIR]K−1 RGB defines a projection function from RGB camera points to the thermal image. This relationship is bidirectional: the thermal camera points can be projected onto the RGB image using xRGB = H−1 2 xIR. In the same way, depth camera points can be projected onto the RGB image. This can be done by following a similar procedure as the one described above, which results in Eq. (4).

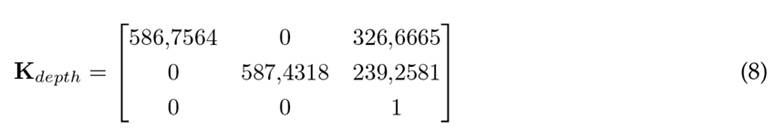
where Rdepth and tdepth are the rotation matrix and translation vector that relate the depth and RGB camera frames, Kdepth is the projecting matrix for the depth camera, xdepth represents the image coordinates in the depth camera, and Kdepth[Rdepth tdepth]K−1 RGB defines a projection function between the RGB and depth camera points. As before, this is a bidirectional function: RGB camera points can be projected on the depth image using xRGB = H−1 1 xdepth. Then, using H1 and H2, the image points in the thermal camera can be projected onto the RGB camera, and, in turn, they can be projected onto the depth camera and vice versa.
Using the thermal-RGB calibration pattern, common corner features can be detected, and H2 can be found. Moreover, using the RGB-depth calibration pattern, common corner features can be detected, and H1 can be robustly found. In this work, homography estimation was carried out using OpenCV tools 24.
Once the homography matrices have been estimated, thermal, RGB, and depth images can be combined, as image data from one camera can be projected onto another image plane. This is useful to project thermal data onto RGB or depth images. The resulting image of this projection between image planes is represented by Eq. (5).

where Inew is the resulting image; I1 and I2 are the first and second images to be combined, respectively; and α is the transparency factor.
Another important use of the estimated homography matrices is the temperature mapping of the depth data. First, the 3D point cloud is computed in two steps via Eqs. (6) and (7) .
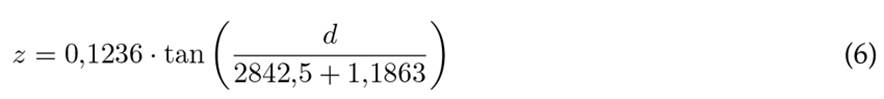
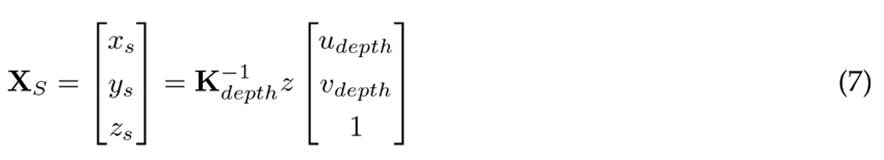
where d is the data by the Kinect sensor, Xs is the point in 3D, and
 are the image coordinates on the depth image plane. Then, by using Eq. (6), the z variable is found. Afterwards, the point in 3D is obtained using Eq. (7). By means of Eqs. (3) and (4) , thermal image data can be projected onto the depth image plane; since the coordinates of each in the depth plane are related to a 3D point in space, the temperature information obtained from the thermal camera can be assigned to each 3D point in space.
DepTherm can capture one 3D point cloud with temperature data or consecutively gather many 3D point clouds with temperature information to finally estimate a 3D model of the inspected object. The latter is achieved by recording the successive point clouds with temperature information. To this effect, DepTherm uses the ICP method implemented in 25, which was included in the VTK Toolkit 26.
Development of DepTherm
DepTherm was developed considering the analysis presented in the literature review, as well as using the RUP methodology 27 to document the software engineering process. The RUP methodology includes the following deliverables: functional and non-functional requirements, a conceptual diagram, real use cases, a sequence, and relational and class diagrams. However, real use cases and sequence diagrams are not included in this manuscript due to space limitations.
Design
DepTherm was developed while considering the following functional and non-functional requirements:
-
Functional requirements: to allow performing user management tasks; to allow users to enter the thermal inspection data; to allow users to configure the intrinsic, extrinsic, acquisition, image fusion, and data registration parameters; to allow users selecting a manual or automatic image acquisition; to allow users to perform and visualize the intrinsic calibration of each camera; to allow users to perform and visualize the extrinsic calibration of the camera set; to be able to use the homography matrices to map and visualize image points between thermal, RGB, and depth cameras; to allow users to record depth data and map the temperature; to store all information on the thermal inspection and the data collected in a database.
-
Non-functional requirements: DepTherm was developed in Python 3.7; DepTherm uses PySide2 5.13.1, VEDO 2020.4.0, numpy 1.16.4, libfreekinect, VTK 8.1.2, and OpenCV 4.1.2.30; DepTherm runs in the Ubuntu 18.04 operating system; DepTherm uses a Kinect sensor (v1) and a FLIR E320 thermal camera; DepTherm uses the PosgreSQL database
Considering the functional requirements described above, Fig. 3 shows the conceptual diagram of DepTherm. Here, two calibration patterns are used to capture common images between depth and RGB cameras, and thermal and RGB cameras. These images, as well as the inspection data, configuration parameters, intrinsic and extrinsic calibration parameters, and inspection images, are stored in an SQL-based database. In addition, multiple users can access the DepTherm application to perform different thermal inspections. Fig. 4a shows the database relational model used in DepTherm. In this model, basic user information is stored in the Users and User_type tables; the intrinsic and extrinsic calibration parameters and results are stored in the Calibration, ExtrinsicCalibration, and IntrinsicCalibration tables; thermographic inspection data are stored in the ThermographicInspection table; and the thermographic inspection report information and the generated report are stored in the Reports table.
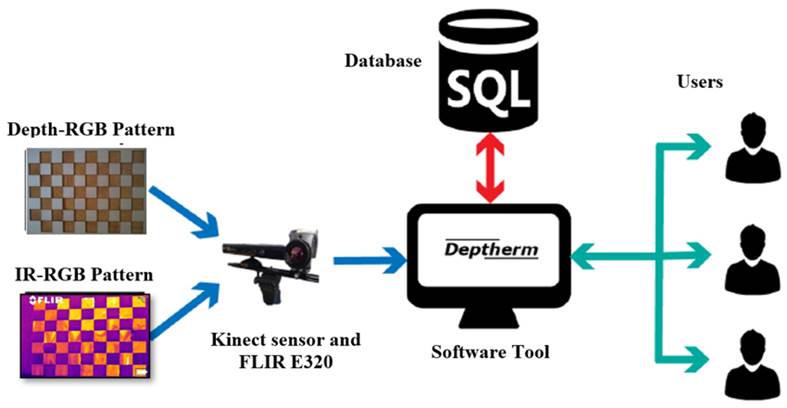
Figure 3: Conceptual diagram of DepTherm
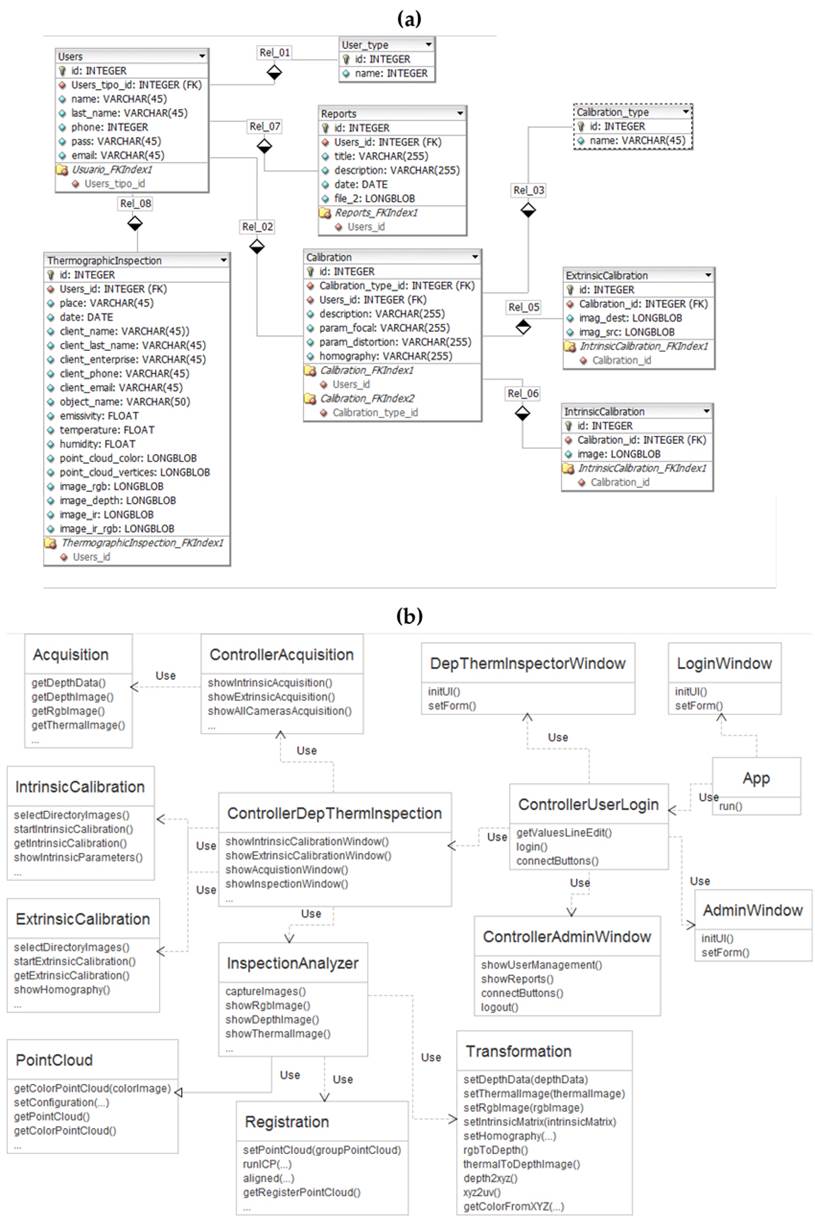
Figure 4: a) Database relational model; b) DepTherm class diagram
Fig. 4b shows the class diagram of DepTherm. The App, ControllerUserLogin, and ControllerDepthermInspection classes start up the software tool and the user interfaces. The first stage of DepTherm, image acquisition, is performed by the Acquisition and ControllerAcquistion classes. The second stage of DepTherm, which includes intrinsic and extrinsic calibration, is performed by the IntrinsicCalibration and ExtrinsicCalibration classes. The third stage, corresponding to the thermographic inspection, where the data of all cameras, the point cloud registration, and transformation between images take place, is performed by the InspectionAnalyzer, Registration, PointCloud and Transformation classes.
Implementation
DepTherm was implemented while considering four basic modules: image acquisition, intrinsic and extrinsic calibration, image fusion and registry, and report generation. At the very beginning, DepTherm presents a login GUI, asking the users for an email and password. If the user credentials are satisfactorily checked, DepTherm presents the GUI shown in Fig. 5. In the case of new users, DepTherm allows for new user registration. Fig. 5 shows a GUI with two main parts: first, a vertical bar on the left to access the image acquisition, intrinsic and extrinsic calibration, image fusion and registry, and report generation modules; and second, the image acquisition module is shown. This module allows users to acquire a set of images in order to perform the intrinsic and extrinsic calibration, as well as to acquire images of all three cameras at the same time.
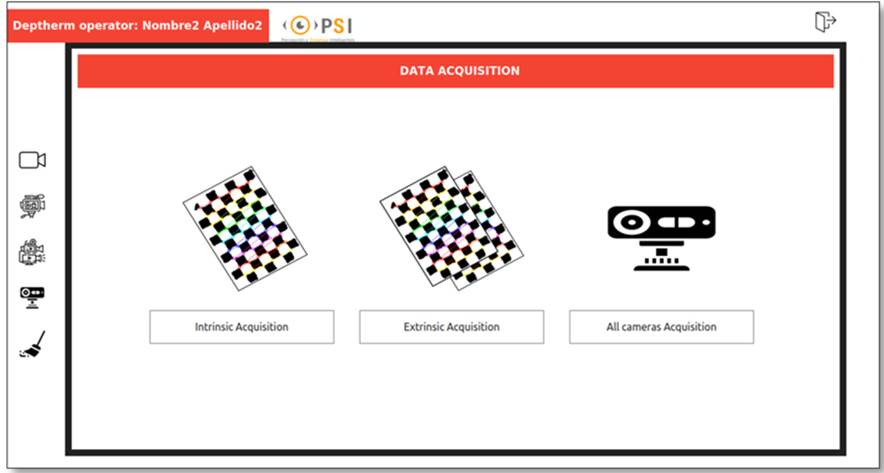
Figure 5: Image acquisition module of DepTherm
The first step to be carried out is intrinsic calibration. If it was previously done, users can move on to the next step (extrinsic calibration). Otherwise, image acquisition is performed to intrinsically calibrate the RGB, thermal, and depth cameras independently. The images acquired are pre-processed depending on the data source. For instance, RGB images are converted to gray scale, and a LOG filter is applied to correct the excess of reflected light on the cooper squares; the LOG filter is also applied to thermal images to enhance the contrast, which helps to better detect the square corners; and the depth images are filtered using a bilateral filter to preserve the edges and reduce noise in order to smooth the images.
Fig. 6a shows the DepTherm GUI for intrinsically calibrating the RGB, thermal, or depth cameras. The bottom part of this figure shows tools to perform the following tasks: defining the calibration pattern dimensions, defining the source folder from which to obtain the calibration images, performing the intrinsic calibration, repeating the calibration process, exporting the calibration parameters, and saving the calibration parameters in the database. The right part of Fig. 6a shows the intrinsic calibration parameters, and the center part shows the calibration images, where users can navigate forward and backwards.
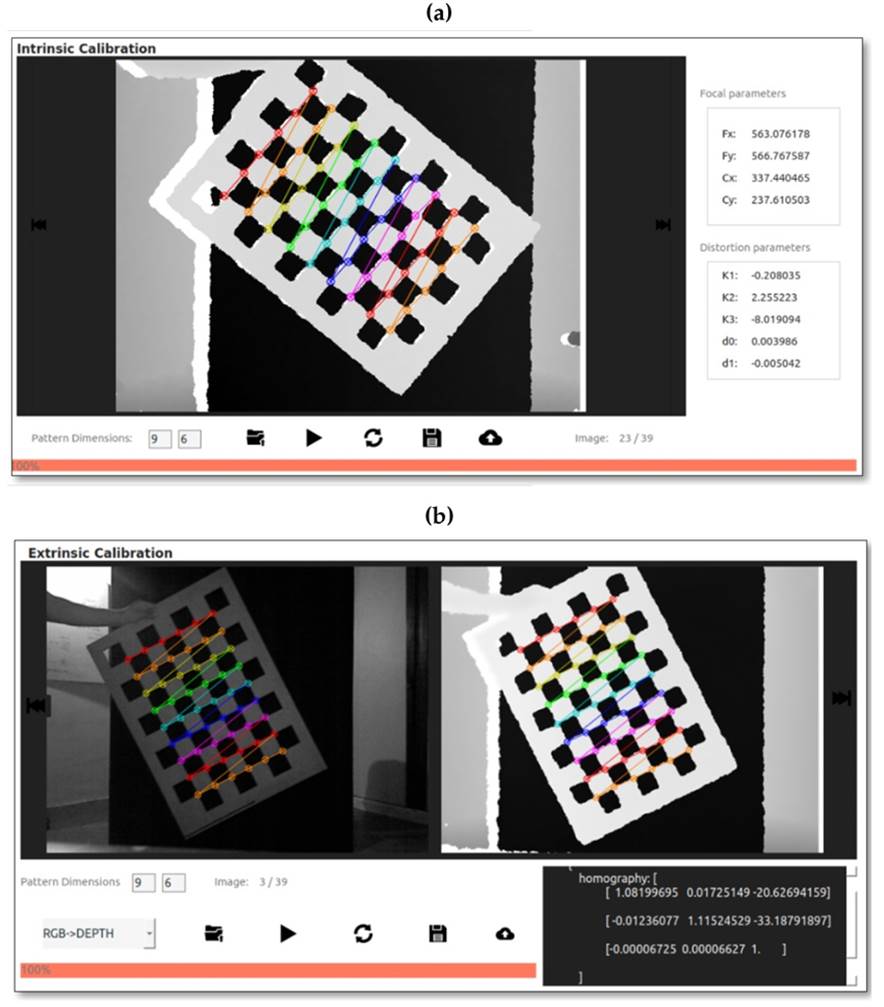
Figure 6: Calibration modules: a) intrinsic calibration, b) extrinsic calibration
Once the cameras have been intrinsically calibrated, the next step is extrinsic calibration. As explained in section 3, this calibration is performed in pairs. The first pair to calibrate extrinsically is the RGB and thermal cameras using Eq. (3). The second pair corresponds to the RGB and depth cameras using Eq. (4). Fig. 6b shows the DepTherm GUI to perform these calibration processes. The bottom part of this GUI has tools to carry out the following tasks: defining the pattern dimension, selecting the camera pair, defining the source folder from which to obtain the calibration images, performing the extrinsic calibration, repeating the calibration process, exporting the calibration parameters, and saving the calibration parameters in the database. The top part of Fig. 6b shows the images corresponding to each camera; also, at the bottom-right part of this figure, the resulting homography matrix is shown. This homography computation requires common features between two different images. For instance, Fig. 6b shows the calibration process for the RGB and depth cameras, and the common features correspond to corners on the calibration pattern. These features are automatically detected by DepTherm.
After extrinsically calibrating the cameras, thermography inspection activities may begin. In this stage, the following general procedure is implemented: first, all n images are captured; second, the depth images are transformed to 3D points; third, consecutive 3D cloud points are aligned (registered), and color information is added to the 3D model; fourth, filters are applied; fifth, 3D visualization is performed, and all data generated is stored in the database. Fig. 7 shows the DepTherm GUI to implement this procedure using different graphical tools:
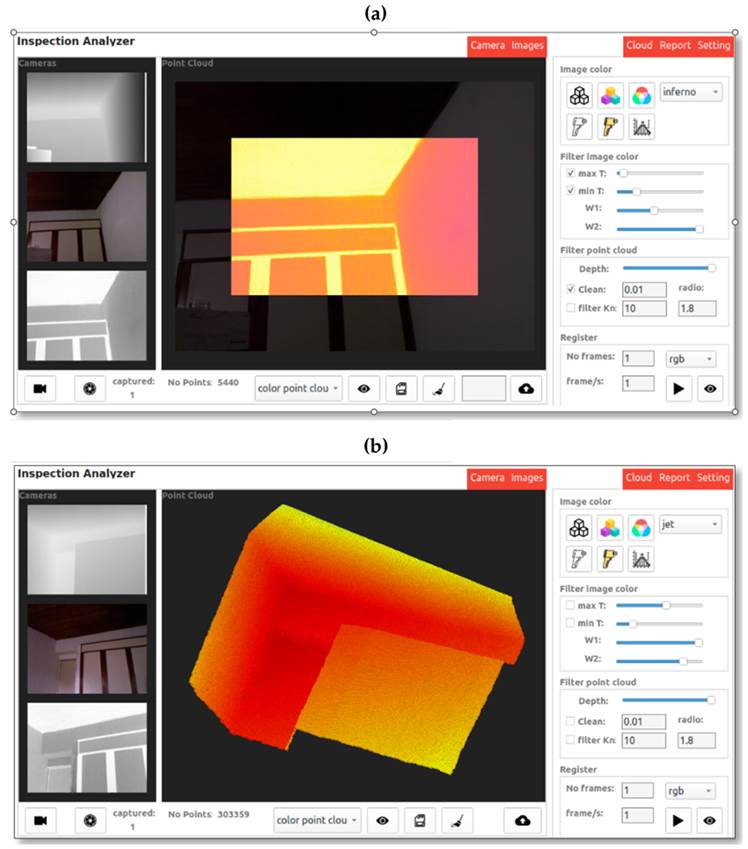
Figure 7: a) RGB and thermal camera fusion; b) point cloud with temperature information
-
The left part of Fig. 7a shows the images acquired from the three cameras
-
The icon bar in the bottom allows users to connect with the cameras, acquire the images, select the mapping operation, generate the cloud point from depth images, store data locally, restart the whole process, and store the data in the database
-
The Image color panel allows users to change the color properties of the RGB, thermal, and depth images, as well as to combine them (i.e., depth-RGB and RGB-thermal). Additionally, different color palettes can be selected
-
The Filter image color panel mainly performs two tasks: first, in the case of thermal and RGB-thermal images, the Max T and Min T controllers allow defining the amount of temperature information mapped in the resulting image; and second, for RGB-depth and RGB-thermal images, the W1 and W2 controllers allow changing the transparency.
-
The Filter point cloud panel allows users to apply filters in order to change the distance of interest in the cloud point data, reducing repeated points as well as noise
-
The Register panel allows users to register or align a fixed number of point clouds, define the sample time for the image acquisition, select the color palette, control the data acquisition start, and visualize the resulting cloud point
Fig. 7a shows the case where thermal image is projected onto the RGB image. In this case, one image from each camera has been used, as well as the corresponding homography matrix computed in the extrinsic calibration stage. Fig. 7b shows the case where many depth and thermal images have been captured and registered to generate a 3D point cloud with temperature information.
Finally, once the thermographic inspection is complete and users are satisfied with the results, they can generate a report. This report includes data such as the location of the inspection, weather data, the name of the person who performed the inspection, the camera calibration information (intrinsic and extrinsic), the images captured, the fused images computed, the emissivity, the room temperature of the data acquisition, a description, and the conclusions of the inspection process. Fig. 8 shows a short example of this report, which normally contains more than one page and is generated as a PDF file.
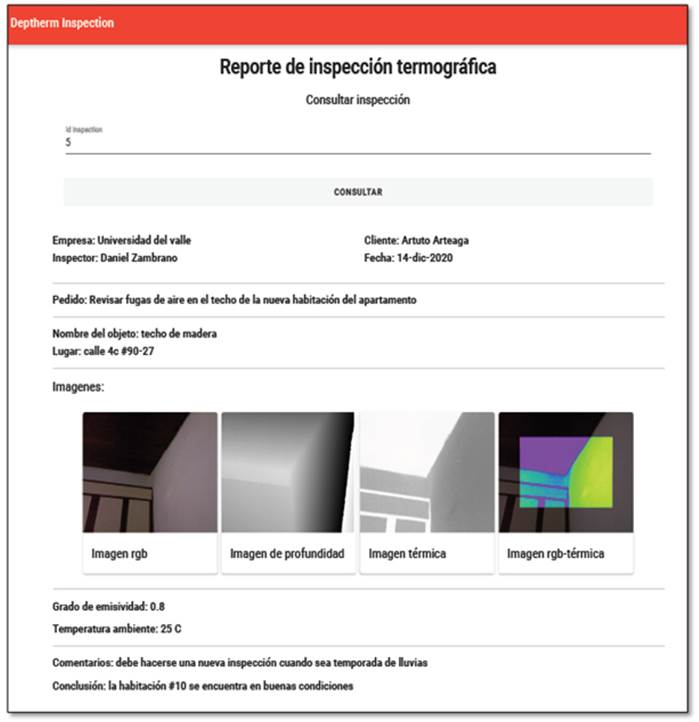
Figure 8: Thermographic inspection report generated by DepTherm
Results and discussion
DepTherm was validated by means of two quantitative tests: first, using the computed homography matrices the reprojections errors were calculated; and second, using a known geometric shape, the 3D model was computed, and the mean square error of this reconstruction was obtained. In addition, other qualitative tests were conducted in order to show how DepTherm fuses RGB, thermal, and depth images.
The quantitative tests were designed considering the following aspects:
-
The estimation of the homography matrix has eight degrees of freedom 28, which means that, in order to initially get a robust estimation of the homography matrix, at least four corresponding points are required (eight independent equations considering x and y coordinates) which are observable in two views.
-
Considering the calibration patterns in Fig. 1, the non-linear estimation of the homography matrices that relates the RGB/depth and the thermal/RGB cameras have at least 108 different XY points per image pair. This number of points is enough to satisfy the minimal condition described in 28.
-
The extrinsic calibration procedure captures a minimum of 10 image pairs in different positions with respect to the camera pair and different orientations. It is worth noting that these images must be at a distance of up to 2,5 m
Using the experimental setup shown in Fig. 1, the intrinsic parameters were estimated. Eqs. (8) , (9 ), and (10 ) show the projection matrices estimated using DepTherm for the depth, RGB, and thermal cameras, respectively.
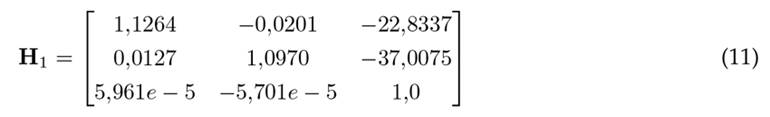
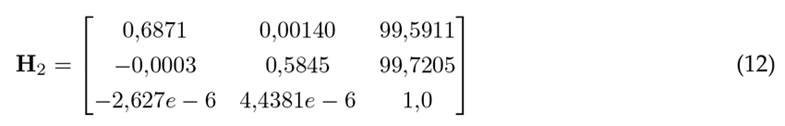
Then, extrinsic calibration can be performed in DepTherm using Eqs. (3) and (4) . The result of this calibration is expressed by Eqs. (11) and (12) . Eq. (11) is the homography matrix that relates the RGB and depth cameras, and Eq. (12) is the homography matrix that relates the thermal and RGB cameras.
To validate the accuracy of H1 and H2, it is common to compute the reprojection errors 28 as depicted in Eq. (13) .
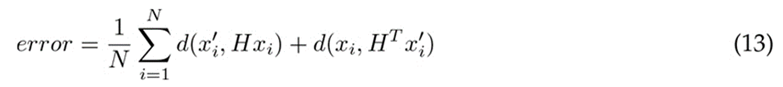
where N is the total of corresponding points; d(.) defines the Euclidean distance between two points, namely the destination point (x′i) and the source point (xi); and H corresponds to any of the two homography matrices (H1 or H2). Fig. 9 shows the reprojection errors when projecting data between
RGB and depth images (Fig. 9a), and when projecting data between thermal and depth images (Fig. 9b). The mean square error of Fig. 9a is 1,47±0,64 pixels, and the mean square error of Fig. 9b is 0,96±0,37 pixels. Then, it can be observed that the average reprojection errors are less than two pixels in the worst case. These results show the stability of the extrinsic calibration procedure.
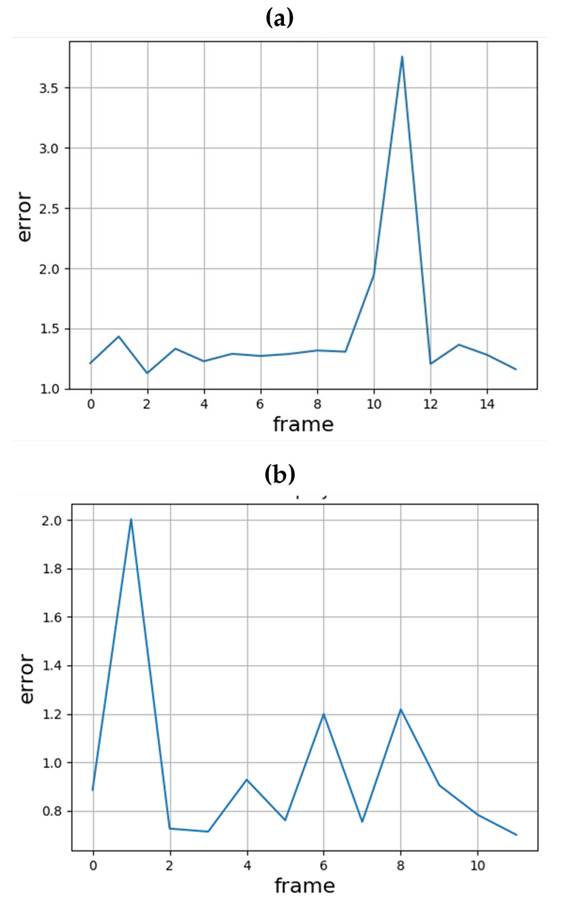
Figure 9: Reprojection errors: a) RGB to depth; b) thermal to depth
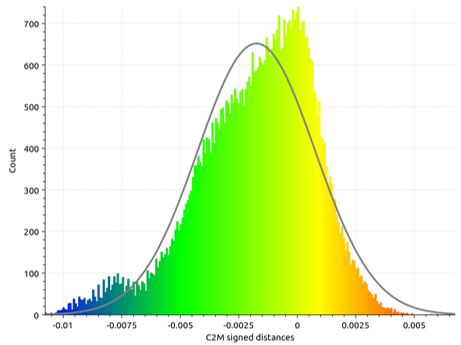
DepTherm was developed to compute the 3D model of the scene using an ICP-based registration process. To validate this functionality, a known geometric shape was used, i.e., 11 cm side cube. The camera set was moved around the cube at a distance of up to 1,5 m, the images were captured using DepTherm, and depth/thermal images were registered in order to obtain a 3D model (Fig. 10b). Then, using the CloudCompare free software tool 29, the ground truth model (11 cm side cube) and the point cloud captured by DepTherm were compared. The error distribution of this comparison is shown in Fig. 10a. As a result, the mean reconstruction error was 1,75±2,40 mm. For the worst case, the reconstruction error of DepTherm in this test was up to 4,15 mm.
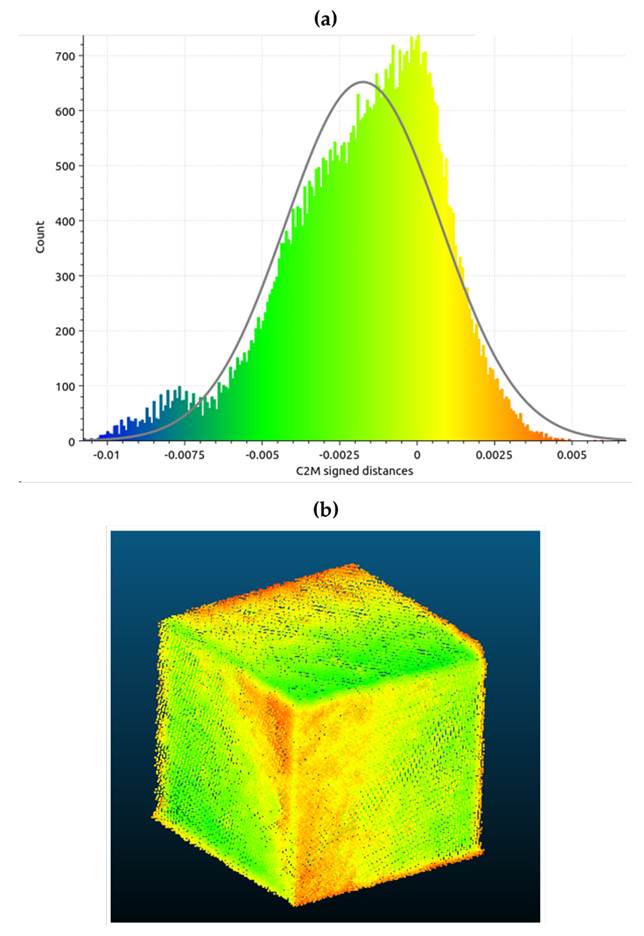
Figure 10: a) Error distribution of registering a 11 cm side cube; b) 3D image of the registered cube
The last two quantitative tests ensure that DepTherm is reliable enough to represent a scene in 3D with temperature information. An important tool for performing a thermographic inspection is the combination of RGB and thermal information in order to enhance the visual perception of a scene. Fig. 11 shows how DepTherm combines an RGB image (Fig. 11a) and a thermal image (Fig. 11b), as well as how it generates an RGB with thermal information (Fig. 11c). It is worth noting that thermal images have less resolution than RGB ones, which is why, when the thermal image (Fig. 11b) with a VIDRIS palette is mapped onto the RGB image, it covers part of the RGB image. The thermal image is mapped onto the RGB image following Eq. (3) and visually combined using Eq. (5). These equations are depicted in section 3. The transparency factor in Eq. (5) is configured by the user via the DepTherm GUI.
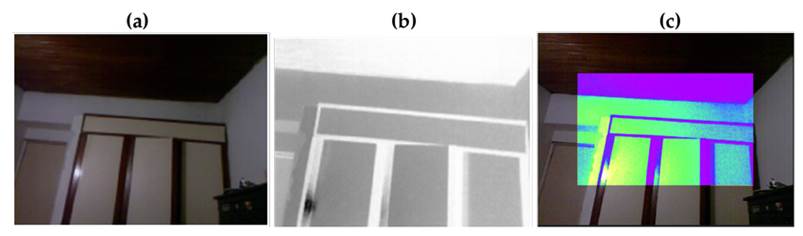
Figure 11: Thermal and RGB image fusion: a) RGB, b) thermal, c) RGB/thermal
Fig. 12 shows two examples of 3D reconstruction while adding temperature information on the 3D model. Fig. 12a shows a 3D reconstruction using only one frame of the depth camera. Fig. 12b shows a 3D reconstruction using 15 frames taken around the scene. It is worth noting that the more frames considered, the better the depth image. In both cases, with one or many frames, each image from the depth camera was processed using Eqs. (6) and (7) to extract 3D information. Finally, at the end of the data acquisition, ICP was used to register the 15 frames.
In the last qualitative test, a 3D scene is computed after 10 frames (Fig. 12c), and the temperature information of this scene is projected onto the depth image using Eq. (4) (Fig. 12d). The palette color used to visualize the temperature information is configurable by the user using the DepTherm GUI.
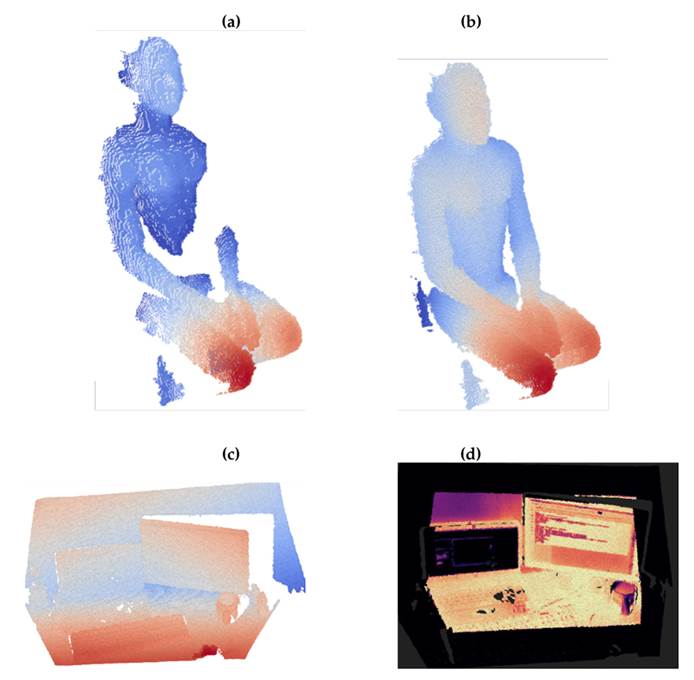
Figure 12: Thermal and depth image fusion: a) point cloud using one frame; b) point cloud using 15 frames; c) point cloud using 10 frames; d) point cloud/thermal image using 10 frames
When comparing DepTherm with the works listed in Table I, it is important to highlight that using two different calibration patterns helps to improve the precision of the calibration process 23, in comparison with the heated or active calibration patterns used in 10), (12)-(14), (17), and 19. According to Table I, popular extrinsic calibration methods are non-linear optimization 5), (8), (10), (16, geometric features 12)-(14), (17, and third-party toolboxes 11), (19. DepTherm uses a homography-based extrinsic calibration method. Its homography matrices were computed using non-linear optimization, so it is comparable to 5), (8), (10), (16. However, homography matrices can transform data between images (RGB to depth or infrared) in a more straightforward way. The works that use geometric features have the advantage of a better relationship between the environment structure and the infrared or depth or RGB images, but, since they depend on illumination conditions, it is difficult to develop an automatic calibration algorithm, which is a subsequent phase of these kind of developments. Finally, Table I shows that most methods use direct mapping of the temperature values onto the point cloud, while others use raycasting and custom methods. DepTherm uses a direct mapping method, as it is a software tool focused on offering the highest FPS possible given the computing constraints. In this sense, methods such as as raycasting increase the mapping between the temperature values and the point cloud, but they are slower 17.
Conclusions
In this work, the software tool DepTherm was described and tested. DepTherm allows users to perform thermo-graphic inspections using three different types of camera (RGB, thermal, and depth). DepTherm allows calibrating these cameras both intrinsically and extrinsically. Both calibrations are performed using custom calibration patterns, and the extrinsic calibration is performed in pairs, i.e., the RGB and depth cameras and the RGB and thermal cameras. As a result, the homography matrices depicted in Eqs. (3) and (4) allow projecting image points between the three cameras. Then, projections between the RGB and thermal cameras are controlled using Eq. (5) , 3D reconstructions are computed using Eqs. (6) and (7) , and the 3D scene with temperature information is obtained using ICP.
To automate the calibration and thermographic inspection processes, the GUI of DepTherm allows users to perform the data acquisition process, to configure and perform the intrinsic and extrinsic calibration processes, to set up the thermographic inspection, to store all data generated into a SQL-based database, and to generate a report of the thermographic inspection. This is done by means of a friendly GUI.
Two quantitative and three qualitative tests were performed to validate the usefulness of DepTherm. The first quantitative test consisted of measuring the reprojection error of corner features between different images (RGB, thermal, and depth). As a result, the mean square error of projecting data points from RGB to depth images was 1,47±0,634 pixels, and the mean square error of projecting data points from thermal to depth images was 0,96±0,37 pixels. In 21, the authors report root mean squared errors of thermal/depth extrinsics of 0,42 pixels. Moreover, in 30, the authors report a mean calibration error of up to 4 px. Thereupon, considering the reprojection errors reported and the fact that two kinds of extrinsic were computed (RGB/depth and thermal/depth), this work has achieved good results.
The second quantitative test consisted of performing a 3D scene reconstruction of a known geometric figure. In this work, a 11 cm side cube was used, and, with the help of the software tool CloudCompare, the worst reconstruction error was up to 4,15 mm. In 2, the authors reported 3D scene reconstruction errors of up to 0,5 m within a measurement range of 0-5 m. 6 reported a 3D scene reconstruction accuracy of 50 mm, albeit considering scenes where objects are located at up to 60 cm. 13 reported root mean square errors of up to 16 mm considering a 1,8 x 1,0 x 1,0 m (h x w x l) testbed. With this in mind, the 3D scene reconstruction performed in this work has results comparable to the state-of-the-art methods reviewed in Table I.
Other three qualitative tests were performed: mapping thermal data onto RGB images, depth image registration, and 3D scene estimation with temperature information. DepTherm allows users to map thermal data onto RGB images regardless the camera maker, and, using this feature, DepTherm users can locate a failure more easily while considering the image context. As for the depth image registration test, the 3D scene estimation requires various frames to avoid shadowed regions. Finally, DepTherm can obtain the 3D representation of the scene with temperature information.
It is worth noting that DepTherm is a software tool that requires a previous calibration phase using two calibration patterns, which it is an operational requirement but could be considered a limitation. In addition, it was experimentally observed that at least 15 frames are needed to avoid shadows in the cloud point in order to properly define the temperature value. Moreover, in this work, the object of inspection should be up to 2 m away, given the use of the Kinect RGBD sensor.
Therefore, it has been evidenced that DepTherm is a software option to be used in thermographic inspections where mapping thermal images onto RGB ones or obtaining 3D scene representations with temperature information is desired.
Future technical developments could include not using calibration patterns, but corners and edges present in the environment, so that automatic extrinsic calibration algorithms can be implemented; estimating the 3D surface of the scene with temperature information; adding new analysis parameters such as area, volume, center of mass, dimensions, among others; implementing novel ICP methods to improve the 3D scene estimation that considers 3D point cloud features in order to obtain an initial guess of the registration process; and implementing loop closing algorithms to minimize the cumulative errors of the point cloud registration. It is important to perform usability tests to ensure that the user experience corresponds with the functional requirements, as well as to know if DepTherm provides an improved experience with regard to environment infrastructure with infrared images, which is a challenging subject.
Acknowledgements
Acknowledgments
This work was partially funded by the research project Multi-sensor integration system to classify surface pavement failures (ID No. 21034) of Universidad del Valle, Cali, Colombia.
References
Licencia
Derechos de autor 2022 Jaimen Junior Aza Taimal, Bladimir Bacca Cortes, Andrés David Restrepo Girón

Esta obra está bajo una licencia internacional Creative Commons Atribución-NoComercial-CompartirIgual 4.0.
![]()
A partir de la edición del V23N3 del año 2018 hacia adelante, se cambia la Licencia Creative Commons “Atribución—No Comercial – Sin Obra Derivada” a la siguiente:
Atribución - No Comercial – Compartir igual: esta licencia permite a otros distribuir, remezclar, retocar, y crear a partir de tu obra de modo no comercial, siempre y cuando te den crédito y licencien sus nuevas creaciones bajo las mismas condiciones.

2.jpg)