DOI:
https://doi.org/10.14483/23448393.19667Publicado:
2023-02-28Número:
Vol. 28 Núm. Suppl (2023): Bogotá, comprometida con el desarrollo de la ciencia y la tecnologíaSección:
Ingeniería CivilTransient DynamicWeather Isolines Generated via IoT Temperature and Relative Humidity Analysis Using the NodeMCU ESP8266 in Bogotá
Isolíneas meteorológicas dinámicas transitorias generadas a partir del análisis IoT de temperatura y humedad relativa utilizando el NodeMCU ESP8266 en Bogotá
Palabras clave:
®Arduino, Internet of Things, Isotherms, ®MATLAB, ®ThingSpeak, NodeMCU ESP8266, Uncertainty, DHT11 (en).Palabras clave:
®Arduino, Incertidumbre, Internet de las cosas, Isotermas, ®MATLAB, DHT11, ®ThingSpeak, NodeMCU ESP8266 (es).Descargas
Referencias
V R, Ravi, M. Hema, S. SreePrashanthini and V. Sruthi, “Smart bins for garbage monitoring in smart cities using IoT system” in IOP Conference Series: Materials Science and Engineering, Erode, India, 2021. doi: https://doi.org/10.1088/1757-899X/1055/1/012078. DOI: https://doi.org/10.1088/1757-899X/1055/1/012078
R. Chacón, H. Posada, Á. Toledo, and M. Gouveia, “Development of IoT applications in civil engineering classrooms using mobile devices”, Computer Applications in Engineering Education, vol 26 no. 5, pp. 1769–1781, June 2018. https://doi.org/10.1002/cae.21985. DOI: https://doi.org/10.1002/cae.21985
K. Schoder, M. Stanovich, T. Vu, C. Edrington, and M. Steurer, “Extended heterogeneous controller hardware-in-the-loop testbed for evaluating distributed controls”, in Proceedings of the International Naval Engineering Conference and Exhibition INEC, Glasgow, United Kingdom, 2018. https://doi.org/10.24868/issn.2515-818X.2018.051. DOI: https://doi.org/10.24868/issn.2515-818X.2018.051
D. Goldin, and H. Gao, “Dynamic isoline extraction for visualization of streaming data”, in Computer Science – Theory and Applications, Ed. Springer Berlin Heidelberg, 2006, pp. 415–426. DOI: https://doi.org/10.1007/11753728_42
D. Srivastava, A. Kesarwani, and S. Dubey, “Measurement of temperature and humidity by using Arduino tool and DHT11”, International Research Journal of Engineering and Technology (IRJET), 2018, vol. 5, no. 12. https://www.irjet.net/archives/V5/i12/IRJET-V5I12167.pdf.
A. Karim, A. Hassan, M. Akanda, and A. Mallik, “Monitoring food storage humidity and temperature data using IoT”, MOJ Food Process Technol., 2018, vol. 6, no. 4, pp. 400-404. https://doi.org/10.15406/mojfpt.2018.06.00194. DOI: https://doi.org/10.15406/mojfpt.2018.06.00194
I. Gunawan, and T. Akbar, “Prototipe Penerapan Internet Of Things (Iot) Pada Monitoring Level Air Tandon Menggunakan Nodemcu Esp8266 Dan Blynk”, Infotek: Jurnal Informatika Dan Teknologi, 2020, vol 3 no. 1, pp. 1–7. https://doi.org/10.29408/jit.v3i1.1789. DOI: https://doi.org/10.29408/jit.v3i1.1789
M. Yusman, and D. Maryanti, “Rancang bangun sistem informasi pilkada berbasis web di kabupaten pidie provinsi aceh”, Jurnal Litek, 2012, vol. 9, no. 2, pp. 133-138.
C. Yohanes, J. Dedy, and D. Rudhistiar, Implementasi Logika Fuzzy Pada Sistem Monitoring Suhu Ternak Ayam Petelur Berbasis Web. Jati (Jurnal Mahasiswa Teknik Informatika), 2021, vol. 5, no. 2, pp. 700–707. https://doi.org/10.36040/jati.v5i2.3789. DOI: https://doi.org/10.36040/jati.v5i2.3789
A. El Kasmi, M., Abouricha, and A. Boulezhar, “A patient’s temperature remote control system based on NODEMCU ESP8266”, in E3S Web of Conferences, Yaounde, Cameroon, 2021, vol. 297, 01053. https://doi.org/10.1051/e3sconf/202129701053. DOI: https://doi.org/10.1051/e3sconf/202129701053
D. Romps, “An analytical model for tropical relative humidity”, Journal of Climate, 2014, vol. 27, no. 19, pp. 7432–7449. https://doi.org/10.1175/jcli-d-14-00255.1. DOI: https://doi.org/10.1175/JCLI-D-14-00255.1
F. Bertolini, F. Le Clercq, and L. Kapoen, “Sustainable accessibility: a conceptual framework to integrate transport and land use plan-making. Two test-applications in the Netherlands and a reflection on the way forward”, Transport Policy, 2005, vol. 12, no. 3, pp. 207–220. https://doi.org/10.1016/j.tranpol.2005.01.006. DOI: https://doi.org/10.1016/j.tranpol.2005.01.006
Cómo citar
APA
ACM
ACS
ABNT
Chicago
Harvard
IEEE
MLA
Turabian
Vancouver
Descargar cita
Recibido: 6 de mayo de 2022; Revisión recibida: 2 de octubre de 2022; Aceptado: 18 de octubre de 2022
Abstract
Context:
This article presents the real-time estimation of temperature (°C) and relative humidity ( %) (interval of 16 seconds) for the city of Bogotá DC via the Internet of Things (IoT).
Method:
This prototype is based on the Arduino ESP8266 NodeMCU module and the DHT11 sensor, as well as on a server-client HTPP communication protocol via Wi-Fi, with remote access to information. 16 sensors were installed in Bogotá DC. These sensors send the observed data to the MATLAB storage cloud (ThingSpeak) via the Wi-Fi module and can be downloaded in real-time. The temperature (°C) and relative humidity ( %) values were calibrated based on measurements made by the TTH002-certified digital thermo-hygrometer.
Results:
Based on the average temperature and relative humidity obtained, two maps were elaborated by implementing QGis: one with the isotherms and another one with isohumes. The inverse distance weighting (IDW) interpolation algorithm was used.
Conclusions:
The use of monitoring devices based on the IoT significantly contributes to automating meteorological data and structuring and utilizing robust databases in the field of Civil Engineering. Thus, the real-time transmission of temperature and relative humidity data allows for the online analysis of variables. Finally, the term adaptive dynamic cartography is proposed, which is associated with the generation of maps via the IoT, through which changes in the observed variables are displayed in real time, which allows monitoring the variables making adjustments based on an interpolation algorithm, as well as automatically and instantaneously generating isolines, which significantly reduces the uncertainty implied by the spatial-temporal resolution of current cartography.
Keywords:
Arduino, Internet of Things, isotherms, isohumas, MATLAB, ThingSpeak, NodeMCU ESP8266, uncertainty..Resumen
Contexto:
Este artículo presenta la estimación de la temperatura (°C) y la humedad relativa ( %) en tiempo real (intervalo de 4 segundos) para la ciudad de Bogotá DC a través del Internet de las Cosas (IoT).
Método:
Este prototipo se basa en el módulo NodeMCU ESP8266 de Arduino y el sensor DHT11, así como en un protocolo servidor-cliente de comunicación HTPP vía WiFi, con acceso remoto a la información. Se instalaron 16 sensores en Bogotá DC. Estos sensores envían los datos observados a la nube de almacenamiento de MATLAB (ThingSpeak) a través del módulo WiFi y pueden ser descargados en tiempo real. Los valores de temperatura (°C) y humedad relativa ( %) fueron calibrados a partir de mediciones realizadas por el termohigrómetro digital certificado TTH002.
Resultados:
A partir de la temperatura medias y la humedad relativa obtenidas, se realizaron dos mapas implementando QGis: uno de isotermas y otro de isohumas. Se utilizó el algoritmo de interpolación por ponderación de distancia inversa (IDW).
Conclusiones:
La utilización de dispositivos de monitoreo a partir del Internet de las cosas (IoT) contribuye de manera significativa a la automatización de datos meteorológicos y al uso y estructuración de bases de datos robustas en el campo de la Ingeniería Civil. Así, la transmisión en tiempo real de los datos de temperatura y humedad relativa permiten analizar variables en línea. Finalmente, se propone el término cartografía dinámica adaptativa, asociado a la generación de mapas a partir del IoT, mediante el cual se visualizan cambios en la variable observada en tiempo real, lo que permite monitorear la variable y hacer ajustes a partir de un algoritmo de interpolación, así como la generación automática e instantánea de isolíneas, lo cual reduce de forma significativa la incertidumbre existente en la resolución temporal y espacial de la cartografía actual.
Palabras clave:
Arduino, Internet de las Cosas, isotermas, MATLAB, ThingSpeak, NodeMCU ESP8266, incertidumbre..Introduction
It is estimated that, by 2025, there will be more than 75 billion IoT devices linked to the Internet 1. Currently, Industry 4.0 and the advent of the Internet of Things (IoT) are changing the approach to the design, construction, development, and monitoring of different civil engineering projects in Colombia. In this sense, educators in the field face various challenges in terms of the application of new technologies in the classroom. These technologies entail automation, monitoring, and control, thus contributing to the construction of smart cities based on the Internet of Things (IoT) 2. In recent years, educational paradigms have evolved from traditional classroom learning to novel approaches 3. The implementation and systematization of theoretical-practical processes in the classroom in the different disciplines of civil engineering lead to the development of applications and tools that significantly contribute to controlling and monitoring the variables observed in the environment. Consequently, it is necessary to extract the dynamic isolines (in real-time) of the transmission data in order to provide the users with information about the performance of the different variables associated with environmental systems 4
In this sense, the academic spaces related to programming in different languages taught in the first semesters constitute a fundamental tool for civil engineering students. Based on these tools, students can propose diverse solutions in the form of developments that systematize calculations and establish the correlation between different variables. This type of technology can be implemented in various fields of Civil Engineering, such as geotechnics (slope monitoring, landslide, erosion) and hydrology (flow measurement, monitoring of atmospheric variables). Temperature and humidity monitoring is also needed in different industrial fields, such as biomedical drug development and cell culture methods 5; risk management (early warnings, generation of hazard maps); IoT environmental monitoring applications used in environmental protection or to measure air or water quality 6; roads and transportation (adaptive solutions to improve mobility, intelligent mobility systems, mesh behavior); structures (monitoring buildings and bridges, structural pathology, smart buildings); topography (real-time transfer of altimetric and planimetric, generation of dynamic models); and hydraulics (monitoring drinking water networks, the development of "smart sewer"prototypes, leak identification).
Water level control devices for reservoirs have recently been developed based on the Internet of Things (IoT), using the NodeMCU ESP8266 board as a microcontroller and the Blynk application as a control device 7. Timeless monitoring is currently used to determine the behavior of different meteorological variables, given its low spatial and temporal resolution. The real-time dynamics of the isolines are however not evident, which is why it is necessary to develop an intelligent model for monitoring temperature and relative humidity which is based on the IoT and Adaptive Dynamic Mapping (ADC). Thus, this study aims to present an approach to implementing the IoT in hydrometeorology, namely regarding temperature and relative humidity. To this effect, 16 DHT11 sensors were installed in Bogotá DC, Colombia. This network is part of the IoT project for the following academic spaces: Hydrology (2021-II, undergraduate), and Computational Hydraulics (2021-III, Master’s program in Civil Engineering). These spaces are attached to the Technological Department of Universidad Distrital Francisco José de Caldas, and their information can be downloaded through the following link: http://www.edgarladino.com. The communication between the sensor and the web is done via the HTTP protocol, which HTTP is responsible for handling browser requests in order to retrieve the data stored in the cloud 8
Materials and methodology
The methodology employed to carry out this study is divided into four parts: hardware, software, programming, and GIS. Each of these elements, which make up the proposed prototype, is listed below.
ESP8266 NodeMCU module
The NodeMCU 8266 module is a Wi-Fi-connected board implemented for IoT projects. The board is programmed through the Arduino IDE. The NodeMCU ESP8266 microcontroller has high processing and storage capacity, supports different types of sensors through pins D0-D8, and has a ESP8266 @ 80MHz (3.3V) (ESP-12E) processor. It also has 4 MB of FLASH memory (32 MBit), Wi-Fi 802.11 b/g/n, integrated 3.3V regulator (500mA), and a USB-Serial converter CH340. The board has an auto-reset function (manual), 9 GPIO pins with I2C and SPI, and 1 analog input (1.0 V max.).
DHT11 Sensor
The hardware consists of the ESP8266 NodeMCU board, and a DHT11 temperature and relative humidity sensor. The DHT11 sensor was selected because it is laboratory-certified. It is an accurate and stable device, generates a digital signal output, and has an NTC (negative temperature coefficient) thermistor 9. This sensor consists of a thermistor for in-situ air temperature measurement. It has three terminals: +Vcc (voltage), Gnd (ground), and DATA (signal). The signal is transmitted through pin D3 of the ESP8266 NodeMCU module. The temperature values (°C) were calibrated from the measurements made by a digital thermo-hygrometer (TTH002), with a temperature measurement range between -50 and 70 °C, a resolution of 0.1, and an accuracy of ±1 °C. Similarly, the device capture range for the relative humidity ( %) is between 15 and 95 %, with a resolution of 1 % and an accuracy of ±5 %.
Prototype
In order to perform the temperature and relative humidity sensor pilot, the electronic components were connected as follows:
-
The ESP8266 NodeMCU board was connected directly to the computer’s USB port via the USB to mini-USB cable (ESP8266 NodeMCU microcontroller input port). This connection serves as an external power supply and establishes the bridge to send the Python code to the board via the Arduino software.
-
The DHT11 sensor was connected to the ESP8266 NodeMCU board via three wires (jumper-female-female). The energy supplied by the board to the sensor flows through the 3v pin, the ground connection through the GND pin, and the digital signal through the D3 pin (Fig. 1)
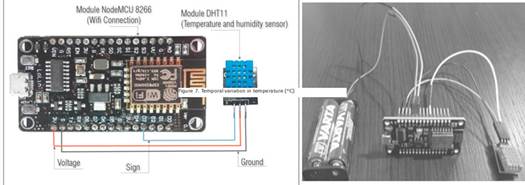
Figure 1: NODEMCU ESP8266 microcontroller
After connecting the prototype, it is necessary to download the following programs:
-
Software Arduino (IDE): https://www.arduino.cc/en/software
-
Register ThingSpeak: https://thingspeak.com
For the correct operation of the code and sensor reading, it is necessary to download and install the following libraries, which are obtained through the Arduino library manager:
-
Library 1: Wi-Fi
-
Library 2: ThingsIoT
-
Library 3: DHT sensor library
-
Library 4: ConnectThings ESP8266
Next, the additional board URL manager is configured by inserting the following address in the Arduino preferences window:
URL manager: http://arduino.esp8266.com/stable/package_esp8266com_ index.json
Once the programs have been installed, the electronic components have been connected, and the channel has been configured in MATLAB’s ThingSpeak, Arduino is executed. The following code is copied into the Arduino window, entering the Wi-Fi network name, the Wi-Fi key, and the apiKey of the channel
Download code: https://drive.google.com/file/d/1b-QemssEQ6L-Ryeq2G9IxYMvGaf-\ BYqL/view
Finally, the serial monitor (COM4) and the ThingSpeak channel present the readings from the DHT11 sensor. ThingHTTP establishes communication between devices, sites, and web services without having to implement the protocol at the device level 10 (Fig. 2).

Figure 2: Serial monitor (Arduino), graphical output (ThingSpeak channel)
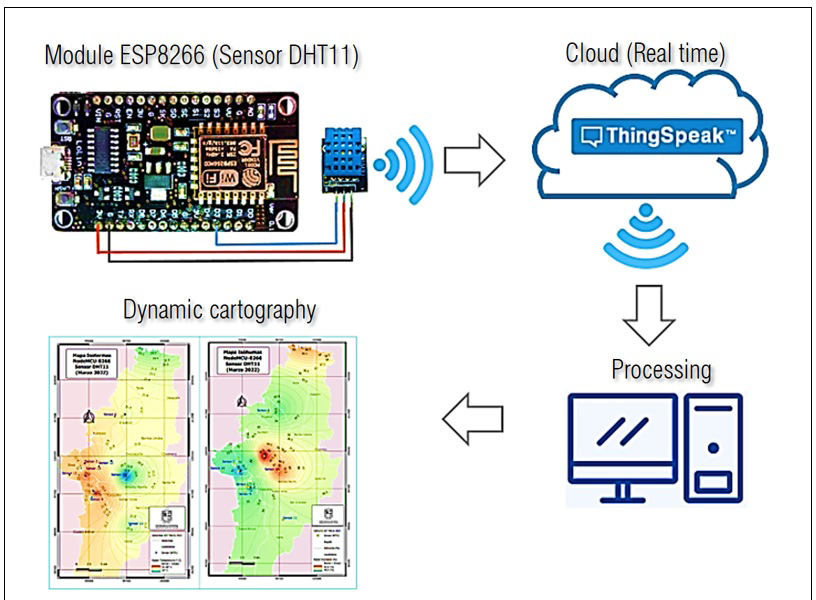
Using this methodology and this type of technology, it is possible to generate adaptive dynamic cartography (ADC), in which the isolines generated by the interpolation of the data observed in real time express the pattern changes of the spatial-temporal variation of the studied variables. The data captured by the sensor are sent to the cloud, in which an automated process of spatial interpolation is performed by implementing different methods, such as IDW, Kriging, Natural Neighbor, Spline, Spline with barriers, and Topo to raster.
The selection of the algorithm depends on the statistical and probabilistic behavior of the observed variable. According to the above, the use instrumentation and automation in processing hydro-meteorological information can reduce errors in the different phases of the process regarding the generation of the interpolated isolines (Fig. 3).
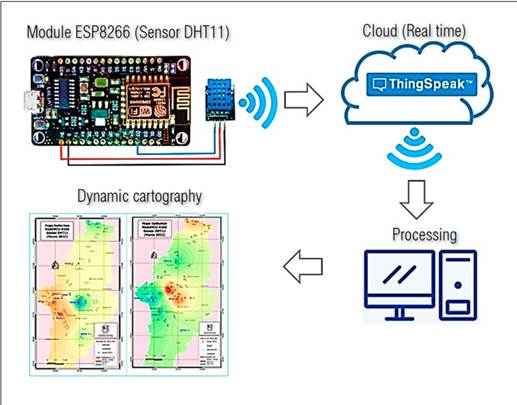
Figure 3: ADC processing
The development of dynamic models associated with hydro-meteorological variables is currently an open field of study, in which it is possible to integrate Civil Engineering, the Internet of Things, and artificial intelligence to obtain intelligent dynamic isolines (IDI). 4 propose a dynamic interval tree for generating dynamic contours of digital terrain models, where the data values in the sources change over time. This tree is built on the edges of triangle irregular networks (TIN), and the z-span of the edge depends on the values at the sites adjacent to the edge.
In this way, it is possible to detect patterns and trends in the studied variable in real time, as well as to synchronously identify the performance of the spatial-temporal patterns. The current approach for the generation of isolines is strongly associated with deterministic models, which are highly deficient when characterizing the performance of variables correlated with different phenomena and exhibit a transitory and probabilistic performance. In other words, variable changes in time and space increase the uncertainty of the forecast, which is related to the use of static and deterministic algorithms. These changes can be demonstrated via isotherm maps, where the spatial behavior of the variable depends on the interpolation algorithm used. As a result, different maps are obtained from the same data observed in situ. This study proposes the adoption and integration of IoT and artificial intelligence to develop adaptive dynamic isolines.
Data processing
The data were obtained from 16 DHT11 sensors located in Bogotá DC. These sensors provided 100 temperature (°C) and relative humidity ( %) readings, with a temporal resolution of 7 days (March 23, 2022 - March 30, 2022).
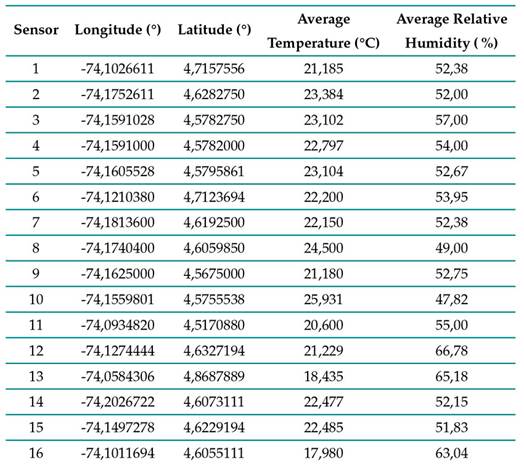
Table I presents the spatial position of the sensors, as well as the average temperature (°C) and relative humidity ( %) for each location.
Source: IoT 2021 Hydrology Project; Master’s Degree in Civil Engineering 2021-III, UDFJC.
Table I: Location of the DHT11 sensors
It was established that the average temperature for Bogotá DC was 22,046 °C, with a standard deviation of 1,999 °C in the period between March 23, 2022, and March 30, 2022. The kurtosis value of 0,781 indicates that the temperature distribution exhibits a mesocortical behavior, showing a normal concentration of the values around its mean. However, the skewness coefficient shows that the distribution is skewed to the right, causing the tail of the distribution to elongate to the left, an effect produced by temperature values below the mean (Table II)
Table II: Temperature and relative humidity statistics

In the case of relative humidity, the mean was 58,87 %, with a standard deviation of 5,489 %. Regarding the asymmetry coefficient, the distribution was skewed to the left, causing the distribution tail to lengthen to the right. This behavior is caused by relative humidity values that are higher than the mean. Fig. 6 shows the existence of a negative correlation, i.e., the temperature and the relative humidity are inversely related; when the temperature value is high, the relative humidity value is low.
Results and discusión
Temperature corresponds to the level of kinetic energy associated with particle motion. Relative humidity establishes the amount of water vapor present in the air at a given temperature, i.e., the water vapor balance in the environment 11. Note that temperature is a factor that directly affects the behavior of the hydrological cycle. For this study, these variables were measured in situ through 16 DHT11 sensors located in Bogotá DC. The information was sent via Wi-Fi to MATLAB’s ThingSpeak server. The data capture block by the sensor was obtained every 2 seconds, generating updated data every 4 seconds in the ThingSpeak server. This information can be visualized through graphs that relate temperature and relative humidity as a function of time (Fig. 4).
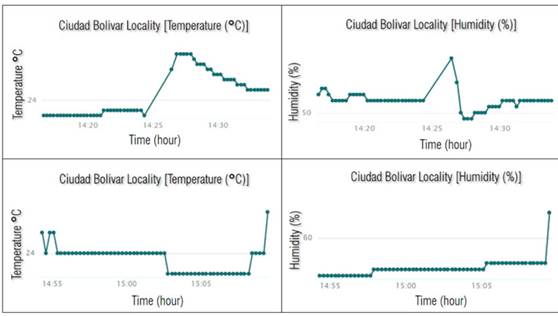
Figure 4: Representation of temperature (°C) and relative humidity (%)
Using the script presented in Table III, it is possible to generate a real-time histogram associated with the temperature and relative humidity behavior. This is done through the ThingSpeak App tool. Fig. 5 shows the behavior of the temperature distribution in frequencies for the last 10 hours of data captured by the DHT11 sensor. Indeed, the histogram shown is updated every 4 seconds due to the time delay associated with the sensor reading time. The production of real-time histograms of the observed variables contributes to describing the evolution of empirical probability distributions over time (stochastic process). Here, it is evident that the temperature directly affects humidity because it acts on the water vapor saturation pressure.
Table III: Temperature histogram script


Figure 5: Temperature histogram script (°C)
There are variables such as wind and solar radiation that directly affect temperature and relative humidity. A positive temperature variation of 1 °C causes a decrease in relative humidity of approximately 4 %. This behavior is evident in Fig. 6: as the temperature increases, the relative humidity decreases. Table IV presents the script for calculating the histograms in real-time.
Table IV: Temperature vs. relative humidity comparison script

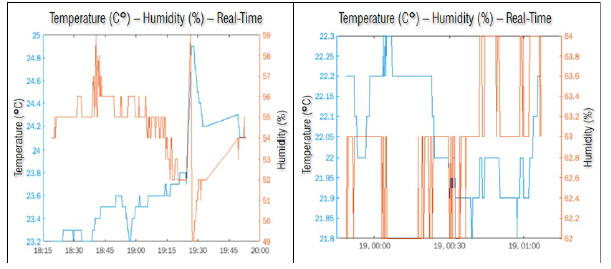
Figure 6: Comparison of temperature (°C) and humidity ( %)
Fig. 7 presents the temporal variation of temperature, expressing its behavior for three series along the same axis. By comparing the temperature evolution for the last three days (March 28, 29, and 30, 2022), it is established that the lowest temperature occurs around 10 p.m. on the observed days, reaching up to 18,5° C. The superposition of the data series in the figure shows three different performances in the temperature variation throughout the day. However, it is possible to identify a pattern in terms of minimum and maximum values for minutes 2.800 and 4.000 (Fig. 7). On the other hand, in the spatial-temporal analysis of temperature and relative humidity, it is necessary to add a probabilistic weight to the algorithms proposed for the interpolation of continuous variables. This implies a change of focus, moving from deterministic models to probabilistic algorithms articulated with artificial intelligence, so the systematic and permanent capture of information from the IoT is fundamental to consolidating robust databases. The generation of "Big Hydro-meteorological Data.and a dynamic and continuous dataset, with free access for the construction of models that help to understand the studied variables, could constitute the baseline for structuring real-time participatory warning networks to formulate contingency and risk management plans.
Inverse distance weighting (IDW) interpolation
Interpolation is a method through which new points are obtained from a cloud of known points by implementing different mathematical algorithms (e.g., IDW, Kriging, Natural Neighbor, Spline, Spline with barriers, and Topo to raster). The method used in this study corresponds to the inverse distance weighting (IDW) interpolation algorithm. The deterministic model (IDW) uses the effect (weight) generated by the values closest to the unknown point, estimating the unknown values from the distance-weighted interpolation of the known values. This method is based on the existing hypothesis of a spatial correlation, where the value of the variable to be estimated in cartographic terms decreases its effect with increasing distance regarding the known values of the observed variable. In this study, the DHT11 sensors provide temperature (°C) and relative humidity ( %) data, and the spatial location of each sensor is obtained (latitude and longitude). These points are weighted in the interpolation process, in such a way that the weight of observation with respect to their neighbors decreases with the distance from a point in space for which the temperature and relative humidity are unknown.

Figure 7: Temporal variation in temperature (°C)

As a result of this process, a continuous value represented by an image (raster) is obtained. Based on this image, the isolines referring to temperature (isotherms) and relative humidity (isohumidity) are generated. In this study, the values of the isolines obtained from the raster are within the established range. Nowadays, there is no mathematical or methodological argument to establish the separation interval of the generated isolines; it is likely that this interval is directly related to the density of the observed points. The more sensors there are, the smaller the interval between isolines. For example, from the temperature reading for three DHT11 sensors, it is possible to estimate the unknown temperature for the location Td (Fig. 8).

In this study, an interval of 0,2 °C was set for temperature, as well as 0,5 % for relative humidity. Fig. 10 schematizes the construction of an isoline from in situ observations. Once the IDW algorithm had been implemented, the observed data were interpolated, and the surface was generated, giving a value to each cell within a grayscale. Each gray level corresponds to a given value for each cell. Thus, from each cell value, the isoline for temperature and relative humidity were obtained. The IDW method can be modified by adding power to the inverse of the distance. This parameter allows controlling the weight of the observed points.
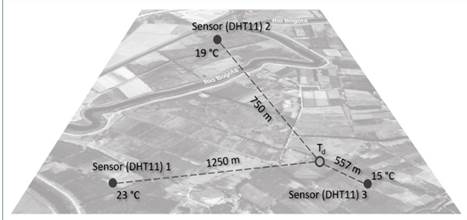
Figure 8: IDW temperature calculation (°C)
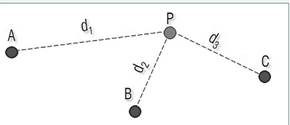
Figure 9: Representation (IDW)

Figure 10: Generation of isolines from continuous data
Currently, cartographic construction involves analyzing the progressive accessibility to static mapping from techniques in dynamic studies without sacrificing robustness and simplicity

Figure 11: Raster histogram for temperature (°C)

Figure 12: Temperature map (°C)
12. However, the development of static maps of continuous variables that change in time and space constitutes an obsolete input due to the low spatial-temporal resolution of the cartographic product. This low temporal resolution can be overcome by developing ‘’intelligent isolines” associated with the performance of the studied variable in real-time. This requires the integration of the Internet of Things, artificial intelligence, and web services in order to identify and interpret the spatial-temporal patterns and behaviors of the in-situ observed variable. This methodology would significantly reduce the uncertainty in monitoring and in the generation of hydrometeorological variable isolines.
Isoline map for temperature (°C)
The isotherm map was obtained via IDW interpolation, generating a raster associated with the coordinate reference system (CRS) EPSG:4326 - WGS 84, with a maximum temperature value in the pixel equal to 25,38°C, an average of 21.84 °C, and a standard deviation of 0,68 °C. Fig. 11 presents the frequency distribution of the temperature level for the pixels. A natural behavior is exhibited by the temperature, due to the data distribution concerning its average and standard deviation values, which entails a type of leptokurtic distribution produced by the high concentration of temperature values around the average. Thus, the highest temperatures were recorded in the localities of Bosa and Ciudad Bolívar. However, the localities of Mártires and Puente Aranda showed the lowest temperatures, reaching a temperature of 18,8 °C. The spatial patterns obtained in the isotherm map (Fig. 12) are in accordance with the performance of the mapping generated by IDEAM corresponding to the 2007 monthly mean temperature distribution map.
Isoline map for relative humidity ( %)
The raster analysis was performed based on the minimum and maximum values for the gray band. Thus, it is observed that the tail of the distribution for relative humidity extends to the right (Fig. 13). This skew is caused by values higher than the distribution average. The maximum relative humidity value for the set of raster pixels was 65,63 %, with a standard deviation of 1,4 %.

Figure 13: Raster histogram for relative humidity ( %).
Fig. 14 shows the spatial distribution of relative humidity generated by the IDW interpolation algorithm. The highest relative humidity values were recorded in the localities of Mártires, Puente Aranda, and the eastern part of Kennedy. By superimposing temperature and relative humidity maps, it is possible to affirm that the sectors of Bogotá with the highest temperature levels caused a gradual decrease in relative humidity.
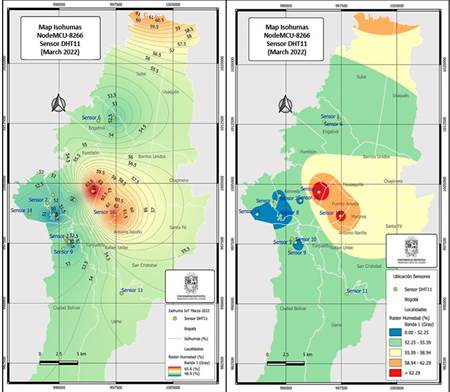
Figure 14: Relative humidity map ( %)
Conclusions
This study proposes the term adaptive dynamic cartography (ADC), associated with the generation of maps based on the Internet of Things (IoT), through which changes in the observed variable are visualized in real-time. This helps to monitor the variable and make adjustments using an interpolation algorithm in real-time, as well as in the automatic and instantaneous generation of isolines, which reduces the number of lines in the mapping process.
The development of dynamic models associated with meteorological variables is currently an open field of study, in which it is possible to integrate Civil Engineering, the Internet of Things, and artificial intelligence to obtain intelligent dynamic isolines (IDI).
Finally, spatial raster analysis articulated with the development of ADC constitutes a fundamental tool in the decision-making process. The methodology proposed in the study demonstrated the feasibility of implementing the IoT in the study of meteorological variables. However, the monitoring capacity of the network depends on the density of spatially located devices.
Acknowledgements
Acknowledgements
The authors would like to thank the students of the academic spaces of Hydrology 2021-III of the Civil Engineering program and Computational Hydraulics of the Master’s program in Civil Engineering (2021- III), attached to the Technological Department of Universidad Distrital Francisco José de Caldas. These students, from the 16 sensors installed in different locations of Bogotá DC, provided the necessary information for this study.
Links for the IoT project, Department of Technology, Universidad Distrital Francisco José de Caldas:
Download IoT Maps NodeMCU ESP8266 Bogotá 2022: https://drive.google.com/file/d/1ZbdlR_2XvlrCmj9TvsURMEIfEQXppKrb/ view?usp=sharing
IoT NodeMCU ESP8266 Bogotá 2022 IoT methodology video: https://www.youtube.com/watch?v=yVi5pgOz4yg&t=528s
Weather data download: www.edgarladino.com
References
Appendix A. NodeMCU ESP 8266 (2022)Model Arduino Codification

Licencia
Derechos de autor 2023 César Augusto García

Esta obra está bajo una licencia internacional Creative Commons Atribución-NoComercial-CompartirIgual 4.0.
![]()
A partir de la edición del V23N3 del año 2018 hacia adelante, se cambia la Licencia Creative Commons “Atribución—No Comercial – Sin Obra Derivada” a la siguiente:
Atribución - No Comercial – Compartir igual: esta licencia permite a otros distribuir, remezclar, retocar, y crear a partir de tu obra de modo no comercial, siempre y cuando te den crédito y licencien sus nuevas creaciones bajo las mismas condiciones.

2.jpg)