DOI:
https://doi.org/10.14483/22487085.12963Published:
2019-11-07Issue:
Vol. 21 No. 2 (2019): July-DecemberSection:
Reflections on PraxisThe Use of Infographics to Enhance Reading Comprehension Skills among Learners
El uso de infografías para mejorar las habilidades de comprensión de lectura en estudiantes
Keywords:
intervención pedagógica, comprensión lectora, infografía, alfabetización visual (es).Keywords:
pedagogical intervention, reading comprehension, infographics, visual literacy (en).Downloads
References
Amy, M. (2015). Reading Comprehension: A Research Review of Cognitive Skills, Strategies, and Interventions. Retrieved from: http://download.learningrx.com/reading-comprehension-research-paper.pdf
Andersen, N. (2002). New Media and New Media Literacy: The horizon has become the landscape – new media are here. Report produced by Cable in the Classroom. p. 30-35.
Bernard, R.(2000). Social Reseach Methods: Qualitative and Quantitative Approaches. Thousand Oakes. CA: Sage Pubications.
Carnine, D. W., Silbert, J., Kame’enui, E. J., & Tarver, S. G. (2010). Direct instruction reading. Boston, MA: Merrill.
Chauvin, B.A. (2003, Autumn). Visual or media literacy? Journal of Visual Literacy, 23, 119-129.
Davis, M., & Quinn, D. (2014). Visualizing text: The new Literacy of Infographics. Retrieved from: https://www.academia.edu/5615673/Visualizing_Text_The_New_Literacy_of_ Infographics
Freire, P., & Shor, I. (1987). A pedagogy for liberation: Dialogues on transforming education. Westport, US: Bergin & Garvey.
Freire, P. (2002). Pedagogy of the oppressed (30th anniversary edition). New York, US: Continuum.
Gee, J. P. (2008). Social Linguistics and Literacies. Ideology in discourses. Third Edition. New York: Routledge.
Gibson, R. (2008). Reading aloud: a useful learning tool? ELT Journal, 62(1), 29-36. https://doi.org/10.1093/elt/ccm075
Herber, H. L. (1970). Teaching reading in the content areas. Englewood Cliffs, NJ: Prentice Hall.
Gómez, N., & Ávila, J. (2009). Improving reading comprehension skills through reading strategies used by a group of foreign language learners. How Journal, 16, 55-70.
Hidi, S. (2001). Interest, reading, and learning: theoretical and practical considerations. Educational Psychology Review,13 (3), 191-209. https://doi.org/10.1023/A:1016667621114
Jones B .R., & Flannigan. S .L (2006). Connecting the digital dots: literacy of the 21st century. Educause Quarterly, 29, 8-10.
LeCompte, M. D., & Preissle, J. (1994). Qualitative research: What it is, what it isn’t, and how it’s done. Advances in social science methodology, 3, 141-63
Matrix, S., Hodson, J. (2014). Teaching with infographics: Practicing new digital competencies and visual literacies. Journal of Pedagogic Development, 3, 17-27.
Peachey,N. (2016). Exploiting Infographics for Digital Literacy and Critical Thinking. Kent, UK: Peachey Publications
Rupley, W. H., & Blair, T. R. (1983). Reading diagnosis and remediation: Classroom and clinic. Boston: Houghton Mifflin.
Smiciklas, M. (2012). The power of infographics: Using pictures to communicate and connect with your audiences. Seattle, US: Que Publishing.
Spires, H. A., & Bartlett, M. E. (2012). Digital literacies and learning: Designing a path forward. Friday Institute White Paper Series, 5.
Strauss, A., & Corbin, J.(1990). Basis of qualitative research: grounded theory, procedures and techniques. London: Seige Publications.
Strokes, S. (2001). Visual literacy in teaching and learning: A literature perspective. Electronic Journal for the Integration of Technology in Education, 1, 10-19.
Tarquin, P., & Walker, S. (1997). Creating success in the classroom! Visual organisers and how to use them. Englewood, CO: Teacher Ideas Press.
Van den Brock, P., & Espin, C. A. (2012). Connecting cognitive theory and assessment: Measuring individual differences in reading comprehension. School Psychology Review, 41, 315-325.
Wileman, R. E. (1993). Visual communicating. Englewood Cliffs, N.J.: Educational Technology Publications.
How to Cite
APA
ACM
ACS
ABNT
Chicago
Harvard
IEEE
MLA
Turabian
Vancouver
Download Citation
Recibido: 26 de enero de 2018; Aceptado: 13 de octubre de 2019
Abstract
This article describes a pedagogical intervention carried out at a public university in Colombia. A total of 26 psychology students, aged between 19 and 26 years old, taking English classes for academic purposes, and in their fourth semester, participated in this study. This intervention was implemented for an academic semester and aimed to help learners develop their English reading skills-from literal to critical comprehension of short academic texts-through the use of infographics, which are visual tools that combine texts and graphs to help users communicate information. Teachers used students’ infographics to assess their understanding of short academic texts in English, and they interviewed students to learn their opinions on the intervention. Further, teachers implemented a colour-coding technique in interview transcripts to show relevant patterns in the student opinions. This data analysis indicated that the students clearly understood the ideas from the texts because they were able to go beyond reading to dynamise information in the infographics while using the visual aids as mediators in expressing their ideas. In conclusion, the infographics were beneficial in developing the students’ reading skills. They presented an opportunity for the students to paraphrase main ideas from the texts and represent their understanding of the readings. In addition, this pedagogical intervention was useful for teachers because it enabled them to explore reading comprehension using a new strategy that might be helpful in English classes.
Keywords:
pedagogical intervention, reading comprehension, infographics, visual literacy.Resumen
Este artículo describe una intervención pedagógica realizada en una universidad pública de Colombia. Un total de 26 estudiantes de psicología, de entre 19 y 26 años de edad, que tomaban clases de inglés con fines académicos, y que cursaban su cuarto semestre, participaron en este estudio. Esta intervención se implementó durante un semestre académico y tuvo como objetivo ayudar a los estudiantes a desarrollar sus habilidades de lectura en inglés (desde la comprensión literal hasta la comprensión crítica de textos académicos cortos), mediante el uso de infografías, que son herramientas visuales que combinan textos y gráficos para ayudar a los usuarios a comunicar información. Los profesores utilizaron las infografías de los estudiantes para evaluar su comprensión de textos académicos cortos en inglés, y entrevistaron a los estudiantes para conocer sus opiniones sobre la intervención. Además, los profesores implementaron una técnica de codificación por colores en las transcripciones de las entrevistas para mostrar patrones relevantes en las opiniones de los estudiantes. Este análisis de datos indicó que los estudiantes entendieron claramente las ideas de los textos porque fueron capaces de ir más allá de la lectura para dinamizar la información en las infografías y utilizar las ayudas visuales como mediadores para expresar sus ideas. En conclusión, las infografías fueron beneficiosas para el desarrollo de las habilidades de lectura de los estudiantes. Presentaron una oportunidad a los estudiantes para parafrasear las ideas principales de los textos y representar su comprensión de las lecturas. Además, esta intervención pedagógica fue útil para los profesores porque les permitió explorar la comprensión lectora utilizando una nueva estrategia que podría ser útil en las clases de inglés.
Palabras clave:
intervención pedagógica, comprensión lectora, infografía, alfabetización visual.Introduction
According to Gee (2008), reading is a process that cannot be separated from oral language interactions; it is connected to culture, social interactions and society itself. Accordingly, when reading, people create connections with their previous knowledge, which is linked to their social interactions and the culture they belong to. Therefore, reading is an act of constructing meaning based on previous experiences, and those experiences are recreated according to the latest information that is read. Reading can also be defined as an art; it is an act of interpretation and creation.
Sometimes, when students read in academic settings, teachers assess or monitor their text comprehension through tests that are mainly designed to give unique answers. They sometimes tend to forget that reading goes beyond decoding words or giving accurate answers; it can create an opportunity for students to interact with their peers and enhance their understanding and interpretation of texts. However, in some instances, reading is only performed at an individual level. In the setting where this pedagogical intervention was carried out, students of psychology in English classes worked on readings that were mainly explored through tests that focused on assessing reading comprehension using multiple-choice questions. At the beginning of the semester, teachers observed that students were barely connected through reading activities and were just answering the readings because they were mandatory tasks. Therefore, they started looking for alternatives to explore the reading comprehension of texts. In particular, they wanted an alternative that could enable students’ progress from literal to critical reading. This could help learners reconstruct the meaning of the texts by decoding words and creating ideas based on their previous knowledge and the interpretation of texts. In addition, the teachers wanted to fully involve learners in the process of reading.
The authors of this study found that the use of visual literacy could be an alternative to connect learners in the process of reading comprehension. Wileman (1993) opines that visual literacy is ‘the ability to turn information of all types into pictures, graphics or forms that help communicate information’ (p. 113). Visual literacy can help facilitate learners’ active involvement in the learning process because they are able to create and to express their understanding and interpretation of readings through images and texts. Some studies have demonstrated that by using visual literacy, students are motivated to actively participate in their learning practices. Strokes (2001) conducted a review of studies about visual literacy and concluded that visual elements in teaching yield positive learning results. Tarquin and Walker (1997) also indicate that when they implemented visual organisers, which integrated images and texts to help learners portray their ideas, positive learning outcomes were witnessed because students were able to visualise their ideas and relate those ideas with their previous knowledge.
The authors of this study considered the use of infographics as an alternative to enhance learners’ reading process. They found out that infographics are ‘modern, written artefacts about collected resources in a dynamic, visual format’ (Davis and Quinn, 2014, p. 16). Peachey (2016) indicates that ‘when creating an infographic students have to be able to comprehend the information as a whole and understand how the parts relate to each other in order to decide how to layout their design. Their understanding of the data will need to inform the structure of the graphic’ (p. 9). Therefore, the authors of this study believed that infographics could be an alternative to enhance learners’ reading process and text comprehension. With infographics, learners are able to use the information that they read and explain it through texts and images that represent their reading comprehension. They achieve this by completing different tasks such as decoding information, presenting their points of view, and suggesting possible solutions according to the readings they are given.
The authors of this study applied infographics in groups by means of a tool called Visme™, which is a free web 2.0 tool that is easy to handle. Infographics were mainly done within the university, with some few cases being done from home because of the lack of internet connectivity.
Context and Participants
This pedagogical intervention involved two groups of students, who were in their fourth semester of psychology at a public university in a small town near Bogotá. There were 26 participants in this intervention, aged between 17 and 26 years old and living in rural areas of Cundinamarca. The students undertook two hours of English classes, and they were required to independently work for an hour from their homes. All the students were in basic English level classes and were working on readings related to psychology. At the university, there are no mandatory textbooks or readings to follow; therefore, teachers can select the material according to students’ needs.
Data Collection Instruments
For this pedagogical intervention, two instruments (interviews and students’ artefacts) were applied to gather data and to analyse the students’ reading process of short English texts.
Interviews
According to Bernard (2000), interviews are tools that help capture the participants’ perceptions toward an issue. In this study, at the end of the implementation of the pedagogical intervention, a semi- structured interview was carried out to gather information about the students’ opinions in regard to the use of infographics and the development of reading skills. The questions that guided the interview were: Do you remember how many infographics we developed this semester? What are your opinions on the act of reading, taking into account the process that was carried out this semester? How can the use of infographics help you in your reading comprehension? In order to interpret the students’ interviews, teachers implemented a colour-coding technique. According to Strauss and Corbin (1990), this method enables research to identify silent patterns by finding commonalities from the data being analysed. Having analysed the data, the teachers found the following commonalities in the interviews: clarifying ideas, going beyond the texts and dynamising information.
Students’ Artefacts
LeCompte and Preissle (1994) indicate that saving the samples of work produced by students over time might be useful data for the researchers because it allows recording what the participants do, say, produce or write. In this study, students’ infographics were valuable artefacts to observe and analyse how learners developed the process of reading comprehension. Besides, the students’ artefacts were useful tools to guide learners and give them feedback on their process of reading comprehension. Likewise, teachers were able to know more about their students’ thoughts on the short English texts.
Theoretical Constructs
Reading Comprehension as a Process
According to Van den Brock and Espin (2012), reading comprehension is a complex interaction among automatic and strategic cognitive processes that allow readers to create mental representations of the texts. Amy (2015) indicates that ‘reading comprehension not only depends on characteristics of the reader, such as prior knowledge and working memory, but also on language process, such as basic reading skills, decoding, vocabulary, sensitivity to text structure, inference and motivation. Comprehension also requires effective use of strategic processes, such as metacognition and comprehension monitoring’ (P. 6). Hence, teachers play an important role in guiding learners in the process of acquiring or developing those strategies so that they are able to create meaning, connections and interactions with the readings and state their points of view about the texts. For instance, Gómez and Ávila (2009) conducted a study where they helped learners who were taking English classes in two elementary courses, in an EFL setting, to foster some reading skills and obtain better results in their class exams and international tests. The researchers applied strategies for reading comprehension such as comparison-contrast charts, graphic organisers, question-answer relationship and reciprocal teaching. The findings of this study indicate that students got better results in class exams. In addition, they were able to summarise the main ideas from the texts they were given. Therefore, they not only improved their reading skills but also their writing skills. This implies that presenting and applying reading skills to the students helped enhance their reading comprehension skills.
In this pedagogical intervention, the participants were introduced to short English texts related to their academic discipline. The teachers decided to guide learners by increasing the levels of reading comprehension as the intervention progressed. First, learners engaged in tasks of literal comprehension. Next, they worked on tasks of inferential comprehension, and finally, they were exposed to tasks of evaluating comprehension of texts that promote deeper and more critical interactions.
Carnine et al.(2010) indicate that in literal comprehension, learners should extract information that is explicitly specified in the text. Rupley and Blair (1983) state that literal comprehension is based on two strategies: recall or the ability to provide an idea (e.g., main idea or detail) that was part of a passage and recognition or the ability to identify specific information in the text. During this pedagogical intervention, literal comprehension was carried out using a text about body language, and learners were required to paraphrase the main ideas that they found in the reading. Likewise, in a task that involved reading a text titled ‘Sports and Social Identity’, learners were required to form sentences and formulate questions to their peers.
According to Rupley and Blair (1983), inferential comprehension might be an extension of literal comprehension. In inferential comprehension, readers go beyond recognising facts in the readings and start interacting with the text to make inferences about information not stated in the texts. At this stage, there is no enough understanding of the data provided by the author of the text. The reader should manipulate the reading to interpret and draw conclusions from the reading. In this pedagogical intervention, learners developed a task of inferential comprehension. This was achieved through the reading ‘Facts about Shopping’, where learners were required to manipulate the text so as to ascertain whether they agreed or disagreed with the authors of the text.
Herber (1970) points out that at evaluating level, readers should juxtapose what they have read in the texts with their previous knowledge or experiences of life in order to create new meanings to the texts. In the process of juxtaposition, readers should understand the text, make interpretations upon the author’s ideas, and analyse and evaluate the information obtained from the text. In this pedagogical intervention, the last two tasks required learners to juxtapose the information that they had read with their previous knowledge to create viable solutions to the stated situations of shopping bags and cyberbullying.
In this pedagogical intervention, reading comprehension was carried out as a process by means of strategies that could help learners be more critical toward the texts.
Visual and Digital Literacy
In this 21st century, the concept of being literate has been adapted to the new necessities and contexts. Nowadays, to be literate means not only to have the ability to read and write but also to be critical and to communicate effectively through different media. These new digital and visual environments govern education, interactions, behaviours and people’s ways of living. According to Jones and Flannigan (2006), digital literacy can be understood as ‘a measure of the ability of users to perform tasks in digital environments’ (p.6). Likewise, it refers to the ability of analysing, interpreting, organising and evaluating the information received from the media. Therefore, we as teachers should offer opportunities to our students to use digital literacy to construct creative products and to build knowledge critically from digital data. We as teachers need to guide learners through organized steps and clear objectives, so students can find real reasons to use it.
Spires and Bartlett (2012) state that digital literacy includes three steps: 1) finding and reading digital content such as online articles, newspapers, comics, and magazines; 2) Creating digital content such as posters, videos, photos, blogs, and infographics; and 3) communicating or sharing the digital content. This step can be done through social networks such as Facebook, Twitter or Instagram. It can also be done through learning management systems such as Moodle or Blackboard.
Visual literacy is also linked to digital competence and the current learning process that this generation is facing. Chauvin (2003) explains that visual literacy is understood as the ability or competence of observing, analysing and interpreting visual actions, images and symbols and engaging in a cognitive process. According to Andersen (2002), these two literacies (i.e., visual literacy and cognitive information processing) are part of this generation of people who are completely immersed in the technological trend and who are somehow digital-savvy. Learners are keen on technology; therefore, they can learn using technology even without realising that they are learning and they can self-actualise.
Therefore, when it comes to this generation of students, the teachers’ responsibility is to help them choose the necessary tools, tasks and strategies that can help them to intelligently interact with the digital environment and take advantage of the new techniques of communication, so they are able to create digital content and express and share their ideas with the communities where they belong.
Infographics
The teaching-learning process is facing up a new methodology paradigm in this millennial generation that is surrounded by technology, computers, internet and social networks. Educators have a big challenge when it comes to the use of attractive, eye/attention-catching materials that enhance and foster student learning. The second language teaching process is no exception. Learners of this generation are open to receiving instant messages and lots of visual information. Therefore, it is important to implement strategies that can help them acquire visual/digital literacy and be critical. Infographics are a good pedagogical strategy that can enrich and nurture the development of students’ reading comprehension skills. Furthermore, the use of infographics develops digital and visual skills, analytical thinking, creativity, and long-term memorisation of vocabulary (Matrix and Hodson, 2014)
Smiciklas (2012) defines an infographic as ‘a visualisation of data or ideas that tries to convey complex information to an audience in a manner that can be quickly consumed and easily understood’ (p.3). The use of infographics develops students’ abilities of visualisation and organisation of ideas. In addition, it helps them to better understand and represent the text they read. Infographics foster the reading learning process and enhances the students’ ability to master vocabulary and grammar structures of the new language. In this study, during the elaboration of infographics, the participants moved from decoding information to representing their points of view and suggesting some possible solutions while taking into account the readings presented in the lessons. Therefore, infographics were used as the means of presenting learners’ understanding, interpretation and suggestions about the texts they read. Consequently, infographics can be good tools for facilitating reading comprehension in classrooms and the manner in which they are used will entirely depend on the needs and purposes of each setting.
Pedagogical Intervention
This pedagogical intervention was conducted in three stages. The first stage was preparing the field, in which teachers selected the readings for the classes, created a website for publication of the infographics, and defined the term infographics for the students. In the second stage, which was during the intervention, teachers read the texts alongside the students and held discussions based on the readings. In the third stage, which was developing the infographics, students created infographics based on the guidelines given at the beginning of the lessons. A detailed description of this pedagogical intervention is provided in the following sections.
Preparing the Field
Selecting Readings
In the setting where this pedagogical intervention was conducted, the syllabus indicates that students should work on readings related to their career discipline -in this case, psychology. Exploring readings related to the students’ discipline is beneficial because the readings could be linked to the learners’ interests. According to Hidi (2001), when learners are connected to their interests, they tend to be more persistent in working toward achieving their learning goals.
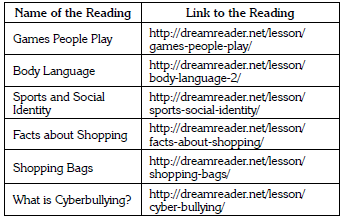
Teachers looked for readings connected to the learners’ English skill level (See Table 1). They found a website named dreamreader.net. This site offers distinct types of readings -from general to academic texts- that are categorised based on English skill levels: beginner, intermediate or advanced. After exploring the site and taking into account all the other relevant factors, the teachers selected the following readings for the pedagogical intervention.
Table 1: Readings for the pedagogical intervention.
Creating a Home for Our Readings and Infographics
A website was designed to enable students find the relevant readings for their classes and to post their infographics and receive comments on them. This website was created on webs.com, a free web 2.0 tool that makes it easy to design websites. The home for the readings and infographics can be found at www.englishfourfaca.webs.com (See Figure 1).
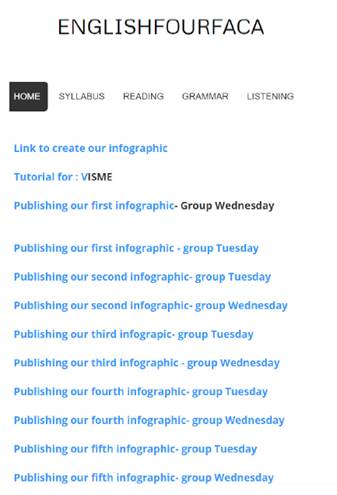
Figure 1: Home for the readings and infographics.
Introducing Students to Infographics and their Connection to Reading Activities
Before the start of the pedagogical intervention, students were asked if they knew what an infographic was, and most of them answered that they did not know what the term meant. As a result, teachers described the main characteristics of infographics, taking into account the theory presented by Mark (2014). They explained that infographics are illustrations that combine graphics and images with text and they are usually used to analyse or display information.
Teachers then developed and presented an infographic on the first reading, which was titled ‘Games People Play’. Students were given an opportunity to evaluate the infographic by looking at its topic, its purpose, its presentation of information, how its visual elements supported understanding or analysis, and how it could be improved.
Next, the students received guidelines for developing their own infographics, with an example provided by teachers. It was explained that the design of an infographic depends on the intention of the author. They were instructed to develop infographics to illustrate their interpretation of the selected readings by presenting information, testing information, manifesting agreement or disagreement with the text, and providing solutions to the situations presented in the readings.
In this pedagogical intervention, the infographics were designed bearing in mind the levels of reading comprehension. Given that it was the first time students were dealing with short English readings, specifically texts with approximately 350 words, teachers saw it fit to increase the level of reading comprehension throughout the process.
Guiding Students to Create Infographics on Visme
Visme is a free-to-use website, which allows users to create diverse visual formats for presentations, animations and infographics. It is practical and easy to use, and online tutorials are available. In this pedagogical intervention, teachers downloaded a tutorial and presented it to learners.
During the Intervention
Reading Aloud
During the intervention, teachers read texts aloud with students. Many studies have highlighted the benefits of this process. According to Gibson (2008), reading aloud can help learners reinforce graphemic-phonemic correspondences. It can also aid in the acquisition of the prosodic features of English, can be used as a method for autonomous learning, and may help anxious students feel more comfortable speaking the language.
Generating Discussions about the Readings
After reading aloud, teachers posed questions to guide short discussions related to topics addressed in the readings. Topics and questions for the five readings were as follows:
-
On body language: Would you rely on body language when interviewing somebody for a job?
-
On sports and social identity: Do you have any social identity with a football team?
-
On shopping: Is it true that women shop more than men?
-
On shopping bags: Do you consider that the strategy of the government about taxes on shopping bags helps reduce their use?
-
On cyberbullying: Have you ever witnessed a case of bullying or cyberbullying?
By generating dialogue through questions, teachers were able to observe that participants gave their points of view based on their previous knowledge and started to expand their ideas based on the readings presented in the lessons. This is in line with the theory presented by Freire (2002). He points out that people learn and remember information when they engage in dialogue with their peers rather than when they just listen to an expert lecture. He argues it is important to create and promote spaces where true dialogue can take place and where learners can learn from one another based on the knowledge each brings.
Developing the Infographics
The teachers and students agreed that learners were going to complete their infographics in groups and discuss the readings with their peers. At the beginning of each class, students were required to focus on the topic of the infographic, the purpose of the infographic, the presentation of information and how the visual elements support understanding or analysis. The following sections present samples and further explanations related to development of the infographics.
Infographics Related to the Reading ‘Body Language’
For the first infographic, the teachers explained that identifying main ideas helps readers know what texts or paragraphs are about. They indicated that students should ask themselves some questions in order to identify a text’s main ideas. These included the following: What is the reading about? What is the topic of the paragraph or text? What does the author want us to know about the paragraph or the text?
For the body language infographic, students were asked to represent the text’s main ideas. They underlined these ideas and paraphrased them in their infographics. In the previous sample about the reading ‘Body Language’ (See Figure 2), students identified the main ideas and clearly presented them through images. They also presented examples and, in general terms, covered the key aspects of the text.
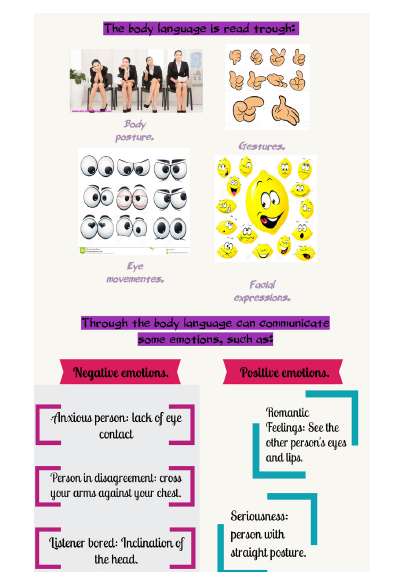
Figure 2: A sample infographic about the reading ‘Body Language’.
Infographics Related to the Reading ‘Sports and Social Identity’
For the second infographic, the teachers asked the students to create tests to evaluate whether or not their peers had understood the reading ‘sports and social identity’. Figure 3 shows a test that was developed by some students. The questions relate to the images and can be understood despite having some grammar errors. Overall, the students correctly answered the questions in the tests their peers created.
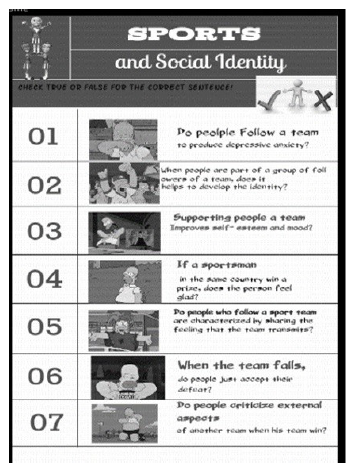
Figure 3: A sample infographic about the reading ‘Sports and Social Identity’.
Infographics Related to the Reading ‘Facts about Shopping’
The readers were asked to evaluate the texts they read, indicate whether they agreed or disagreed with the authors’ ideas, and provide reasons for their agreement or disagreement. For the third infographic, ‘Facts about Shopping’, the students were asked to justify their answers by giving their own opinions or by citing a supporting theory.
In Figure 4, the students justified their answers, starting to be more critical toward the text presented. This reading claimed that ‘Magazines say that most women who enjoy shopping are more confident and happier’. The students disagreed with this statement, arguing that ‘The feeling of confident (sic) and happiness can be temporary and not complete because the person can have a crisis by spending money that does not have’.
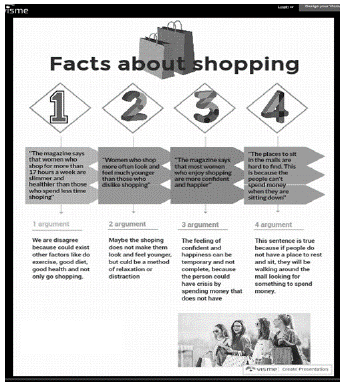
Figure 4: A Sample infographic about the reading ‘Facts about Shopping’.
In this example, the students indicated that buying can be driven by a state of crisis, thereby rebutting the writer’s opinion using their own knowledge.
Infographics Related to the Reading ‘Shopping Bags’
The fourth reading discussed a topic that is currently trending in the news in our country: the use of shopping bags. For this fourth infographic, the students were asked to present alternatives to reduce the use of these bags to examine whether they were aware of the problems occasioned by using them. In Figure 5, the students argued that ‘Never throw bags or any type of garbage into the toilet, rivers or the sea, if you do not want to hurt animals’. This statement highlighted the negative effects of using and dumping plastic bags, thereby allowing the students to be active readers and reflect on a topic that has elicited debate in our country and around the world.
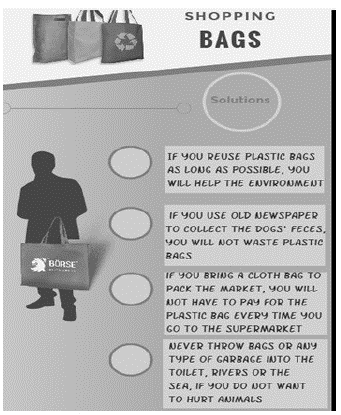
Figure 5: A Sample infographic about the reading ‘Shopping Bags’.
Infographics Related to the Reading ‘Cyberbullying’
For the fifth infographic, the students read a text about cyberbullying, which is an important topic in our country and around the world. These students are future psychologists who will be guiding people to overcome social problems such as cyberbullying. Therefore, this infographic presented a good opportunity for the students, as future psychologists, to identify alternative solutions to the problem.
In Figure 6, the students organised their ideas to introduce possible solutions to cyberbullying. They first indicated what cyberbullying is, then they identified possible factors contributing to this problem and, finally, they presented a solution from a psychological perspective.
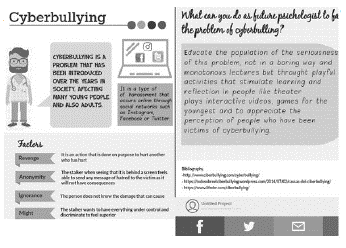
Figure 6: A Sample infographic about the reading ‘Cyberbullying’.
In this infographic, the students went beyond the reading; they demonstrated their creativity in presenting viable solutions to the problem of cyberbullying. By doing so, they showed that reading is not just about decoding words, but also proposing solutions to problems.
Students’ Voices
In the following sections, the students’ voices, which reflect the process of reading comprehension, will be presented. The teachers asked the following questions: What are your opinions on the act of reading, taking into account the process that was carried out this semester? How can the use of infographics help you in your reading comprehension? The students’ answers are presented in three categories: clarifying ideas, going beyond the text and dynamising information.
Clarifying Ideas
The students’ answers indicated that the use of infographics helped them clarify ideas from the texts. Here are some of their opinions:
Participant M said: ’El uso de infográficos permite desmenuzar la información; para así poderla presentar mejor’
[‘The use of infographics allows us to break all the information down into pieces so that we can present it better organised’.]
Participant D said: ‘las infografías permiten aclarar ideas, se obliga uno a buscar las palabras para representarlas en las imágenes’
[‘Infographics allow us to clarify ideas, they push us to look up the words and help us represent them in images’.]
Participant J said: ‘las infografías hace que las ideas sean más claras ..hay que buscar la manera de presentar la información más precisa’
[‘Infographics make ideas clearer. We have to look for a precise way to present the information’.]
Source: Students’ interview (October 17th, 2017)
The students felt that they were able to better clarify information from the texts when using the infographics. It can be said that the students started a process of representing their understanding of the readings through images and texts. Therefore, the use of infographics can help learners take information from texts and re-create what they have understood, thus enhancing their reading comprehension skills.
Going beyond the Text
The learners indicated that through the pedagogical intervention, they were able to see that reading implies going beyond the text. The following lines present some of their opinions:
Participant J said: ‘se tiene que ir más allá, no solo quedarse con el texto, sino buscar más información para argumentar lo que el texto indica.
[‘It is necessary not to remain with the information given by the text, but to go beyond. To look for more information to argument what the text indicates’.]
Participant M said: ‘con estos ejercicios se pudo criticar el texto, dar el punto de vista’
[‘With these exercises, we could criticise the text and give our points of view’.]
Source: Students’ interview (November 20th, 2017)
In the last infographics, the learners interacted more with the texts and tried to agree or disagree with the authors of the readings. They also presented viable solutions to the problem of cyberbullying. Clearly, they were able to apply their knowledge to solve a current social problem and, therefore, the teachers could feel that they went beyond the text.
Dynamising the Information
The students indicated that using infographics helped them dynamise the information that they wanted to convey, as presented in the following statements:
Participant C said: ‘las infografías permiten aclarar y expresar mejor la información, además es más dinámico‘
[‘Infographics allow us to clarify and express the information better. Besides, it is more dynamic’.]
Participant J said: ‘las infografías dejan que seamos más claros y precisos y no tan generales. Además de que usamos colores para estimular la visión y la atención’
[‘the infographics help us being clearer and precise avoiding being so general in our ideas. Furthermore, we can use colours and that stimulates our attention’.]
Source: Students’ interview (November 7th, 2017)
Through the use of the tool Visme, the students were able to represent their thoughts visually-by applying colours, images and even sounds to the information. It can be concluded that visual tools helped them to actively participate in the process of reading comprehension.
Conclusions and Implications
During this pedagogical intervention, the students and the teachers explored reading comprehension as a process by integrating class activities and infographics developed digitally using a visual tool. The results of this intervention, from the points of view of both the teachers and the students, are highlighted below.
According to the students’ voices, which were presented in the previous sections, when they designed and worked on their own infographics they were able to clarify ideas from the texts because they could represent their thoughts using words and images. Combining text and graphics helped them organise their ideas and paraphrase and communicate what they learned. The students also stated that with this reading strategy, they were able to analyse the texts thoroughly. They made the effort to investigate and learn more vocabulary in order to re-create the texts in their infographics. This pedagogical intervention facilitated the students’ active participation in their own learning process and enhanced the development of their reading, writing and critical thinking skills.
For the teachers, it was an innovative way of observing the students’ reading comprehension of texts. Sometimes, educators only focus on assessing students’ comprehension of texts rather than creating opportunities for students to enjoy, explore and learn from the readings. When teachers try new alternatives to explore reading comprehension, better teaching practices are likely to emerge. In this case, the combination of the activities carried out in class and the use of infographics was effective. The teachers had evidence of the students’ voices and thoughts about the texts and were able to see their students’ potential to actively participate in the reading comprehension process.
In addition, the teachers were able to realise that their duty as educators goes beyond transferring information to the students and evaluating them; they should also be able to provide them opportunities to read the world and be critical toward it. Freire and Shor (1987) point out that teachers, as critical facilitators, should support learners in looking critically at their real-life situations to enable them create connections between their individual problems and their social environment. This pedagogical intervention aimed at engaging learners in the reading process so that, in future, they can continue exploring readings and creating critical dialogues with the authors of texts.
The use of Visme was beneficial to both the learners and the teachers as a tool that is easy to handle and can even be applied to foster other skills such as writing or speaking. Technology brings changes and new challenges to education, and the teaching of English as a second language is no exception. The students of this century are experiencing new ways of reading, writing and even learning; therefore, it is important for teachers to be armed with new teaching practices that can enhance and support the current learning processes. In teaching English, infographics can be a medium used in different settings to attract students’ attention and help them improve and develop their learning process and language skills.
Therefore, it can be concluded that the students in this intervention went beyond the texts. They were able to understand the readings, give their opinions on them, and go further in their reading comprehension skills. In addition, they were able to create connections with their previous knowledge, their social interactions and their culture and beliefs.
Limitations
It is important to mention a caution for future implementations of this pedagogical intervention. At the beginning of this study, the learners were attracted by the visual tool they were applying, Visme, and they overloaded their first infographics with images, forgetting that the essence of infographics is to communicate dense information with the help of text and images. It was, therefore, necessary to keep on reminding them of the purpose of infographics. Thus, for any future implementation, it would be vital to clarify, at the very beginning, the appropriate use and meaning of infographics.
Technical matters also need to be taken into consideration. The infographics were developed on a website. In some cases, the internet connection did not work efficiently and the teachers and the students were forced to spend more time than expected in the development of the infographics. Therefore, for any future implementation, teachers should take this into account and create strategies for developing infographics on paper in order to utilise their time more efficiently.
References
Metrics
License

This work is licensed under a Creative Commons Attribution-NonCommercial-NoDerivatives 4.0 International License.
Attribution — You must give appropriate credit, provide a link to the license, and indicate if changes were made. You may do so in any reasonable manner, but not in any way that suggests the licensor endorses you or your use.
NonCommercial — You may not use the material for commercial purposes.
NoDerivatives — If you remix, transform, or build upon the material, you may not distribute the modified material.
The journal allow the author(s) to hold the copyright without restrictions. Also, The Colombian Apllied Linguistics Journal will allow the author(s) to retain publishing rights without restrictions.