DOI:
https://doi.org/10.14483/23448393.16898Published:
2020-10-05Issue:
Vol. 25 No. 3 (2020): September - DecemberSection:
Special Section: Best Extended Articles - WEA 2015Application of a Supervised Learning Model to Analyze the Behavior of Environmental Variables in a Coffee Crop
Aplicación de un modelo de aprendizaje supervisado para analizar el comportamiento de variables medioambientales en un cultivo de café
Keywords:
Decision trees, precision agriculture, supervised learnings model, wireless sensor network (en).Keywords:
Agricultura de precisión, arboles de decisión, modelos de aprendizaje supervisados, redes de sensores inalámbricos (es).Downloads
References
J. D. Pinto, “Monitoreo de cultivos con redes de sensores Xbee, arduino y dispositivos de medicion de suelos” Thesis, Universidad Tecnologica de Pereira, Pereira, 2015.
J. Ordieres, F. J. Martínez, A. de Pisón, A. González, F. Alba, R. Lostado, and A. V. Pernía, Redes inalámbricas de sensores: teoría y aplicación práctica. La Rioja: Universidad de la Rioja, Servicio de Publicaciones, 2009.
K. Siavosh and A. Jaramillo, “Nutricion de los cafetales en Colombia”, Avances Técnicos Cenicafé, no. 473. https://www.cenicafe.org/es/publications/AVT0473.pdf.
Portafolio, “El café vuelve a ser el motor de la economía”. [Online]. Available: https://www.portafolio.co/economia/el-cafe-vuelve-a-ser-el-motor-de-la-539712
M. Quiñones, V. González, R. Torres, and M. Jumbo, “Sistema de monitoreo de variables medioambientales usando WSN y una plataforma cloud”, Enfoque UT, vol. 7, no. 1, pp. 329-343, 2017. https://doi.org/10.29019/enfoqueute.v8n1.139
L. Ramirez, “Diseño de una arquitectura para redes de sensores con soporte para aplicaciones de deteccion de eventos”, Ph.D. Dissertation, Universidad Politecnica de Valencia, Valencia, 2012.
National Instruments, “Sensor terminilogy”. [Online]. Available: https://www.ni.com/es-co/innovations/white-papers/13/sensor-terminology.html
Colmakers, “Colmakers”. [Online]. Available: https://www.colmakers.com/
National Instruments, “Niyantra Documents”. [Online]. Available: https://forums.ni.com/t5/NIYANTRA-Documents/NIYANTRA-2013-REMOTE-MONITORING-AND-AUTOMIZED-CONTROL-SYSTEM-FOR/ta-p/3498027?profile.language=es
Ubidots, “Ubidots”. [Online]. Available: https://ubidots.com/platform/
Bigml, “Bigml”. [Online]. Available: https://bigml.com/features
L. Igual and S. Segui, Introduction to Data Science. Barcelona: Springer, 2017. https://doi.org/10.1007/978-3-319-50017-1
J. C. Garcia, H. E. Posada, and F. A. Salazar, “Factores de produccion que influyen en la respuesta de genotipos de coffea arabica L. bajo diversas condiciones ambientales en Colombia”, Cenicafe, vol. 2, no 66, pp. 30-57, 2015. https://www.cenicafe.org/es/publications/3.Factores.pdf
J. Arcila, “Factores que determinan la productividad del cafetal”, in Sistemas de produccion de cafe en Colombia. Chinchina: Cenicafe, 2007, pp. 62-86.
V. H. Ramírez, “Avances en la medicion del suelo in situ”, Investigaciones de Unisarc, vol. 4, no. 1, pp. 27-34, 2006.
A. Herron, “Producción del café en zonas no tradicionales”. [Online]. Available: https://www.urosario.
edu.co/Mision-Cafetera/Archivos/Zonas-no-tradcionales-antonio-Herron.pdf
How to Cite
APA
ACM
ACS
ABNT
Chicago
Harvard
IEEE
MLA
Turabian
Vancouver
Download Citation
Recibido: 30 de abril de 2020; Revisión recibida: 6 de agosto de 2020; Aceptado: 18 de agosto de 2020
Abstract
Context:
The collection and storage of data on environmental variables in a coffee crop, through wireless sensor networks allow the transformation of said data and the application of a supervised learning model to establish its behavior.
Method:
For the present work, an architecture of 3 wireless sensor nodes was developed. Each node consists of a Lucy3 programmable card, to which the temperature, environmental humidity, and soil moisture sensors were connected. The measurement terrain is located in El Cortijo coffee farm. Measurements were made over a period of two weeks, three hours a day, sending the information from the nodes described above to a gateway that then transmitted the information to a base station. Finally, the data was loaded on an online platform for transformation and predictive analytics through a supervised learning model.
Results:
The tests allowed demonstrating the effectiveness of the design of the wireless network in the collection and transmission of data. It was later found that the application of the supervised learning model through the analysis of classification with decision trees allowed predicting the behavior of the variables, which were evaluated in specific time frames and conditions.
Conclusions:
By applying predictive models, the conditions of the crop can be improved, allowing the yield of the analyzed variables to be optimized, thus minimizing the loss of resources and improving the efficiency of processes such as sowing and harvesting the grain.
Keywords:
wireless sensor network, supervised learning model, precision agriculture, decision trees.Resumen
Contexto:
La recolección y almacenamiento de datos sobre variables medioambientales en un cultivo de café mediante el uso de redes inalámbricas de sensores permiten transformar dichos datos y aplicar un modelo de aprendizaje supervisado para establecer su comportamiento.
Método:
Para el presente trabajo, se desarrolló una arquitectura con 3 nodos sensores inalámbricos. Cada uno consistía en una tarjeta programable Lucy3, a la cual se conectaron sensores de temperatura, humedad ambiental y humedad del suelo. El terreno de medición se encuentra ubicado en la finca de café El Cortijo, y las mediciones se realizaron durante un período de dos semanas, tres horas al día, enviando la información de los nodos descritos anteriormente a un Gateway que luego transmitió la información a una estación base. Finalmente, los datos se cargaron en una plataforma en línea para transformación y análisis predictivo a través de un modelo de aprendizaje supervisado.
Resultados:
Las pruebas realizadas permitieron demostrar la efectividad del diseño de la red inalámbrica en la recolección y transmisión de datos. Además se encontró que la aplicación del modelo de aprendizaje supervisado a través del análisis de clasificación con árboles de decisión permitió predecir el comportamiento de las variables evaluadas en plazos y condiciones específicas.
Conclusiones:
Mediante la aplicación de modelos predictivos se pueden mejorar las condiciones del cultivo, lo que permite optimizar el rendimiento de las variables analizadas, minimizar la pérdida de recursos y mejorar la eficiencia de procesos como la siembra y la cosecha del grano.
Palabras clave:
redes de sensores inalámbricos, modelos de aprendizaje supervisado, agricultura de precisión, árbol de decisión..Introduction
Farming has been established as one of the areas where wireless sensor networks (WSN) have been implemented with great acceptance and success.
This kind of technology aids in the reduction of water consumption and the use of pesticides and fertilizers, as well as favoring the preservation of ecosystem. Additionally, it allows generating alerts about the arrival of frost, floods, fires, etc. Precision agriculture covers multiple practices related to the management of crops, trees, flowers, plants, livestock, among others [1]. In this sense, an important agricultural sector in our country, such as coffee, can work closely with technology and provide a new vision and projection towards agricultural productivity. On the other hand, it can generate innumerable benefits destined to increase the performance of production processes and optimize the final result of the harvested products.
Among the most interesting applications of precision agriculture is pest and disease control. By means of strategically located sensors, a number of parameters can be monitored, such as temperature, relative humidity, soil moisture, leaf temperature and humidity, and solar radiation, among others, in order to quickly detect adverse situations and establish early treatments. The great advantage of using this technology is early detection and the optimal application of pesticides only in areas where it is really necessary [2].
However, like all crops, coffee is exposed to a set of environmental variables such as temperature, soild type, air humidity, rain, and the wind index, in addition to pests such as the drill bit and rust, which end up affecting grain quality and production [3].
Colombia is known for producing the best soft coffee in the world. One of the statistics that most worries coffee growers and the guilds in charge of their commercialization are grain exports. If you look at the last year in coffee production (as of March, 2020), Colombia reached 14.3 million bags. Likewise, The Federation’s statistics show that when comparing the periods from October, 2018 to March, 2019 with October, 2019 to March, 2020, which corresponds to a section of the coffee year, the harvest is 6% higher. “From the point of view of the price of coffee, we are in a historical moment, but with some important challenges in the harvest, which implies what will come in the future on the subject of coffee with the arrival of this pandemic”, Added Vélez, who stressed that, in the midst of the quarantine, the consumption of this product in Colombian households has increased by 25% [4].
Currently, with information and communication technologies, significant advances have been made in the collection, analysis and distribution of information related to the state of the weather, monitoring of environmental variables, and biodiversity studies, among others. This information has different purposes, such as the digital preservation of data, its graphic representation, and the modeling of weather patterns. Some initiatives focus on improving the people’s quality of life by obtaining and estimating factors that affect the human environment, for example, infrastructure and transportation, agriculture, and data on the biodiversity of the observed site, among others [5].
That is why there are innumerable drawbacks when optimizing harvesting and production processes, since this sector has not received the necessary attention for many years. Our country has great agricultural potential, but government support is scarce or nonexistent, in addition to other factors such as the high price of inputs and fertilizers and the high rates at which money is lent to coffee growers. These conditions end up discouraging investment in grain harvesting and cultivation processes. Therefore, it becomes evident that, with the rise of new technologies, industrial processes in fields such as agriculture can be improved and automated.
Taking the landscape described above as reference, a collection of data on the main environmental variables that are significant in the cultivation of coffee in a specific land area is proposed. This is carried out by means of a wireless sensor network (WSN Through a wireless sensor network (WSN). Then, later said data will be uploaded to a cloud computing platform (Ubidots), where the data sent by the sensor nodes will be received. As a final stage, the data will be uploaded through CSV files generated by Ubidots to the BigML platform, where a supervised learning model will be applied to evaluate said information using decision trees. This valuable information will allow coffee growers to establish and predict the behavior of environmental variables such as temperature, soil moisture, and relative humidity, in order to make decisions regarding the allowed parameters vs. the collected information, in addition to considering said information as danger factors in the development of diseases or factors that represent hazards to crops and that have a direct impact on processes like harvesting and the preservation of natural resources.
Materials and methods
Research methodology
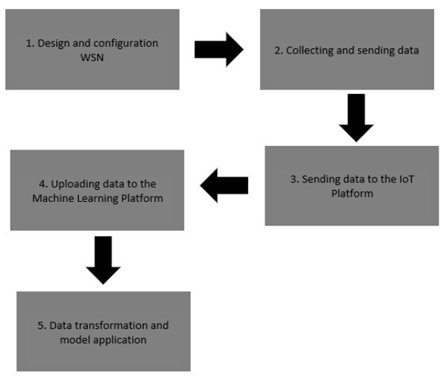
For the development of this research, the following phases have been proposed:
-
Design and configuration of the WSN: In this phase, the logical and physical design of the sensor network is carried out. In the logical design phase, the network design is designed according to the selected topology, a star, in this case, since it is the most efficient topology with a fast implementation speed. Next, in the physical design phase, each of the devices will be located in their designated place. Finally, the configuration of each of the sensor nodes with their respective measurement and communication elements is carried out; the Gateway and the base station are configured to act as intermediaries between the data sent by the sensors and the cloud platform.
-
Collecting and sending data: The data collection tests will be carried out through the different nodes and its sensors. The data is then sent to the Gateway and from there to the base station. Thus, the continuity of the information and the appropriate format are verified.
-
Sending data to the IoT platform: The data is sent from the base station to the Ubidots platform.
-
Uploading data to the Machine Learning Platform: Once the data is uploaded to the Ubidots platform, a CVS file is downloaded which contains the information sent by the sensor nodes. This file is uploaded to the BigML machine learning platform, and it will be our input for data analysis phase.
-
Data transformation and model application: Once the CSV file is loaded on the BigML platform, the dataset is created. Then, a field is taken as a pivot to serve as reference for the model, and the supervised model is applied through classification with decision trees. The model is then launched, and the confidence percentage associated with the predictive model is evaluated. Finally, we determine whether the model meets the initial expectations. Fig. 1 shows the phases in which the research has been structured.
Figure 1: Phases of the research proposed for the development of the project
Architectural design of the system
A WSN is a network consisting of distributed autonomous devices, which uses different kinds of sensors to monitor physical or environmental conditions. This kind of system incorporates a Gateway, which provides wireless connectivity as a complement of wired networks and distributed nodes. The selected wireless protocol depends on the application requirements. Some of the available standards include 2,4 GHz radios based on IEEE 802.15.4 or IEEE 802.11 (Wi-Fi) standards or proprietary radios, which are regularly 900 MHz [6].
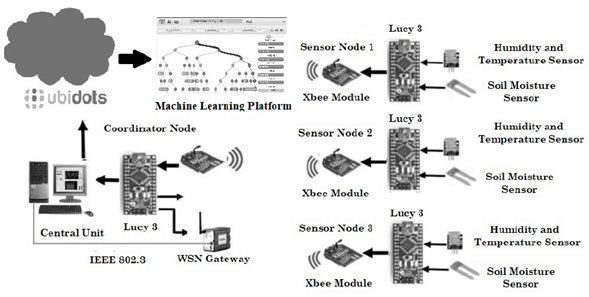
The proposed architecture for the development of the WSN system consists of three sensor nodes [7], each consisting of a Lucy 3 programmable card, connected to temperature, environmental humidity, and soil humidity sensors. These nodes is at a distance of 100 m from each other, covering a total area of 300 m2 of coffee cultivation. The nodes also communicate wirelessly through the ZigBee protocol with the Xbee modules. The architecture of the proposed system can be seen in Fig. 2
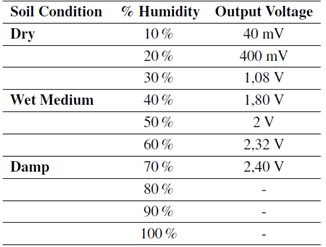
The Gateway is responsible for coordinating and communicating the sensor nodes with the base station through the 802.3 standard. Finally, the data collected by the sensors is sent to a central unit or base, where it will then be uploaded to the cloud platform (Ubidots), which is in charge of receiving the information from the base station to store and processing it. Subsequently, a CSV file is downloaded from the platform. This input is uploaded to the BigML platform, where it will go to the information analysis phase and the application of the supervised learning model, which will allow decision-making regarding the behavior of the environmental variables in the crop and their respective corrective measures. Table I shows the different measurement ranges of the TEGR-101 soil moisture sensor [8].
Table I: Dryness or humidity conditions measured by the TEGR-101 soil moisture sensor.
For the communication section between sensor nodes and the Gateway, we found several standards that meet the necessary characteristics and conditions, but the ZigBee 802.15.4 protocol or standard was selected, mostly due to economic factors. The ZigBee Alliance (ZigBee Alliance) [9] consists of an association of industries that work together to develop standards and products. ZigBee is the name of the specification for a set of high-level wireless communication protocols for use in low-consumption digital broadcasting applications based on the IEEE 802.15.4 standard for wireless personal area networks Network or WPAN). ZigBee technology is integrated into a wide range of products and applications for commercial, industrial, and government consumers.
The implementation of the WSN will be carried out in a 300 m2 area of a coffee crop in El Cortijo farm, located in the town of Pueblo Tapao, a district of Armenia (Quindío). Table II shows the description and physical characteristics of the terrain.
Table II: Physical description of the farmland.

Internet of things and machine learning platforms
For the development of this research we used two Internet platforms with different purposes:
-
Ubidots, an Internet of Things (IoT) platform in charge of managing the information received by each of the sensor nodes.
-
The BigML platform, a machine learning platform, in charge of receiving the data in a CSV file, transforming the loaded data into its own DataSet for a subsequent analysis through the application of a supervised model, namely a classification model based on decision trees.
Ubidots (IoT platform)
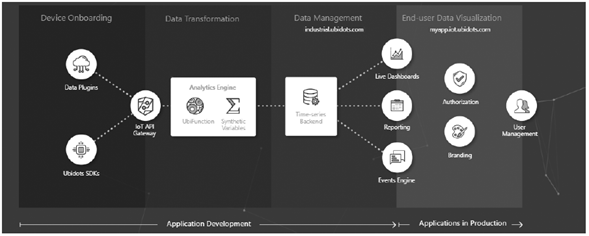
Ubidots is a production-ready cloud for data collection, analysis, and visualization. This platform has advantages that make it stand out from the rest. Among the main features, there is an API and protocols that can be connected from any hardware to the Ubidots cloud through HTTP, MQTT, TCP, UDP or Parse (custom protocol).
Regarding the presentation board, data can be analyzed in real time because the platform creates pictures. Therefore, the devices and the information they collect can be controlled. Additionally, the platform has a user management feature, which helps organize permissions and restrictions depending on the operator or end user. Other features are sensor communication (input/output), API creation, extended monitoring, and data analysis of API applications of all kinds. On the other hand, its data storage depends on the acquired plan, back-end possibilities, and daily visualization of the stored data. The data output is called scheduled reports and is delivered in PDF or Excel formats. A delivery can be scheduled for anyone who needs it. In Fig. 3, the different services offered by the Ubidots platform are shown [10].
Figure 3: Services offered by the Ubidots platform.
BigML platform
This working environment offers a platform to build and share datasets and models in the form of machine learning as a service (MLaaS). Consequently, BigML is a proposal to make machine learning understandable to users.
BigML manages to exploit the benefits of existing cloud solutions. For example, it allows data import from AWS S3, MS Azure, Google Storage, Google Drive, Dropbox, etc., which benefits developers because public cloud infrastructures could have become a basic need, that is to say, a solution for the providers of various services.
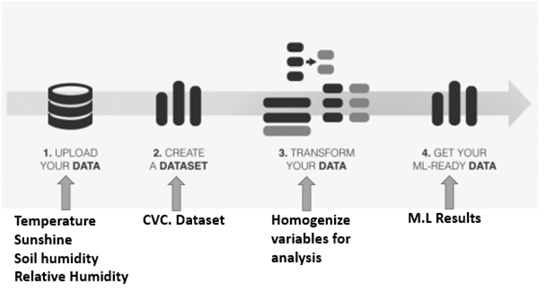
Also, as it is solely focused on machine learning, BigML offers a comprehensive set of features, all well integrated within an interface where the user can load datasets, train and evaluate models, and generate new predictions, one by one or in batches. It contains a wide gallery of datasets and free models to probe, organized in categories, in addition to being accessible to the public. It also contains algorithms for Educational Clues, as well as grouping and selection to create high-quality models [11]. In Fig. 4 the data transformation process can be observed.
Figure 4: Process of loading and transforming data on the BigML
Machine learning models
Machine learning [12] involves coding models that automatically adjust performance to agree with the presented data. This kind of learning is achieved through a model where the parameters are automatically adjusted according to certain performance criteria. Machine learning can be considered a subfield of artificial intelligence (AI), and it can be classified into the following application models:
-
Supervised learning: it consists of algorithms that learn from a set of training examples, to generalize and label all possible inputs to the set. As technical examples in supervised learning, we have logistic regression, support vector machines, decision trees, random forest, etc.
-
Unsupervised learning: it consists of algorithms that learn from an unlabeled training set. Examples of this type of learning are used to explore data according to some statistical, geometric or similarity criteria. Unsupervised learning is present in k-media grouping, grouping, principal component analysis, association detector, anomalies, etc.
-
Reinforcement learning: it consists of algorithms that learn through the reinforcement of criticism. It provides information on the quality of a solution, but not on how to improve it. Improved solutions are achieved by iteratively exploring the solution space.
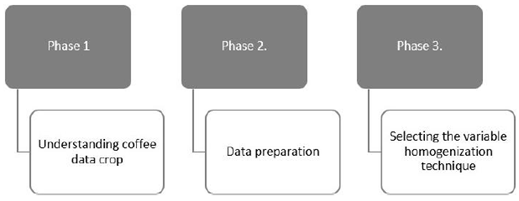
The following phases were applied in the project:
-
Data understanding: in this phase, the analysis of data from coffee cultivation was carried out, all the information was correlated with the experiences of coffee growers.
-
Data preparation: for this phase, it is important to review the data, refine it, find inconsistencies, create, and verify the variables that are repeated.
-
Selecting the variable homogenization technique: in this phase, the most important variables of the coffee crop to be measured were identified. In this case, some variables that are not easy to measure due to cost issues were discarded. One of the discarded variables was the PH measurement, despite its importance.
Figure 5: phases applied to the analysis of coffee cultivation data
In this section, it is important to mention that, among the different machine learning techniques, there are also other analysis tools such as neural networks, classification trees, support vector trees, and Bayesian classifiers, which are used to find useful information and make decisions.
Coffee and its environmental conditions
In this section, we intend to present a series of environmental variables that were taken as a reference for the present study. These variables are of great importance in the planting and cultivation of coffee, as well as in its future production:
1. Temperature
Optimal conditions: The optimal area for growing Arabica coffee is between 19 and 21,5 °C. Other conditions: In cold climates, where the average temperature is below 19 °C, its production is lower, and the harvest is distributed throughout the year. In hot climates, where the average temperature is higher than 21,5 °C, the productive life of coffee is shorter, and the harvest is earlier and more concentrated. Therefore, rust is more severe when it attacks, and there is an increase in pests such as the bit or the miner [13].
2. Sunshine and cloudiness
Optimal conditions: Colombia is close to the equator and therefore receives abundant solar radiation throughout year. The maximum values that reach the top of the atmosphere occur in March and September and are close to 432 Wm-2. The minimums are observed between December and January and are close to 384 Wm-2. Due to uneven terrain, there are regions that are exposed to sunlight than others. In mountainous regions, due to horizon restriction, the effective time of sunlight can be reduced by two hours or more. This happens, for example, in coffee regions located in deep valleys [14].
3. Soil humidity
Optimal conditions: Soil moisture is a function of the distribution of rainfall within the crop, planting density, leaf distribution, the evaporative demand of the atmosphere, the slope of the land, and the physical and hydraulic properties of the soil. Currently, a variety of techniques are available to measure soil moisture directly in the field, without the need to take soil samples and alter their properties [15]. In the coffee zone, organizations such as Cenicafé recommend a humidity of 75 to 85 %.
Other conditions: The pH (acidity) suitable for a good coffee crop must be between 5,0-6,0; a pH of less than 4,0 results in problems of Aluminum and Manganese toxicity and Calcium deficiencies. The crop must have adequate levels of Magnesium, Potassium, Sulfur, Boron, Copper, and Zinc.
4. Relative humidity
Optimal conditions: It is a component of the climate that measures the relationship between a completely watersaturated air and the amount of water vapor at a given moment. Relative humidity is expressed in terms of percentage. Coffee is a plant that grows well in environments with humidity above 75% without reaching full saturation. Harvesting in regions such as the coffee axis occurs in the months with the lowest relative humidity, which facilitates the handling of the grain [16].
Discussion and results
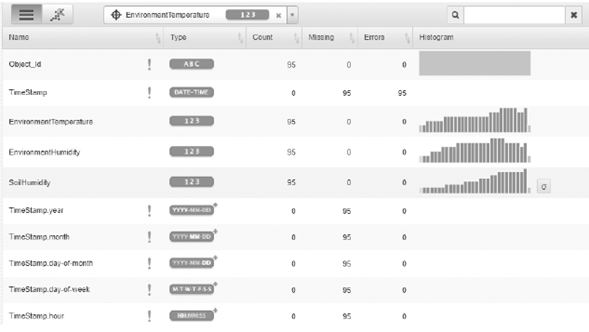
It was determined that the Lucy 3 programmable cards in each of the sensor nodes were programmed to receive the values sent by each of the sensors every 10 minutes, in order to send said data to the Gateway and from there to the station base. From there, the information was sent to the Ubidots platform, where the measured values were analyzed, and it was determined whether they were within the established ranges. Comparisons between the received values and the allowed ranges could be established to determine anomalous variations in said measurements. Distance tests were developed to determine the maximum range of the Xbee -Pro S2C wireless modules, to ensure reliable data transmission without loss and signal attenuation. It was thus found that the maximum range is within the established 100 m limit in open field. Fig. 6 shows the data from transmitted variables being measured through the Lucy 3 platform. This information is useful because it can determine if any data was lost or arrived without any error during the broadcast. We can see the DataSet loaded to the BigML platform to apply the supervised model.
Figure 6: dataset transformed on the BigML platform.
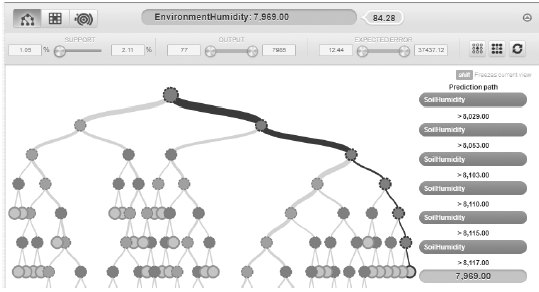
Applying the supervised model with classification through decision trees, we were able to establish that, as the environmental humidity increases, the number of instances decreases, and the soil humidity remains up to 79,69 %. In conclusion, if the humidity of the environment increases, the soil moisture tends to decrease. In Fig. 7, we can see a decision tree taking the environmental humidity variable as a pivot.
Figure 7: Environmental humidity taken as reference in a decision tree
By loading the data on the BigML platform, different learning models could be created that allowed us to delve into the analysis of variables such as temperature, ambient humidity, and soil moisture. In the same way, we were able to establish different evaluations and predictions, for example:
-
As the day progresses, the ambient temperature logically increases at specific time intervals, but the ambient humidity also decreases.
-
On the other hand, as the day passes, the environmental temperature has a greater influence on other variables such as temperature and humidity.
-
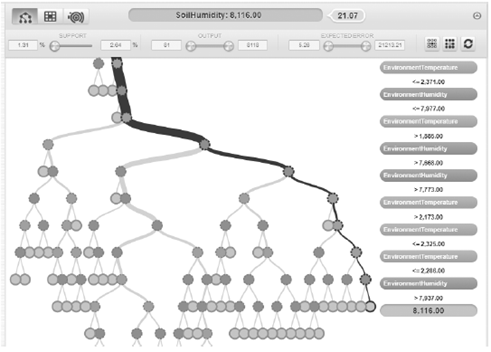
In another model, soil humidity was taken as a reference variable. It was found that, as the temperature and environmental humidity increase, the number of instances decreased, and soil humidity increased up to 81,16 %. In conclusion, the two previous variables are directly proportional to soil moisture, that is, a higher temperature and relative humidity produce drying out of the ground. In Fig 8, we can see a decision tree taking the soil moisture variable as a reference.
Figure 8: Soil moisture taken as reference in a decision tree.
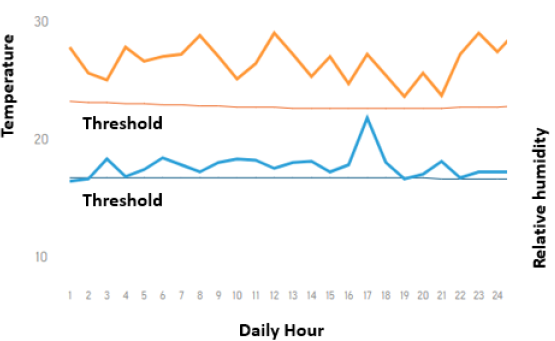
A training model was executed for the reference dataset, which was measured for 24 hours, as can be seen in Fig. 9. The measurements were made every 10 minutes and an average of 6 measurements was obtained every hour. Once the appropriate parameter was determined by homogenizing the data, the percentages for temperature and relative humidity were compared. According to the ML training, it was found that the greater number of instances in the temperature variable indicates that, if the ambient temperature increases, then the relative humidity tends to decrease. This means that both variables are inversely proportional. Therefore, the system would indicate that it is necessary to water the crop, since the relative humidity must be over a 75 % threshold.
Figure 9: Measurement of temperature and relative humidity for training and decision making in a coffee crop
Conclusions
The design and configuration of the wireless sensor network met the initial expectations; there were no problems in collecting and transmitting data through the proposed hardware architecture. It could be established that, among the fundamental factors in coffee crops, there is the quality of the soil where the crop is planted, which depends on the growth rate and development of the tree, the start of production, the quantity and quality of the itself, resistance to attack by pests and diseases, and the duration of its productive life.
It was established that the same problem can be treated with different models of supervised learning. There are combinations of decision trees, such as the assembly of repeated samples and random decision forests that can improve the results. Another type of model called logistic regression can also be used for the classification problem. The minimum and maximum parameters to be reached for each of the variables such as temperature, environmental humidity, and soil humidity were established on the Internet of Things platform (Ubidots) in order to compare them with the measurements sent by the node sensors.
Temperature, relative humidity, and soil moisture were found to be variables of great importance in coffee cultivation. On the other hand, through the construction of supervised learning models, periods of time where the temperature decreases or increases could be evinced, which allows optimizing processes such as irrigation. Various supervised machine learning models were built with the purpose of evaluating the behavior of the aforementioned variables. There were two models: one predictive and the other evaluative. Thereupon, comparisons could be made based on previously defined patterns.
References
License
Copyright (c) 2020 William Ruiz Martinez, Roberto Ferro Escobar, Javier Moncada

This work is licensed under a Creative Commons Attribution-NonCommercial-ShareAlike 4.0 International License.
From the edition of the V23N3 of year 2018 forward, the Creative Commons License "Attribution-Non-Commercial - No Derivative Works " is changed to the following:
Attribution - Non-Commercial - Share the same: this license allows others to distribute, remix, retouch, and create from your work in a non-commercial way, as long as they give you credit and license their new creations under the same conditions.




2.jpg)
