DOI:
https://doi.org/10.14483/23448393.22136Published:
2024-09-19Issue:
Vol. 29 No. 3 (2024): September-DecemberSection:
Environmental EngineeringLightning Occurrence between 2016 and 2020 in Fusagasugá, Cundinamarca, Colombia
Ocurrencia de rayos entre 2016 y 2020 en Fusagasugá, Cundinamarca, Colombia
Keywords:
Lightning, flashes, climatology, lightning location (en).Keywords:
rayos, descargas atmosféricas, climatología, localizacion de rayos (es).Downloads
References
J. R. Dwyer and M. a. Uman, “The physics of lightning,” Physics Reports, vol. 534, pp. 147–241, 10 2013. [Online]. Available: http://linkinghub.elsevier.com/retrieve/pii/S037015731300375X
J. Inampués, D. Aranguren, A. Cruz, J. Gonzalez, H. Torres, and H. D. Betz, “Severe thunderstorms in the colombia and venezuela high lightning active areas,” 2017 International Symposium on Lightning Protection, XIV SIPDA 2017, pp. 359–364, 2017.
V. B. S. Silva and V. E., The South American Monsoon System: Climatology and Variability, 2012.
D. Aranguren, J. López, J. Inampués, H. Torres, and H. D. Betz, “Cloud-to-ground ligthning activity in colombia and the influence of topography,” Journal of Atmospheric and Solar-Terrestrial Physics, vol. 154, pp. 1850–1855, 2014. [Online]. Available: http://dx.doi.org/10.1016/j.jastp.2016.08.010
I. Hoyos, F. Dominguez, J. Cañón-Barriga, J. A. Martínez, R. Nieto, L. Gimeno, and P. A. Dirmeyer, “Moisture origin and transport processes in colombia, northern south america,” Climate Dynamics, vol. 50, pp. 971–990, 2018.
S. Soula, J. K. Kasereka, J. F. Georgis, and C. Barthe, “Lightning climatology in the congo basin,” Atmospheric Research, vol. 178-179, pp. 304–319, 2016. [Online]. Available: http://dx.doi.org/10.1016/j.atmosres.2016.04.006
U. Sonnadara, W. Jayawardena, and M. Fernando, “Climatology of lightning flash activities over sri lanka,” Theoretical and Applied Climatology, 2018.
Y. Kuleshov, Thunderstorm and Lightning Climatology of Australia, 2012.
D. J. Cecil, D. E. Buechler, and R. J. Blakeslee, “Trmm lis climatology of thunderstorm occurrence and conditional lightning flash rates,” Journal of Climate, vol. 28, pp. 6536–6547, 2015.
D. Aranguren, J. Lopez, J. Montanyà, and H. Torres, “Natural observatories for lightning research in colombia,” 2018, pp. 279–283.
B. S. A. Murillo, E. A. S. Ríos, and K. A. V. López, “Actividad de rayos en el departamento de santander entre 2014 y 2016,” Ingeniería, vol. 26, pp. 419–435, 1 2022.
D. J. Cecil, D. E. Buechler, and R. J. Blakeslee, “Gridded lightning climatology from trmm-lis and otd: Dataset description,” Atmospheric Research, vol. 135-136, pp. 404–414, 2014. [Online]. Available: http://dx.doi.org/10.1016/j.atmosres.2012.06.028
J. Herrera, C. Younes, and L. Porras, “Cloud-to-ground lightning activity in colombia: A 14-year study using lightning location system data,” Atmospheric Research, vol. 203, pp. 164–174, 2018. [Online]. Available: https://doi.org/10.1016/j.atmosres.2017.12.009
L. D. Tarabukina and V. I. Kozlov, “Climatology of lightning activity in northern asia in 2009-2016,” 2017, pp. 1–7.
F. Diaz, D. Ortiz, and F. Roman, “Lightning climatology in colombia,” Theoretical and Applied Climatology, 2022. [Online]. Available: https://doi.org/10.1007/s00704-022-04012-9
N. Hoyos, J. Escobar, J. C. Restrepo, A. M. Arango, and J. C. Ortiz, “Impact of the 2010-2011 la niña phenomenon in colombia, south america: The human toll of an extreme weather event,” Applied Geography, vol. 39, pp. 16–25, 2013. [Online]. Available: http:
//dx.doi.org/10.1016/j.apgeog.2012.11.018
How to Cite
APA
ACM
ACS
ABNT
Chicago
Harvard
IEEE
MLA
Turabian
Vancouver
Download Citation
Recibido: 7 de mayo de 2024; Aceptado: 30 de julio de 2024
Abstract
Context:
Lightning is a powerful natural phenomenon that poses a risk to life and infrastructure, given the enormous amounts of energy it can transfer in short periods of time, especially in cloud-to-ground strikes. Since lightning requires specific meteorological conditions for its generation, its occurrence is often influenced by conditions such as topography, rainfall, and wind patterns. Therefore, having information about lightning occurrences in a region is crucial for comprehensive risk management against this extreme natural phenomenon.
Methods:
In this study, we implemented a methodology based on knowledge discovery in databases (KDD) to analyze and visualize data provided by Vaisalas’s GLD360 lightning location network.
Results:
The results indicate that, in Fusagasugá, Cundinamarca, there are two lightning activity peaks: one in the first half of the year (March) and another in the second half (October). Lightning events are most frequent during the afternoon, with a peak around 5:00 p.m. (local time). Additionally, most lightning events occur in two areas with low population density, covering 25 % of the territory and ranging from 500 to 1000 meters above sea level.
Conclusions:
These findings highlight the importance of preciseknowledge regarding the location of lightning events for planning prevention and risk management. In this case, efforts and resources should primarily focus on a small proportion of the municipality to substantially impact the population and infrastructure.
Keywords:
lightning, atmospheric electrical discharge, climatology, lightning location.Resumen
Contexto:
Los rayos son un fenómeno natural poderoso que representa un riesgo para la vida y la infraestructura, pues puede transferir enormes cantidades de energía en cortos periodos de tiempo, especialmente en descargas nube-tierra. Dado que los rayos requieren condiciones meteorológicas específicas para su generación, su ocurrencia suele estar influenciada por factores como la topografía, la precipitación y los patrones de viento. Por lo tanto, contar con información sobre la ocurrencia de rayos en una región es crucial para una gestión integral del riesgo frente a este fenómeno natural extremo. Métodos: En este estudio se implementó una metodología basada en la extracción de conocimiento en bases de datos (KDD) para analizar y visualizar los datos proporcionados por la red de localización de rayos GLD360 de Vaisala.
Resultados:
Los resultados indican que, en Fusagasugá, Cundinamarca, existen dos picos de actividad de rayos: uno en la primera mitad del año (marzo) y otro en la segunda mitad (octubre). Los eventos de rayos son más frecuentes durante la tarde, con un pico alrededor de las 5:00 p.m. (hora local). Además, la mayoría de los eventos de rayos ocurren en dos áreas con baja densidad poblacional, que cubren el 25 % del territorio y se encuentran a una altitud de entre 500 y 1000 metros sobre el nivel del mar.
Conclusiones:
Estos hallazgos destacan la importancia de contar con un conocimiento preciso sobre la ubicación de los eventos de rayos para la planificación de la prevención y la gestión del riesgo. En este caso, los esfuerzos y recursos deben centrarse principalmente en una pequeña proporción del municipio para tener un impacto sustancial en la población y la infraestructura.
Palabras clave:
rayos, descargas eléctricas atmosféricas, climatología, localización de rayos.Introduction
Atmospheric electrical discharges, commonly known as lightning, are intense natural phenomena originating within storm clouds 1. Lightning flashes are the optical manifestation of a lightning strike, while thunder is the acoustic counterpart. Most lightning occurs within storm clouds, with only a small percentage striking between the clouds and the ground. However, in regions with intense electrical activity, cloud-to-ground lightning strikes can pose significant risks to infrastructure and life 2.
The occurrence of lightning is neither uniform in time nor space and depends on factors such as the variability of rainfall patterns 3, moisture transport due to wind regimes 4, and particular topographical features 5. Regions like the Congo River basin 6 and northern South America are known for their intense lightning activity 7. This includes parts of the Andean region, the Colombian Caribbean region, and the Maracaibo Lake region in Venezuela, where lightning activity is notably higher than the global average 8) (9.
Lightning data are obtained from measurement stations located at ground level or on satellite platforms 10. Since lightning occurs within storm clouds, the electromagnetic fields generated by the clouds’ electrical activity are usually measured. Stations detect variations in the electric and magnetic fields caused by each discharge, known as strokes. A lightning flash generally consists of one or more strokes, a phenomenon dubbed lightning multiplicity11.
Measurement stations are often part of lightning observation networks, with some offering free access to databases with information about lightning strike locations and electrical parameters. This information is crucial for studying the specifics of lightning’s electrical parameters and apparent occurrence patterns 12. The latter focuses on the time and location of lightning occurrences, which is essential for designing lightning risk management plans and warning against extreme weather events.
This work sought to determine the lightning climatology of Fusagasugá, Cundinamarca, given the lack of detailed studies in the area. This municipality, with over 150 000, inhabitants is located 60 km from the city of Bogotá and settled on uneven terrain at around 1700 meters above sea level. This study aims to contribute to scientific knowledge and provide relevant information for local authorities involved in prevention and risk management.
Most of the electrical activity in storm clouds occurs internally, so obtaining optical records is challenging. Therefore, almost all lightning detection systems rely on observing variations in ambient electric and magnetic fields. Electric field and loop antennas are commonly used for this purpose. To determine the impact point of a lightning strike, simultaneous measurements from multiple antennas are necessary, to verify the discharge and establish its coordinates. Over time, several regional, national, and global networks have recorded lightning activity. The World Wide Lightning Location Network (WWLLN), an academic initiative, is widely used in several lightning climatology studies. Moreover, the GLD360 lightning location network, managed by Finnish company Vaisala, utilizes magnetic field sensors and the time-of-arrival (TOA) method for lightning location.
Technological advancements have enabled the study of storm cloud electrical activity from satellite platforms, sometimes using adapted versions of ground sensors. However, the primary focus is detecting light emissions from the top of the cloud, as is the case of the Tropical Rainfall Measuring Mission/Lightning Imaging Sensor (TRMM/LIS) project and the Geostationary Lightning Mapper (GLM). Combined, these lightning location networks have facilitated the creation of lightning climatologies, which are crucial for evaluating and managing the risks that lightning poses to populations and infrastructure.
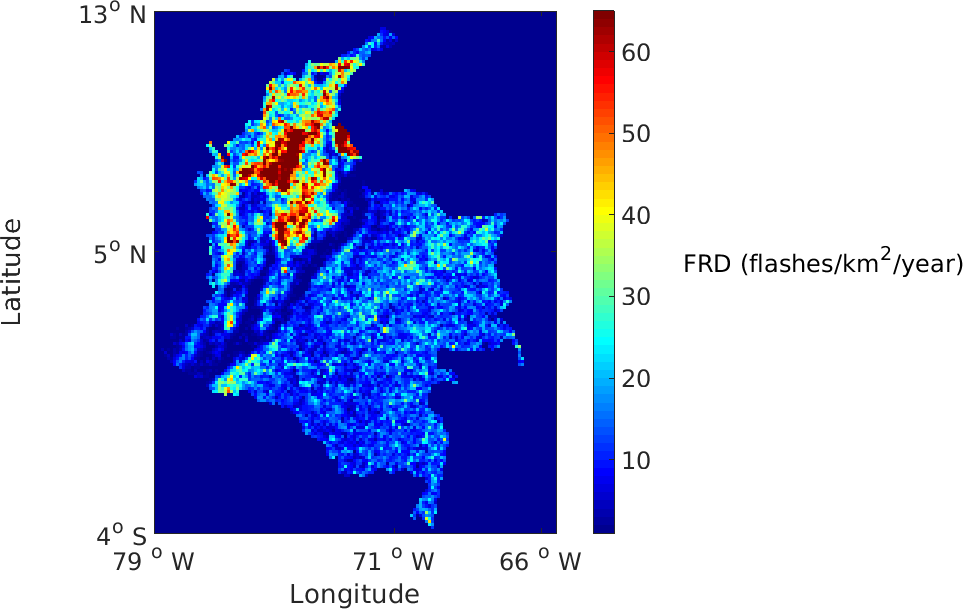
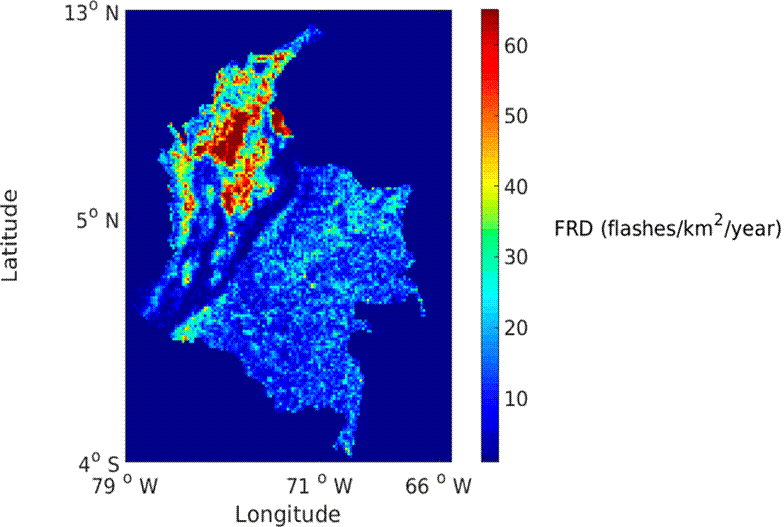
Some studies have identified regions with electrical activity above the global average in South China 13, the Congo River basin 6, and northern Asia 12. Other studies have examined national climatologies in places like Sri Lanka 14, South Africa 15, Poland 16, Bangladesh 17, and Australia 18. Studies in Colombia have focused on identifying spatial and temporal patterns across the country, as seen in (19, 20). Regional patterns have also been analyzed, such as those in the north of Colombia (2, 21) and the department of Santander 22. All cited studies agree on identifying intense lightning activity, particularly concentrated in the middle basin of the Magdalena River and the Momposina Depression. As an example, Fig. 1 illustrates 17 years of satellite observations (TRMM/LIS), highlighting areas with the highest electrical activity.
Figure 1: 17 years of satellite observations of lightning over Colombia from TRMM/LIS. Adapted from: 20
Noteworthy studies analyzing fatalities due to lightning strikes in Colombia include publications by 23, 24, and 25. Additionally, works related to risk analysis regarding lightning strikes can be found in 26, 27, 28, and 29.
Methodology
The lightning location data used in this study were recorded by Vaisala’s GLD360 network, which provided the authors with a database containing approximately 80 million records from the central region of Colombia, as observed from January 1, 2016, to December 31, 2020. These data correspond to a circular area with a radius of approximately 500 km centered on Bogotá, covering about 700 000 square kilometers of Colombian territory. In Vaisala’s GLD360 network, each in-cloud or cloud-to-ground stroke is counted as one lightning event. However, confusion can arise due to the terminology used in recording lightning data. As noted by (30, p. 2): "GLD360 does not classify events between CG strokes and IC pulses; all events are labeled CG strokes".
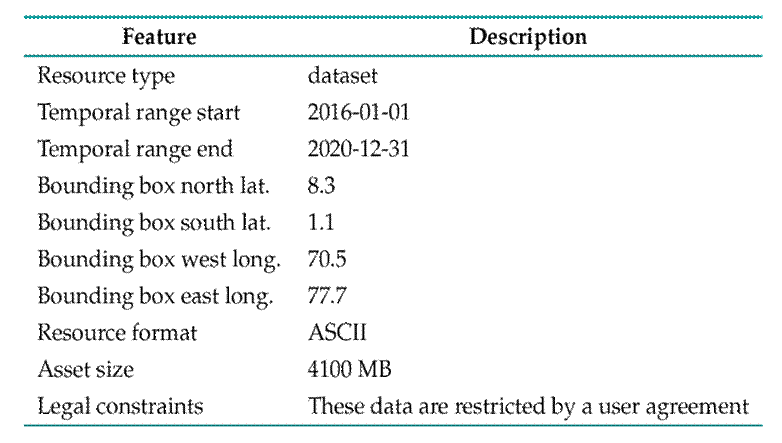
The GLD360 network provides lightning data with a detection efficiency of approximately 80 %, and a median location accuracy between 1.5 and 2.5 km, depending on various landscape factors. The dataset contains nearly 80 million tuples, each recording the date, time, latitude, longitude, and peak current, with a sign indicating the estimated discharge polarity. Additional details of the dataset are summarized in Table I.
Table I: Dataset description
The methodology for determining lightning incidence patterns in Fusagasugá consisted of two stages, each focusing on different but complementary aspects of data analysis. In the first stage, Power BI was used to pre-process the database, cleaning and filtering the information relevant to the municipality of Fusagasugá and eliminating duplicate or irrelevant records. Subsequently, geographic data transformation was carried out using ArcGIS, which offers advanced tools for spatial analysis and geographic information management.
In the second stage, the event occurrence rates in Fusagasugá from 2016 to 2020 were analyzed to identify temporal and geographic patterns. For the temporal analysis, the annual behavior of lightning activity from 2016 to 2020 was examined, using different time scales to determine monthly, daily, and hourly patterns. Geographically, the stroke occurrence was analyzed by rural districts (veredas), which allowed identifying the distribution of the atmospheric electrical activity within the municipal area.
The data analysis utilized the Tableau tool, given its usability, compatibility with web development, ease of integration with various data sources, and ability to create interactive visualizations. With this tool, three dashboards were developed: Stroke occurrence rates in Fusagasugá 2016-2020, Frequency of strokes throughout the day in Fusagasugá, and Intensity of strokes per rural district and year. Each dashboard presents the requested information, offering simple interaction with the presented elements.
Furthermore, a web version of the development was created, accessible through the following link: https://rayos-pi.vercel.app/ . This web version offers an interactive experience for users to explore the results.
Results
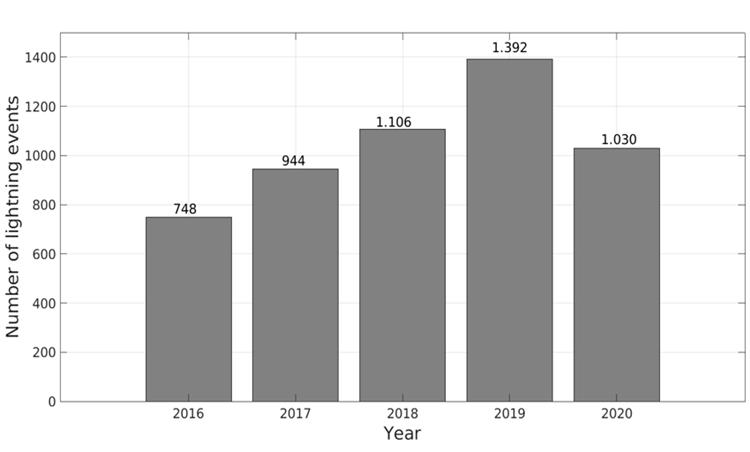
Fig. 2 illustrates the total number of lightning strokes recorded in Fusagasugá from January 1, 2016, to December 31, 2020. Over these 1827 days, 5220 strokes were recorded within the municipality’s territory. The graph depicts an apparent annual increase in lightning events, with a 26 % increase from 2016 to 2017, a 17 % increase from 2017 to 2018, and a 25 % surge from 2018 to 2019. However, this upward trend is interrupted by a 26 % reduction from 2019 to 2020.
Figure 2: Five years of ground-based lightning observations for Fusagasugá, Cundinamarca, Colombia
The year 2020 exhibited a lower annual lightning activity but reported peak activity in the first half of the year, much higher than that observed in the previous four years (Fig. 2). Although this study does not examine the relationship between lightning activity and other meteorological phenomena, the decrease in activity observed in 2020 may be related to the weakening of the final phase of the La Niña phenomenon experienced between 2020 and 2021 16.
With the available data, we can estimate the density of lightning events per square kilometer per year (events/km 2 /year) in the municipality. Considering Fusagasugá’s area of approximately 204 km 2, the average is 5,1 events/km 2 /year, a value significantly lower than the departmental average of 22 events/km 2 /year and the national average of 30 events/km 2 /year. It is important to note that the data provided by lightning location systems (LLS) have a detection efficiency (DE) lower than 100 %, implying that some strokes, especially weaker ones, are not detected. Therefore, these results should be seen as indicative of lightning activity rather than as a precise measurement.
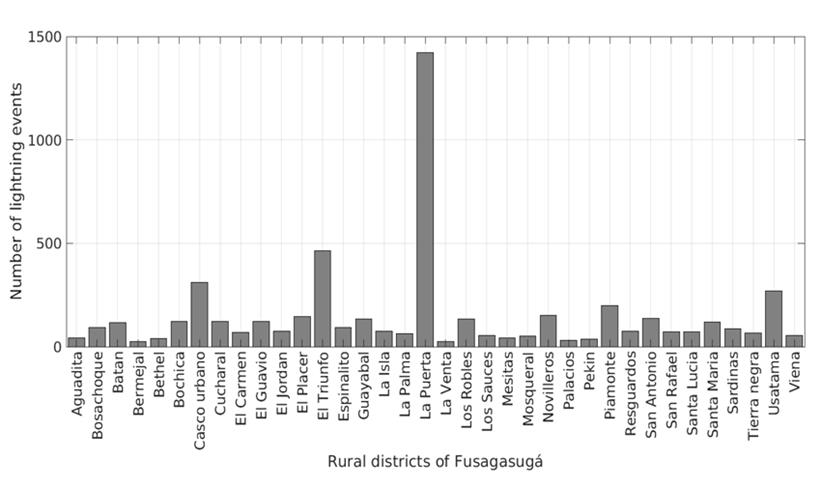
Fusagasugá exhibits diverse topography and altitude, with approximately 21 % of its territory being flat, 37 % undulating, and 42 % mountainous, ranging from 500 to 3000 meters above sea level. The data were segmented by rural district using developed software, aiming to determine the distribution of lightning activity within the municipality (Fig. 3). Notably, lightning activity is predominantly concentrated in the rural district of La Puerta, characterized by a low population density and an average altitude of 1000 meters above sea level. This area encompasses the populated center of Chinauta, situated on a flat land extension between the Cuja River canyon and the Chocho River canyon. El Triunfo, the second rural district with the highest activity, shares a border with La Puerta and has a lower altitude, spanning between Alto de Canecas and Boquerón, bordering the municipalities of Pandi and Icononzo in the department of Tolima. Together, these two rural districts contribute to over 36 % of municipality’s lightning activity while covering less than 25 % of the territory.
Figure 3: Lightning events in Fusagasugá, ordered by rural district
Due to the lack of official information on the rural districts’ extensions, data from the corregimientos (i.e., townships) were utilized. Corregimientos are larger rural divisions comprising several rural districts. Fusagasugá is divided into five administrative divisions: North (seven rural districts), East (six rural districts), West (six rural districts), Southwest (six rural districts), and Southeast (ten rural districts), along with the urban center. Lightning event densities were calculated using the territorial extension of each corregimiento, and the available lightning event data per rural district. The northern administrative division showed a density of 3.9 events/km 2 /year, the eastern reported 3.7 events/km 2 /year, the western exhibited 4.6 events/km 2 /year, and the southeastern indicated 2.9 events/km 2 /year. Remarkably, the southeastern region exhibited the highest activity density (9.4 events/km 2 /year), significantly surpassing the averages of the municipality and the other administrative divisions, highlighting the need for special attention from risk management entities in this area.
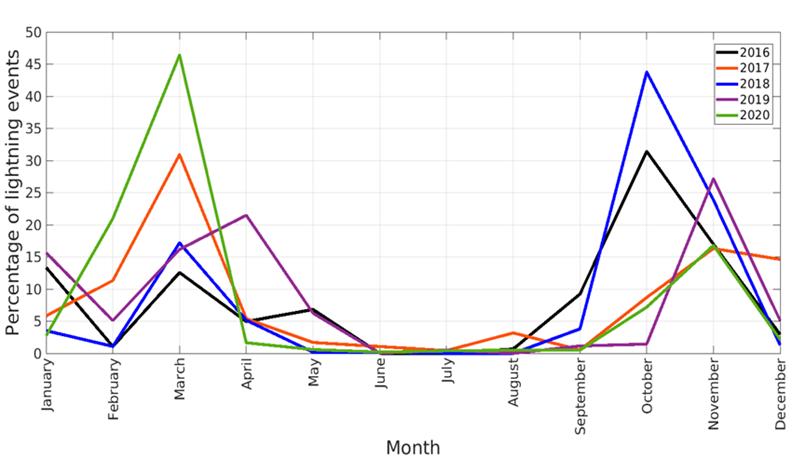
Fig. 4 details the occurrence of lightning events in Fusagasugá, providing insight into the months with the highest activity in the municipality. By plotting data from the five-year observation period, it becomes apparent that lightning activity in Fusagasugá follows a bimodal pattern, characterized by peaks in two distinct periods: one in the first semester (March) and another in the second semester (October-November). This bimodal behavior arises from the pronounced transition between these two activity peaks, aligning with the typically drier season in the middle of the year, when lightning activity decreases.
Figure 4: Monthly pattern of occurrence for lightning activity in Fusagasugá
In the observed years, 2017 and 2020 exhibited more intense lightning activity in the first semester, whereas the other three years showed higher activity in the second semester (2016, 2018, and 2019). This variance may be attributed to the prevailing rainfall patterns during those periods.
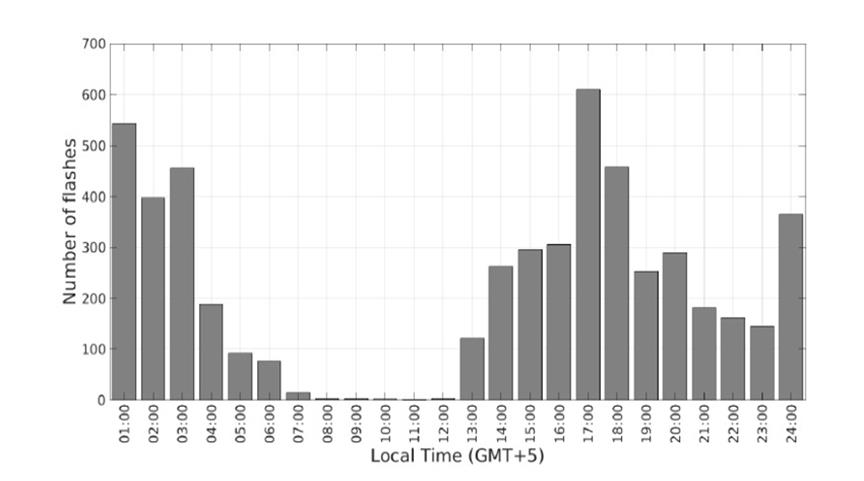
To determine the timing of lightning occurrences in Fusagasugá, five years of data were filtered and plotted by hour. As depicted in Fig. 5, the activity remains minimal during the morning hours and until noon. Subsequently, there is a gradual increase, with two peaks observed around 17:00 and 01:00 (local time, GMT+5).
Figure 5: Hourly pattern occurrence for lightning activity in Fusagasugá
When consolidating the results on monthly and hourly lightning occurrences in Fusagasugá, it becomes feasible to plan outdoor activities with reduced risk, considering the minimal likelihood of lightning during the morning hours in the middle of the year. Conversely, heightened activity is observed during the afternoon hours in March, October, and November. Nevertheless, it is essential to note that validating this preliminary conclusion requires extending the observation period to encompass additional years, aiming to confirm the identified patterns.
Discussion
Both lightning events and flash densities are generally estimated for larger areas, often at the country level or beyond. Examples of this approach can be found in works like (14) in Sri Lanka, (18) in Australia, (6) in the Congo River basin, and (15) in Southern Africa. The problem with this method is that it provides mean values that may not accurately represent the entire region, as these areas are not necessarily uniform in terms of topography, vegetation, and other factors.
To illustrate this point, Vaisala’s data can be used, noting that their networks account for total lightning, including both in-cloud and cloud-to-ground strokes. Vaisala uses the term event to count total lightning. According to their data, Colombia has an average value of 30 events/year/km 2. While this confirms a high lightning intensity in the country, it overestimates activity in regions like Orinoquía and the Amazon, where the lightning event densities are below 20 events/year/km 2. In contrast, the Momposina Depression can have values above 100 events/year/km 2. This discrepancy highlights the problem of using average values to describe lightning intensity over large areas, as it can mask the actual behavior, leading to underestimation in some regions and overestimation in others.
For example, the average number of lightning events for the entire territory of Fusagasugá is low when compared to the departmental and national averages. However, when analyzing occurrences in rural districts, it becomes clear that a municipality’s small area experiences high lightning activity. Relying solely on municipal average activity would overlook the local population and infrastructure, as they would not be considered at high risk of lightning impact. The results of this research highlight the importance of lightning climatology studies on smaller scales.
Studies on lightning climatology focused on small areas aid in developing accurate local risk maps. These maps are essential for first responders to focus on protecting, mitigating, or preparing inhabitants and infrastructure for the threat of lightning impacts in specifically identified areas.
Finally, it is important to highlight two features of the lightning data provided by LLS. Firstly, their detection efficiency is less than 100 %, meaning that these data cannot be considered a complete representation of the phenomenon, but rather a representative sample. The second feature is that LLS lightning data heavily rely on wave propagation conditions, which are influenced by the terrain, vegetation, and structures along the path. Therefore, accurately determining lightning locations in very small areas has limitations due to the inherent uncertainty of the measuring system.
Conclusions
This article presents the findings from a data analysis of Vaisala’s GLD360 lightning detection network for Fusagasugá, Cundinamarca. To facilitate the processing and interpretation of lightning data, the Knowledge Discovery in Databases (KDD) methodology was used in conjunction with Tableau for data visualization .
The lightning activity demonstrates an apparent annual increase over the observed five-year period. However, because of the limited observation window, generalizing this trend is not feasible. In Fusagasugá, lightning activity exhibits a bimodal pattern, peaking in March and October, with a noticeable transition between them and a minimum occurrence in June and July. Most of the activity starts after noon, reaching its peak around 17:00 hours (GMT+5) and extending with reduced intensity into the early morning.
Approximately 36 % of the lightning activity concentrates in just two rural areas, covering less than 25 % of the total municipal area and situated between 500 and 1000 meters above sea level. This highlights the importance of focusing on these areas for risk management and prevention regarding the hazards to the local population and infrastructure that are produced by atmospheric electrical discharges.
Accessing data through Tableau streamlines the visualization and interpretation of results, potentially benefiting the first respondents involved in risk management and regional planning. Despite the relevance of the findings, the authors advocate for expanding the observation window to encompass more annual series, to validate the identified patterns over time.
Data on lightning locations are crucial for local authorities tasked with risk management, highlighting the necessity for similar analyses in other regions. Typically, this information is presented as average values for broader areas, which could result in ineffective efforts and resource allocation by authorities aiming to mitigate the risks associated with lightning activity to people and infrastructure.
Averaging values of lightning activity across larger regions can obscure high-intensity activity in smaller zones, such as rural districts. This is likely a widespread issue, given the uneven landscape in most of the country, especially in the Andean region
References
License
Copyright (c) 2024 Fernando Díaz-Ortiz, Neyder Perilla López, Juan Pablo Ospina Carrillo, Pedro Cifuentes Guerrero

This work is licensed under a Creative Commons Attribution-NonCommercial-ShareAlike 4.0 International License.
From the edition of the V23N3 of year 2018 forward, the Creative Commons License "Attribution-Non-Commercial - No Derivative Works " is changed to the following:
Attribution - Non-Commercial - Share the same: this license allows others to distribute, remix, retouch, and create from your work in a non-commercial way, as long as they give you credit and license their new creations under the same conditions.



2.jpg)
