DOI:
https://doi.org/10.14483/23448393.3855Published:
2012-12-28Issue:
Vol. 17 No. 2 (2012): July - DecemberSection:
ArticleClasificador basado en Máquina de Vectores de Soporte Ajustada para Reconocimiento de Peatones en Tráfico Urbano
Tuned Support Vector Machine Classifier for Pedestrian Recognition in Urban Traffic
Keywords:
Pedestrians recognition, Tuned SVM classifier (en).Keywords:
reconocimiento de transeúntes, clasificador SVM ajustado. (es).Downloads
References
Arlot, Sylvain and Celisse, Alain. A survey of cross-validation procedures for model selection. Statistics Surveys, 4:40--79, 2010.
Bertozzi, M. and Broggi, a. and Rose, M. Del and Felisa, M. and Rakotomamonjy, a. and Suard, F. A Pedestrian Detector Using Histograms of Oriented Gradients and a Support Vector Machine Classifier. 2007 IEEE Intelligent Transportation Systems Conference, :143--148, 2007.
Dalal, Navneet and Triggs, Bill. Histograms of oriented gradients for human detection. Computer Vision and Pattern Recognition, 2005. CVPR 2005. IEEE Computer Society Conference on, pages 886--893, 2005. Ieee.
Enzweiler, Markus and Gavrila, Dariu M. Monocular pedestrian detection: survey and experiments.. IEEE transactions on pattern analysis and machine intelligence, 31(12):2179--95, 2009.
Haykin, Simon. Neural networks: a comprehensive foundation. Pearson Education, Inc., 1999.
Hsu, C.W. and Chang, C.C. and Lin, C.J. and Others. A practical guide to support vector classification. Technical report, 1, Department of Computer Science National Taiwan University, 2010.
Kidono, Kiyosumi and Miyasaka, Takeo and Watanabe, Akihiro and Naito, Takashi and Miura, Jun. Pedestrian recognition using high-definition LIDAR. Intelligent Vehicles Symposium (IV), 2011 IEEE, number Iv, pages 405--410, 2011. IEEE.
Araújo, R. L. C. and Lacerda, V. M. and Hernandes, A. C. and Mendonça, A. S. B. and Becker, M . Classificação de pedestres usando câmera e sensor LIDAR. In: X Simpósio Brasileiro de Automação Inteligente (SBAI), 2011, São João del Rei, MG. Simpósio Brasileiro de Automação Inteligente (SBAI), 2011.
Ludwig, O. and Delgado, David and Gonçalves, V. and Nunes, Urbano. Trainable classifier-fusion schemes: an application to pedestrian detection. Intelligent Transportation Systems, 2009. ITSC'09. 12th International IEEE Conference on, pages 1--6, 2009. IEEE.
National Highway Traffic Safety Administration of U.S. Goverment. TRAFFIC SAFETY FACTS 2009. Technical report, NHTSA's National Center for Statistics and Analysis, Washington, 2009.
Organización Panamericana de la Salud. Informe sobre el estado de la seguridad vial en la región de las américas. Technical report, Biblioteca Sede OPS, Washinton, 2009.
Serfling, Matthias and Loehlein, Otto and Schweiger, Roland and Dietmayer, Klaus. Camera and imaging radar feature level sensorfusion for night vision pedestrian recognition. 2009 IEEE Intelligent Vehicles Symposium, :597--603, 2009.
Wang, Zhen-Rui and Jia, Yu-Lan and Huang, Hua and Tang, Shu-Ming. Pedestrian Detection Using Boosted HOG Features. 2008 11th International IEEE Conference on Intelligent Transportation Systems, :1155--1160, 2008.
World Health Organization. Decade of Action for Road Safety 2011-2020. Technical report, World Health Organization, Geneva, 2011.
World Health Organization. Global status report on road safety. Technical report, WHO Library Cataloguing-in-Publication Data, Geneva, 2009.
Zhang, Guangyuan and Gao, F. and Liu, C. and Liu, W. and Yuan, H. A pedestrian detection method based on SVM classifier and optimized Histograms of Oriented Gradients feature. Natural Computation (ICNC), 2010 Sixth International Conference on, number Icnc, pages 3257--3260, 2010. IEEE.
How to Cite
APA
ACM
ACS
ABNT
Chicago
Harvard
IEEE
MLA
Turabian
Vancouver
Download Citation
TUNED SUPPORT VECTOR MACHINE CLASSIFIER FOR PEDESTRIAN RECOGNITION IN URBAN TRAFFIC
CLASIFICADOR BASADO EN MÁQUINA DE VECTORES DE SOPORTE AJUSTADA PARA RECONOCIMIENTO DE PEATONES EN TRÁFICO URBANO
Henry Roncancio, Universidad Distrital. Bogotá, Colombia. roncanciovl@usp.br
André Carmona Hernandes, Universidad de Sao Paulo. Sao Carlos, Brasil. Andre.hernandes@usp.br
John Faber Archila, Universidad Industrial de Santander. Bucaramanga, Colombia. jfarchid@uis.edu.co
Marcelo Becker, Universidad de Sao Paulo. Sao Carlos, Brasil. Becker@sc.usp.br
Recibido: 31/07/2012 - Aceptado: 15/11/2012
RESUMEN
La búsqueda de autonomía en desplazamiento automotriz está en auge. En dicha búsqueda existen diversos problemas a resolver; uno de ellos es el reconocimiento de características en ambientes urbanos que permitan a un vehículo tomar decisiones autónomas. Uno de los aspectos más relevantes corresponde al reconocimiento de transeúntes, una tecnología que se espera pueda salvar millones de vidas en accidentes de atropellamientos. En este trabajo de investigación se propone el reconocimiento de transeúntes en ambientes urbanos por medio de un clasificador basado en una Máquina de Vectores de Soporte ajustada; se consideraron hasta 5000 imágenes de la base de datos la INRIA con el fin de entrenar el clasificador y validar su precisión por medio del método de validación cruzada.
Palabras clave: reconocimiento de transeúntes, clasificador SVM ajustado.
ABSTRACT
The need for autonomy and intelligent decision-making in automobile flow is booming. For this purpose there are a number of interesting problems related to recognition of features in urban environments. One of the main relevant aspects in this subject is the recognition of pedestrians, a technology that is expected to save millions of lives avoiding or decreasing the rates of pedestrian run away. In this paper we propose the recognition of pedestrians in urban environments using a classifier based on a Support Vector Machine. We used up to 5000 images from the INRIA database to train the classifier and validate its accuracy through the cross-validation method.
Key words: Pedestrians recognition, Tuned SVM classifier
1. INTRODUCTION
Car accidents cause the death of nearly 1.3 million people every year. In addition, injuries due these accidents cost most countries 1-3% of their gross national product. This problem is even worse if we consider the vulnerable road users (i.e. pedestrians, cyclists, and motorized riders). Today, they represent almost half of the number of victims (about 46%) [1].
For example, in some countries of Central and South America, the deaths of vulnerable users become as high as 70% [1]. The last traffic safety report of the Panamerican Health Organization shows that, for example, when it comes to pedestrian fatalities the Northern Andes zone has the biggest in America (43%), Table I shows the percentages for those categories [2].

According to the World Health Organization (WHO),if this death trend continues, it is predicted that the road traffic injures will be the 5th cause of death in the world by 2030 [3]. The WHO has named this decade: “The Decade of Action for Road Safety”, after its plan to change this trend; it is expected that over 5 million lives will be saved (before 2020) just by strengthening the road safe management, making safer roads and safer vehicles.
Regarding vehicles and roads, many efforts are being addressed to design autonomous vehicles able to deal with real traffic conditions. Because most car accidents are attributed to human error [1][4], making not only autonomous vehicles but also intelligent transportation systems will hopefully bring reduction in road fatalities. Even though worldwide, large scale implementation of such technology is still a plan, in the meanwhile the current development has focus on designing pre-emptive systems to help the driver in avoiding collisions.
The Mobile Robotics Laboratory (LabRoM) at São Carlos School of Engineering - University of São Paulo (EESC-USP) is currently developing the SENA Project (Sistema Embarcado de Navegação Autônoma)[5], which provides the vehicle with a combination of various sensors, such as laser sensor, camera, IMU (Inertial Measurement Unit) and GPS units, to perceive the environment that surrounds the vehicle and to control its motion; a schematic of the SENA project is shown in Figure 1.
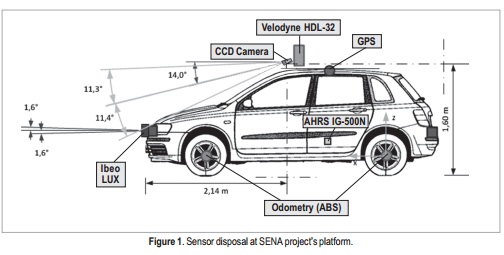
One of the main components in this vehicle is the object detection module, namely the pedestrian and car detection module, which uses images captured by a camera and data from laser sensors to sense the outdoor environment. The SENA project is currently in the sensors set-up and calibration phase; for this reason, most data used in this paper was taken from research-purpose databases. One activity of the next stage of the project will be setting up an in-house database.
When it comes to pedestrian detection, there are several approaches in the literature; they are mainly focused on computer vision with either mono or stereo cameras [6], analysis of laser sensor data [7], and even data fusion of both laser and camera [8]. In this paper we present a pedestrian recognition algorithm that uses a classifier based on a computer vision technique. The images used to train and to validate the classifier are from the INRIA database (Institute National de Recherché en Informatique et en Automatique) [9]. In addition, a few images from LabRoM database were also used for testing the algorithm.
The following section shows the methodology used to generate the classifier’s model, it also explains the cross-validation method used for model validation and the metrics used for evaluating it. The F1 -score metric is used as a model performance estimator, and in addition, the repeated random sub-sampling validation is used as the cross-validation method, these both procedures show a different approach to the problem in relation to other related papers [9],[6],[10],[11]. Previous papers implemented mainly an SVM with linear kernel and validated the model performance through the recognition rate, i.e. the accuracy of the prediction. In contrast, in this paper we tune an RBF-kernel SVM and take advantage of using the F1-score metric for improving the tuning, when used simultaneously with a cross-validation procedure. Finally, the classifier performance is discussed through the analysis of tables of results.
2. METHODOLOGY
The following steps are carried out in this approach to pedestrian recognition (see Figure 2):
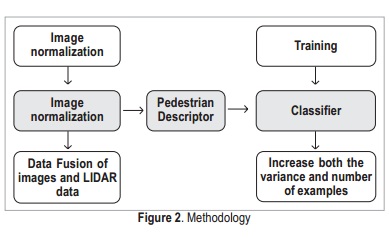
- Image normalization.
- Extraction of both pedestrian and non-pedestrians descriptors using Histogram of Oriented Gradients (HOG).
- Creation of a model that represents such descriptors, i.e., training the tuned support vector machine (SVM).
- Model validation.
2.1. Image Normalization
This normalization is usually done manually.Most of the INRIA images were already normalized manually. However, for future work we propose a method intend to normalize then automatically. The normalization aims to accomplish an image resizing in order to make the pedestrian most of the image, in addition to this; it tries to make the pedestrian the center of the image. A better classifier performance is achieved using normalization, because the positive descriptors become more similar.
2.2. Histogram of Oriented Gradients
This human-shape descriptor created by Dalal [9] is invariant to local geometric and photometric transformations in pedestrian imagery. The HOG is widely used in pedestrian recognition because it presents a better performance when compared with other descriptors [12]. This algorithm extracts local features from the image by calculating the distribution of local intensity gradients or edge directions; it also does a local contrast normalization. In this implementation, the resulting descriptor for any image size is a vector in ℜ81 [13]. The descriptor has the class attributes or features that will be subsequently used for training the classifier.
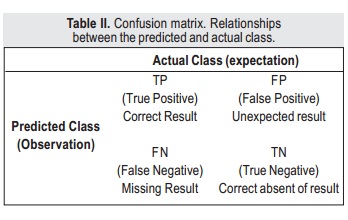
2.3. Metrics for Model Validation
The performance of a binary classifier is quantified by calculating the number of correct, missing and unexpected predictions, as presented in Table II and Equations (1-4).


2.4. Tuned Support Vector Machine
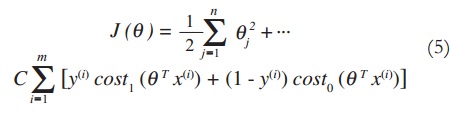
An SVM is an algorithm that makes predictions on new data by creating a model of known data (training data). When the data set is labeled to a class, the SVM becomes a trained classifier. Basically, the SVM does a mathematical optimization to find the model that best separates the classes. This procedure is carried out by minimizing the cost function that represents the error between the data and the model; this cost is shown in (5). As a result, the best hyperplane of separation (hypothesis) is determined. In some classification problems the relation between class labels and features is predominantly non-linear, so that, in order to achieve the separation an especial non-linear function is used to map the examples to a higher dimension, in which the features are more easily separated. The function that defines how the examples are mapped is known as the “kernel”, and it can be either non-linear or linear. The radial-based function (RBF) shown in (6) is a non-linear function widely used as kernel. It defines a similarity function between all the examples.
The approach proposed in this paper uses a tuned SVM: a search for the best kernel-based SVM parameters that achieve the greatest F1 score in the prediction is conducted. For the SVM with RBF kernel, the model parameters are C, known as regularization in (5), and σ, which is the RBF width, as in (6) [14]. Having a number of examples many times bigger than the number of features allows the model with RBF kernel to obtain better predictions than the linear kernel. The following steps are carried out to tune the model [15] (see Figure 3):
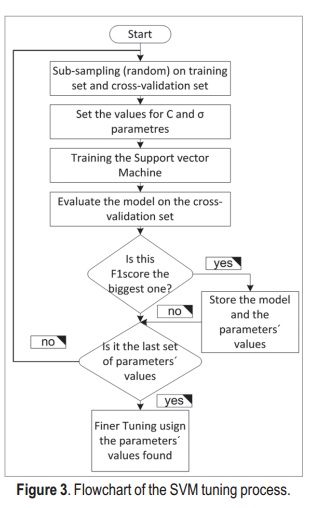
- Feature scaling. In order for the SVM with RBF kernel to avoid features in greater numeric ranges dominating those in smaller ranges, a feature scaling is carried out.
- Search for the best C and ó in a coarse grid. Both parameters determine the model variance and bias. High bias means an underfitting model and high variance means an overfitting model. The final model should manage a good trade-off between bias and variance. The RBF is tuned by the parameter σ, small values of ó increase the model variance, the smaller this parameter the more overfitting the model. The C parameter in the cost function regularizes the model by underfitting it; small values decrease the model variance. A good combination of these parameters accomplishes the required trade-off. A grid search with steps 2x for x ∈[-6,5], x ∈Z, was performed for tuning both parameters, C and σ.
- Search for the best C and ó in a finer grid. The finer grid is created by splitting into 10 equally divided parts the region near the parameters found in the previous search. The finer grid becomes different for each tuning value.

Where:
J(θ) : Cost function
fi : Similarity function used as Kernel
θ : Parameter Vector of the estimated hypothesis
l(i) : Landmark based on example i
x(i) : Feature vector for example i
cost1 : Cost for positive examples
cost0 : Cost for negative examples
n : Number of features
m : Number of examples
2.5.Cross-Validation Method (CV)
In order for the model to be statistically well validated its performance should be evaluated on “new data” (different from training set) several times, otherwise it may show an overoptimistic result. For this purpose, the data is commonly split into two sets, namely training set and cross-validation set. For one split a simple validation is carried out by calculating an estimator of risk on the cross-validation set, e.g. accuracy, using the model created with the training set. CV consists in averaging several validations corresponding to different-data splits [16]. Even though this method is intended to establish the model statistical performance, in this paper a CV is carried out in order to find the best model for our data. Several models are created by varying both the model parameters and the training set, and its performance is subsequently evaluated in the cross-validation set.
Because the cross-validation set is used to tune the model, there is a need for having another independent data set for further validation. Therefore, the data is split into three sets and the additional set is named test set. A model with high F1 score, i.e., both precision and recall high, in the cross-validation set is considered a good one. The best model is finally validated on the test set in order to calculate a more realistic estimation. This paper uses this CV evaluation for tuning the classifier´s model just by looking the parameters that make the model reaches the highest F1 score in the prediction.
The type of CV method used is the repeated random sub-sampling validation, i.e., the data is randomly split into training and cross-validation set several times, and for every split both the model accuracy and F1 score are calculated. The values are averaged in order to get the model statistical performance. Because the model performance depends on not only the model parameter but also on the data, a different performance is achieved for each split. It is expected that a database with both most of the scenarios and many examples generates a better model.
3. RESULTS
3.1.Data
The database used is composed of over 5,000 color images downloaded from INRIA [9]. The images were taken on different weather conditions, such as rain and snow/sleet; besides, with different illumination conditions, including some images taken on night. In addition, the human bodies have different poses (although all are upright), and there are even a few people riding bikes. Several normalized pedestrian images are shown in Figure 4.
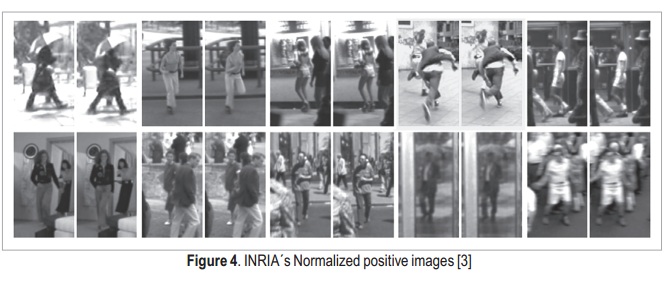
Due to this normalization, there are two image resolutions in the positive images, namely 96 × 160 pixels and 70 × 13 pixels. On the other hand since the negative images were not normalized, they are bigger than the positive ones and even have different sizes.
3.2.Preliminar Experiment
The INRIA data set is originally split in two sets, namely train and test set (70% and 30% respectively). Table III shows a few preliminary tests for those original sets. Without normalization, the SVM (linear kernel) predicted with an accuracy greater than the SVM (RBF kernel), despite of the accuracy in the training set is greater using the RBF kernel. The latter indicates that the SVM (RBF kernel) without normalization is over fitting the data.
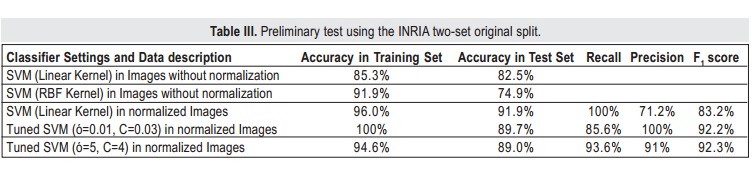
For normalized images, classification results are better. The SVM (Linear kernel) again obtains a better accuracy; however, the precision is not good enough (71.2%); even though the recall is 100%, the F1 score (83.2%) is affected by the low precision. In this case, all the actual pedestrians are being predicted, but there are a few non-pedestrian data that is erroneously predicted as pedestrian. These values illustrate that accuracy is not always a good estimator of model performance. A better estimator is the F1 score, because it takes into account the precision as well as the recall. Accordingly, a better performance is achieved using an RBF kernel because the F1 score is as high as 92.3%.
Unlike Linear kernel, the RBF kernel obtains better precision rates. However, in some cases the recall is not satisfactory (tuned SVM with σ=0.01, C=0.03). By performing the grid search procedure described above, a model with a better trade-off between precision and recall, such as the tuned SVM with σ=5, C=4 is found (both metrics are higher than 90%).
3.3. CV Experiment
In this experiment, the CV method explained above was used. Data was split into training, cross-validation and test sets, as seen in Figure 5. Positive examples correspond to pedestrian images (70%) and negative ones to city’s streets and country images (30%).
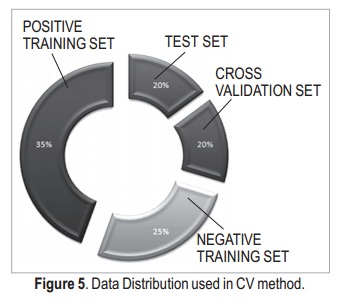
Table IV shows the average for both model accuracy and F1 score for 10 random sub-sampling validations.
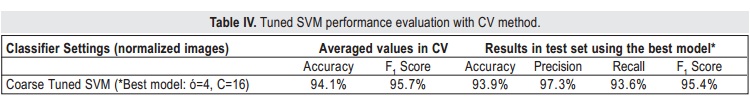
It can be seen that the performance of the tuned RBF SVM in both metrics is greater than 94% in average in the CV sets, whereas for the test set even higher values are achieved. The model found with the finer grid search tuning also improves the performance rates. We reason that the fact of increasing the variance of the training samples, i.e. adding new different examples, gives the prediction model an improvement on its accuracy, from 89% to 94.7%, and on the F1 score, from 92.3% to 96.1%, in held-out (unknown) data.
In term of processing speed, tuning the SVM model with the finer grid on an image of 640 x 480 took 1.93s in average; and for an image of 137 x 70 the time was 0.02s in average. These tests were carried out in MatLab®, with an Intel 2 duo CPU at 3GHz.
3.4 Experiments with images from LabRoM
These experiments were carried out with the fine-tune SVM classifier (σ=4.2, C=11.4) presented in Table IV.
Figure 6 shows a positive and a negative image in the same scenario, correctly predicted by the classifier. This result shows that the background had no effect in the classification.
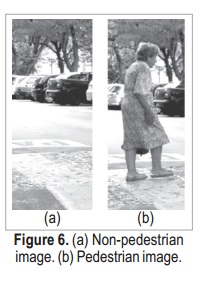
Figure 7 shows an assorted set of pedestrian images correctly classified.
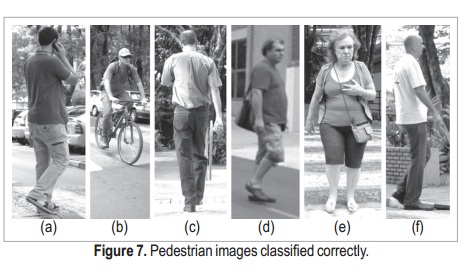
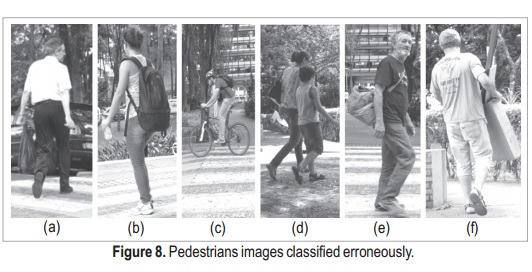
It is interesting to note that classification is correct even for different poses and illumination conditions. These images are very si-milar to the positive ones used to train the classifier. Nevertheless, other images in which the pedestrian’s posture was not upright or he was wearing bags and backpacks, were misclassified (see Figure 8).
In all cases, the images were manually pre-processed in order to get a normalized pedestrian image. However, we are currently developing at LabRoM an automatic method for normalizing the images by applying a data fusion technique of CCD camera (AVT stingray 033C) and a frontal, multilayer laser sensor (Ibeo Lux) embedded in our test vehicle. This laser sensor yields the obstacle’s location in the front side. By making a correlation between both data, the obstacle’s spatial location found through the laser is subsequently used to get from the entire image (taken from the front side) another small image with only the obstacle. As a result, an obstacle’s nor malized image is obtained.
4. CONCLUSION
The increase in the prediction rates showed in the CV test, indicates that an important factor to improve the classifier performance is to train with a high number of examples, provided that the model presents a good trade-off between bias and variance. On the other hand, the cross-validation procedure used for tuning the model yields a way of avoiding overfitting. Moreover, the model performed well in the test set, which was totally independent. The search for the best F1 score in the CV also enables the method to find a model with the best trade-off between precision and recall. We conclude that this trade-off is only reached by tuning the model with the F1 score rather than the accuracy.
Furthermore, tuned RBF-kernel SVM models performed better compared with linear-kernel SVM models, and better prediction rates can be achieved by doing a finer grid-search tuning. The CV test shows that such model is able to obtain an accuracy of 95% and an F1 score of 96.3% in the pedestrian recognition task, for more than 5,000 images from INRIA dataset.
Even though the classification results were satisfactory for many scenarios, using the HOG and the tuned SVM, there are still pedestrian images that must be included for training in order to make the classifier more robust. Tests showed that in actual road scenarios there are variations with regard to pedestrian’s posture, pedestrian’s companions, and pedestrian’s accessories that introduce confusion factors resulting in misclassifications. It is expected that by adding these scenarios in the training data the classifier robustness is improved. As a final comment we expect that by implementing this kind of computer vision-based recognition system in the vehicle’s front bumper, combined with a vehicle control system that is able to avoid collisions, the road fatalities involving pedestrians can be greatly reduced.
ACKNOWLEDGMENT
The authors would like to thank São Paulo Research Fundation (FAPESP), Fapesp - Grant # 2011/03986-9, the Brazilian National Institute of Optics and Photonics (INOF), and CNPq Brazil.
REFERENCES
- Arlot, Sylvain and Celisse, Alain. A survey of cross-validation procedures for model selection. Statistics Surveys, 4:40—79, 2010.
- Bertozzi, M. and Broggi, a. and Rose, M. Del and Felisa, M. and Rakotomamonjy, a. and Suard, F. A Pedestrian Detector UsingHistograms of Oriented Gradients and a Support Vector Machine Classifier. 2007 IEEE Intelligent Transportation Systems Conference, :143—148, 2007.
- Dalal, Navneet and Triggs, Bill. Histograms of oriented gradients for human detection. Computer Vision and Pattern Recognition, 2005. CVPR 2005. IEEE Computer Society Conference on, pages 886—893, 2005. Ieee.
- Enzweiler, Markus and Gavrila, Dariu M. Monocular pedestrian detection: survey and experiments.. IEEE transactions on pattern analysis and machine intelligence, 31(12):2179—95, 2009.
- Haykin, Simon. Neural networks: a comprehensive foundation. Pearson Education, Inc., 1999.
- Hsu, C.W. and Chang, C.C. and Lin, C.J. and Others. A practical guide to support vector classification. Technical report, 1, Department of Computer Science National Taiwan University, 2010.
- Kidono, Kiyosumi and Miyasaka, Takeo and Watanabe, Akihiro and Naito, Takashi and Miura, Jun. Pedestrian recognition usinghigh-definition LIDAR. Intelligent Vehicles Symposium (IV), 2011 IEEE, number Iv, pages 405—410, 2011. IEEE.
- Araújo, R. L. C. and Lacerda, V. M. and Hernandes, A. C. and Mendonça, A. S. B. and Becker, M . Classificação de pedestres usando câmera e sensor LIDAR. In: X Simpósio Brasileiro de Automação Inteligente (SBAI), 2011, São João del Rei, MG. Simpósio Brasileiro de Automação Inteligente (SBAI), 2011.
- Ludwig, O. and Delgado, David and Gonçalves, V. and Nunes, Urbano. Trainable classifier-fusion schemes: an application to pedestrian detection. Intelligent Transportation Systems, 2009. ITSC’09. 12th International IEEE Conference on, pages 1—6, 2009. IEEE.
- National Highway Traffic Safety Administration of U.S. Goverment. TRAFFIC SAFETY FACTS 2009. Technical report, NHTSA’s National Center for Statistics and Analysis, Washington, 2009.
- Organización Panamericana de la Salud. Informe sobre el estado de la seguridad vial en la región de las américas. Technical report, Biblioteca Sede OPS, Washinton, 2009.
- Serfling, Matthias and Loehlein, Otto and Schweiger, Roland and Dietmayer, Klaus. Camera and imaging radar feature level sensorfusion for night vision pedestrian recognition. 2009 IEEE Intelligent Vehicles Symposium, :597—603, 2009.
- Wang, Zhen-Rui and Jia, Yu-Lan and Huang, Hua and Tang, Shu-Ming. Pedestrian Detection Using Boosted HOG Features. 2008 11th International IEEE Conference on Intelligent Transportation Systems, :1155—1160, 2008.
- World Health Organization. Decade of Action for Road Safety 2011-2020. Technical report, World Health Organization, Geneva, 2011.
- World Health Organization. Global status report on road safety. Technical report, WHO Library Cataloguing-in-Publication Data, Geneva, 2009.
- Zhang, Guangyuan and Gao, F. and Liu, C. and Liu, W. and Yuan, H. A pedestrian detection method based on SVM classifier and optimized Histograms of Oriented Gradients feature. Natural Computation (ICNC), 2010 Sixth International Conference on, number Icnc, pages 3257— 3260, 2010. IEEE.

This work is authorized by an Attribution-NonCommercial-NoDerivs CC BY-NC-ND license.
License
![]()
From the edition of the V23N3 of year 2018 forward, the Creative Commons License "Attribution-Non-Commercial - No Derivative Works " is changed to the following:
Attribution - Non-Commercial - Share the same: this license allows others to distribute, remix, retouch, and create from your work in a non-commercial way, as long as they give you credit and license their new creations under the same conditions.

2.jpg)