DOI:
https://doi.org/10.14483/udistrital.jour.reving.2017.2.a07Published:
2017-05-05Issue:
Vol. 22 No. 2 (2017): May - AugustSection:
Special Section: Best Extended Articles - WEA 2016Assessment of the Input Substrate Characteristics Included in the Anaerobic Digestion Model No. 1 (ADM1)
Evaluación de las Características del Sustrato de Entrada Incluidas en el Modelo De Digestión Anaerobia No. 1 (ADM1)
Keywords:
ADM1, anaerobic digestion, biogas production, sensitivity analysis. (en).Keywords:
ADM1, análisis de sensibilidad, digestión anaeróbica, producción de biogás (es).Downloads
References
D. Batstone, J. Keller, I. Angelidaki, S. Kalyuzhnyi, S. Pavlostathis, A. Rozzi, W. Sanders, H. Siegrist, and V. Vavilin, “The IWA Anaerobic Digestion Model No 1 (ADM1).,” Water Sci. Technol., vol. 45, no. 10, pp. 65–73, Jan. 2002.
I. Ramírez, “Computation and implementation issues for biodiversity simulations with extended anaerobic digestion model no 1 (ADM1_N) in Matlab / Simulink,” Rev. Invest. Univ. Quindío., vol. 24, no. 2, pp. 269–279, 2013.
IWA Task Group for Mathematical Modelling of Anaerobic Digestion Processes, Anaerobic Digestion Model No. 1 (ADM1) Scientific and technical report, Ilustrada. IWA Publishing, 2002.
T. Matsumoto and I. Sánches Ortiz, “Desempeño de la planta de tratamiento de aguas residuales de Sao Joao de Iracema (Brasil),” no. 176, pp. 176–186, 2016.
U. Zaher, Modelling And Monitoring The Anaerobic Digestion Process In View Of Optimisation And Smooth Operation Of WWTP’s. 2005.
D. I. Page, K. L. Hickey, R. Narula, A. L. Main, and S. J. Grimberg, “Modeling anaerobic digestion of dairy manure using the IWA Anaerobic Digestion Model no. 1 (ADM1),” Water Sci. Technol., vol. 58, no. 3, pp. 689–695, 2008.
D. Gaida, “Dynamic real-time substrate feed optimization of anaerobic co-digestion plants,” Leiden University, 2014.
L. Xue, D. Li, and Y. Xi, “Nonlinear Model Predictive Control of anaerobic digestion process based on reduced ADM1,” in Control Conference (ASCC), 2015 10th Asian, 2015, pp. 1–6.
E. Cendales and S. Jiménez, “Modelamiento computacional de la producción de energía renovable a partir del biogás mediante la codigestión anaeróbica de la mezcla de residuos cítricos y estiércol bovino,” Rev. EAN, no. 77, pp. 42–63, 2014.
G. Lyberatos and I. V Skiadas, “Modelling of anaerobic digestion - a review,” Glob. NEST J., vol. 1, no. 2, pp. 63–76, 1999.
L. Yu, P. C. Wensel, J. Ma, and S. Chen, “Mathematical Modeling in Anaerobic Digestion (AD),” J. Bioremediation Biodegrad., vol. s4, no. 3, p. 12, 2013.
A. Donoso-Bravo, J. Mailier, C. Martin, J. Rodríguez, C. Aceves-Lara, and A. Vande Wouwer, “Model selection, identification and validation in anaerobic digestion: a review.,” Water Res., vol. 45, no. 17, pp. 5347–64, Nov. 2011.
E. Ficara, S. Hassam, A. Allegrini, A. Leva, F. Malpei, and G. Ferretti, “Anaerobic Digestion Models : a Comparative Study,” Math. Model., vol. 7, no. 1, pp. 1052–1057, 2012.
F. Blumensaat and J. Keller, “Modelling of two-stage anaerobic digestion using the IWA Anaerobic Digestion Model No . 1 ( ADM1 ),” Water Res., vol. 39, no. 1, pp. 171–183, 2005.
C. García-Diéguez, O. Bernard, and E. Roca, “Reducing the Anaerobic Digestion Model No. 1 for its application to an industrial wastewater treatment plant treating winery effluent wastewater.,” Bioresour. Technol., vol. 132, no. 1, pp. 244–53, Mar. 2013.
U. Zaher and S. Chen, “Interfacing the IWA Anaerobic Digestion Model No. 1 (ADM1) With Manure and Solid Waste Characteristics,” in Proceedings of the Water Environment Federation, 2006, vol. 1, no. 1, pp. 3162–3175.
R. Girault, G. Bridoux, F. Nauleau, C. Poullain, J. Buffet, J. P. Steyer, a. G. Sadowski, and F. Béline, “A waste characterisation procedure for ADM1 implementation based on degradation kinetics,” Water Res., vol. 46, no. 13, pp. 4099–4110, 2012.
C. Rosen and U. Jeppsson, “Aspects on ADM1 Implementation within the BSM2 Framework,” Tech. Rep., pp. 1–37, 2008.
S. K. Khanal, Anaerobic Biotechnology for Bioenergy Production: Principles and Applications, 1st ed. Iowa, Estados Unidos: Wiley-Blackwell, 2009.
C. Díaz Delgado, “Modelación matemática de plantas de tratamiento de lodos activados,” in Agua potable para comunidades rurales, reuso y tratamientos avanzados de aguas residuales domésticas., 1st ed., RIPDA-CYTED, Ed. 2003, pp. 240–255.
U. Jeppsson, “Investigation of Anaerobic Digestion Alternatives for Henriksdal’s WWTP,” Lund, Sweden, 2007.
B. C. Lyseng, W. Bergland, F. Haugen, and R. Bakke, “Biogas reactor modelling with ADM1,” Porsgrunn, Norway, 11/2012, 2012.
A. Normak, J. Suurpere, K. Orupõld, E. Jõgi, and E. Kokin, “Simulation of anaerobic digestion of cattle manure,” Agron. Res., vol. 10, no. SPEC. ISS. 1, pp. 167–174, 2012.
A. Mottet, I. Ramirez, H. Carrère, S. Déléris, F. Vedrenne, J. Jimenez, and J. Steyer, “New fractionation for a better bioaccessibility description of particulate organic matter in a modified ADM1 model,” Chem. Eng. J., vol. 228, pp. 871–881, Jul. 2013.
U. Zaher, R. Li, U. Jeppsson, J.-P. Steyer, and S. Chen, “GISCOD: general integrated solid waste co-digestion model,” Water Res., vol. 43, no. 10, pp. 2717–27, Jun. 2009.
B. Deepanraj, V. Sivasubramanian, and S. Jayaraj, “Biogas Generation through Anaerobic Digestion Process- An Overview,” vol. 18, no. 5, pp. 80–93, 2014.
D. Batstone and P. Jensen, “Anaerobic processes,” in Treatise on Water Science, P. Wilderer, Ed. Brisbane, Australia: Elsevier B.V., 2011, pp. 615–637.
T. Al Seadi, D. Rutz, H. Prassl, M. Kottner, T. Finsterwalder, S. Volk, and R. Janssen, Biogas handbook, Teodorita. Esbjerg, Denmark: by University of Southern Denmark Esbjerg, Niels Bohrs Vej 9-10, 2008.
How to Cite
APA
ACM
ACS
ABNT
Chicago
Harvard
IEEE
MLA
Turabian
Vancouver
Download Citation
Evaluación de las Características del Sustrato de Entrada Incluidas en el Modelo De Digestión Anaerobia No. 1 (ADM1)
Assessment of the Input Substrate Characteristics Included in the Anaerobic Digestion Model No. 1 (ADM1)
Laura Andrea Morales
Electromagnetic Compatibility and Interference Research Group (GCEM-UD).
Universidad Distrital Francisco José de Caldas. Bogotá DC - Colombia,
laamoralesg@correo.udistrital.edu.co
Ángel David Rodríguez
Electromagnetic Compatibility and Interference Research Group (GCEM-UD).
Universidad Distrital Francisco José de Caldas. Bogotá DC - Colombia,
androdriguezv@correo.udistrital.edu.co
Herbert Enrique Rojas
Electromagnetic Compatibility and Interference Research Group (GCEM-UD).
Universidad Distrital Francisco José de Caldas. Bogotá DC - Colombia,
herojasc@udistrital.edu.co
Recibido: 27/12/2016. Modificado: 08/03/2017. Aceptado: 05/04/2017.
Abstract
Context: Anaerobic Digestion (AD) is a well established process and widely used for wastewater treatment and power generation worldwide. In engineering, the Anaerobic Digestion Model number 1 (ADM1) is the preferred tool for predicting the behavior of AD. However, this model requires a detailed characterization of the input substrate, which is often a difficult and expensive process. This paper presents an analysis of the input waste variables in the ADM1 and its effects on the biogas production, in order to identify on which variables the characterization should be centered.
Method: A sensitivity analysis was performed using a simple methodology that consisted of establishing a reference case and change the value of each input concentrations one at a time leaving the other parameters equal. For this a specific range of variation was defined using the values of parameter extracted from several references. Simulations were done in MATLAB/Simulink R using a routine developed by the authors based on the ADM1 implementation proposed in the Lund University, Sweden.
Results: The analysis reveals that most critical variables involved in the methane production are temperature, volumetric flow rate of substrates and the concentrations of proteins, lipids and carbohydrates. For the case analyzed, variations in concentrations of lipids and carbohydrates increase the production of methane by more than 500 %.
Conclusions: In the concentrations of proteins, lipids and carbohydrates should focus the characterization of waste input when the ADM1 is implemented. Also, simulations shows that the input concentrations should be carefully estimated because oversizing of these can cause erroneous results.
Keywords: ADM1, anaerobic digestion; biogas production; sensitivity analysis.
Acknowledgements: The authors express their gratitude to Dr. Ulf Jeppsson and Dr. Christian Rosen from the Lund University, Sweden, for their advice during the MATLAB R implementation of the ADM1 model. In addition, Prof. H.E. Rojas thanks to the Universidad Distrital for its support through the doctoral commission with contract code N 000002-2016.
Language: English
Resumen
Contexto: La digestión anaeróbica (DA) es un proceso bien establecido y ampliamente utilizado para el tratamiento de aguas residuales y generación de energía en todo el mundo. En ingeniería, el modelo de digestión anaeróbica número 1 (ADM1) es la herramienta preferida para predecir el comportamiento de la DA. Sin embargo, este modelo requiere una caracterización detallada del sustrato de entrada, que a menudo es un proceso difícil y costoso. En este trabajo se presenta un análisis de las variables que caracterizan el residuo de entrada en el ADM1 y sus efectos en la producción de biogás, con el fin de identificar cuáles son las variables en las que la caracterización debería centrarse.
Método: Se realizó un análisis de sensibilidad utilizando una metodología simple que consistió en establecer un caso de referencia y cambiar el valor de cada una de las concentraciones de entrada una a la vez dejando los otros parámetros iguales. Para ello se definió un rango específico de variación utilizando los valores de parámetros extraídos de varias referencias. Las simulaciones se realizaron en MATLAB / Simulink mediante una rutina desarrollada por los autores y basada en la implementación de ADM1 propuesta en la Universidad de Lund, Suecia.
Resultados: El análisis revela que la mayoría de las variables críticas implicadas en la producción de metano son la temperatura, el caudal volumétrico del sustrato y las concentraciones de proteínas, lípidos y carbohidratos. Para el caso analizado, las variaciones en las concentraciones de lípidos y carbohidratos pueden llegar a aumentar la producción de metano en más de un 500 %.
Conclusiones: En las concentraciones de proteínas, lípidos y carbohidratos debe centrarse la caracterización de los residuos de entrada a un sistema de DA cuando se implementa el ADM1. Además, las simulaciones muestran que las concentraciones del sustrato deben ser cuidadosamente estimadas, ya que el sobredimensionamiento de estas puede causar resultados erróneos.
Palabras clave: ADM1, análisis de sensibilidad, digestión anaeróbica producción de biogás.
Agradecimientos: Los autores expresan su gratitud al Dr. Ulf Jeppsson y al Dr. Christian Rosen de la Universidad de Lund, Suecia, por su asesoría durante la implementación del modelo ADM1 en MATLAB. Adicionalmente, el Prof. H.E. Rojas agradece a la Universidad Distrital por su apoyo a través de la comisión de estudios doctorales con código de contrato N 000002-2016.
Idioma: Inglés
1. Introduction
Anaerobic digestion (AD) is a complex biological process that comprises a network of sequential and parallel reactions of biochemical and physicochemical nature. These reactions are made by several microbial groups in an anaerobic environment [1], [2]. The process begins with a decomposition of organic matter in the absence of oxygen producing biofertilizer and biogas. The first resultant product is a substrate rich in nitrogen, phosphorus, potassium, and calcium; while the second product is a biofuel composed mainly of methane (CH4) and carbon dioxide (CO2), able to override fossil fuels [3].
Other benefits offered by AD include a reduction in the chemical oxygen demand (COD), the control of pathogens and the odor reduction in wastewater [4]. However, microorganisms that de-velop the AD process are highly sensitive so any variation in the reactor conditions or changes in the residue that feed them could inhibit or damage the biological process [2], [5]. For these reasons, it is necessary to have a reliable characterization of each waste that enters to the reactor and con-trol many of the variables involved in the process, such as: temperature, pH, carbon/nitrogen ratio (C/N), organic leading rate and hydraulic and solid retention times [5], [6].
Several control methods have been developed to optimize the behavior of the AD process increasing the biogas production. These improvements have turn the biofuel in a more competitive source of renewable energy [7], [8]. Nevertheless, in order to develop adequate control strategies it is necessary to use mathematical models to predict the behavior of the AD process in a reliable way [5]. In the last four decades, several models of the AD process have been proposed. Some of them have a limited number of equations including kinetic rates and work for specific applications [9], [10]. Currently, complex models include more species of microorganisms and present the characterization of different substrates [11]-[13].
One of these complex models is the Anaerobic Digestion Model Number 1 (ADM1), which is the most studied in the literature [14], [15]. The ADM1 is a robust model that provides good results when the characterization of the waste input is correctly realized. However, the model has many input variables and the available information is scarce. For this reason, in several cases the application of the ADM1 is reduced to use the input variables and the parameters presented in the model report [3]. This condition makes difficult the diffusion of the model in research areas different to biochemistry or microbiology among others.
Some methodologies to facilitate the application of the ADM1 and to reduce its inputs number have been developed [15]-[17]. These papers focus on facilitating the characterization of the input residue, however, do not evaluate how a variation in these input variables affects methane production. For this reason, this paper presents a sensitivity analysis of the ADM1 in order to identify the variables that most affect the AD process and the most important variables involved in the in-put waste characterization. In addition, a brief description of the model structure, its advantages and its applications are presented. For the sensitivity analysis, 911 simulations were made using a Matlab/Simulink R routine and a user interface developed by authors. The implementation of the ADM1 is based on the work of Rosen & Jeppsson with wastewater treatment plants, where computational and methodological considerations for proper implementation of the ADM1 are presented [18].
The rest of the paper continues as follows: the ADM1 model structure and some aspects to take into account during its implementation are described in section 2. In section 3, the methodology used for the sensitivity analysis and the results provided for the sensitivity analysis of the ADM1 model are presented. A discussion about the critical variables involved in the input waste characterization for AD process is shown in Section 4. Finally, some conclusions are presented in section 5.
2. Anaerobic Digestion Model N 1 (ADM1)
The ADM1 was developed by a group of experts in the AD process, sponsored by the International Water Association (IWA) [5]. The ADM1 is divided into a liquid phase and a gas phase. The first stage gathers the input residue concentrations and the substrate concentrations inside the reactor, also called digester. The second phase gathers the gases produced by the AD of biomass. In these phases occur several conversion processes, called biochemical and physicochemical reac-tions. These biochemical reactions and its conversion processes (listed 1 to 7) are showed in Figure 1[3].
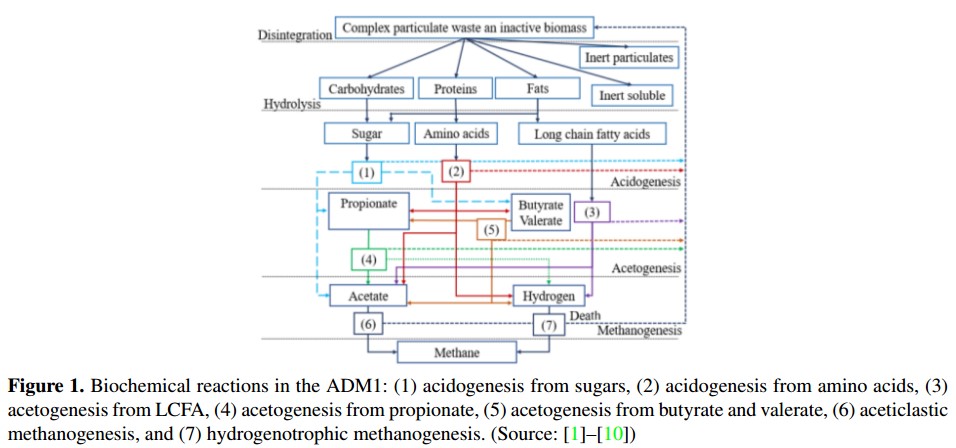
In the biochemical reaction, there are three biological steps: acidogenesis, acetogenesis and methanogenesis. As well as an extracellular disintegration and onestep of extracellular hydrolysis. On the other hand, the physicochemical reactions are divided into liquid-liquid reactions (association and dissociation of ions) and gasliquid exchanges. These reactions are used to describe the acidbase equilibria and the biological inhibition factors due to variations of the pH and the concentration of dissolved gases [1], [18].
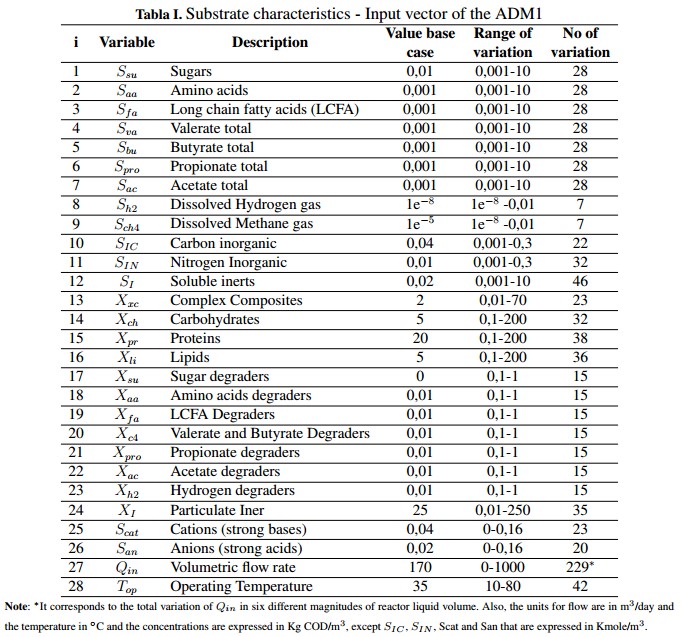
Using the ADM1 it is possible to describe, in general terms, the AD process and provides a common basis for validating and comparing results obtained experimentally. In addition, the model allows developing control strategies and optimize the AD process. The model has 29 state variables with a dynamic behavior. These variables are divided into 26 for the liquid phase and three (3) for the gas phase which are the concentrations of CH4, CO2 and hydrogen (H2 ) [18]. Table Ishows the input substrate characteristics which are divided in its soluble concentrations (S), particulate concentrations (X) and the operational parameters (volumetric flow and the operation temperature) that constitute the input vector of ADM1. These variables are grouped in a Peterson matrix, where they interact with 19 biochemical processes by means of kinetic rates, stoichiometric and physical parameters that are included in the complete model [1]. ].
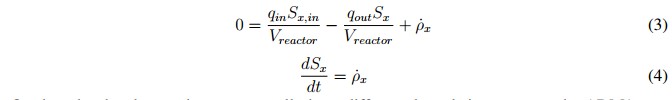
Inside the model, each state variable has a mass balance represented by the differential equation shown in (1), where mx is the specific mass of the chemical or biological species (x), the input and output rates of the mass flow are defined by mx,in and mx,out, respectively, and r is the net mass generation rate for each specie [19]. When the reactor volume (Vreactor) do not change over time, and there is a homogeneous mixture of the substrate (within the digester), it can be assumed that the effluent concentration is equal to the substrate concentration inside the system Sx, so the mass balance can be described by (2).
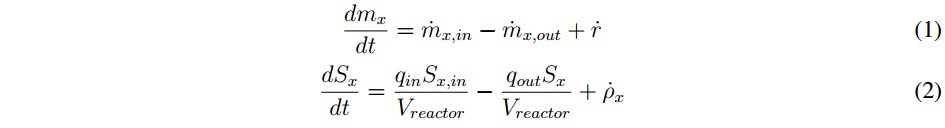
In this mathematical expression, Sx, in is the affluent concentration, &ro; x is volumetric mass generation rate and qin and qout are the input and output flows, respectively. Additionally, the expression presented in (2) can become in an algebraic equation under the steadystate condition described in (3). This is possible because the derivative of the concentration (dSx/dt) becomes to zero. However, if the reactor is closed (batch upload) and the initial concentration inside de has reached steadystate, the mass balance can be described by (4) [19].
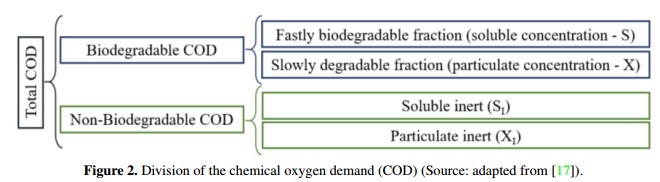
On the other hand, organic matter usually have different degradation rates, so the ADM1 uses the chemical oxygen demand (COD) as a common basis to characterize different biomass concentrations. In this context, COD can be divided to represent different rates of biodegradation as it is shown in Figure 2. In addition, COD relates the organic substrate, the active biomass and oxygen used, keeping the mass balances [5], [20]. It is important to note that during the implementation of the model developed by Rosen & Jeppsson in [18], inputs are divided into three groups: the characteristics of the waste input, substrate concentrations at steadystate within the digester and a set of biochemical, physicochemical, stoichiometric and physical parameters of the system.
3. Sensitivity analysis
Sensitivity analysis is a systematic study of how variations of the incoming data affect the outputs of a model. In dynamic and complex models, such as the ADM1, this type of analysis are important because allows checking the internal logic of the model and understand its operation. It also identify values for which the model has discontinuities or limits and define the relevance of each parameter in order to determine the attention to be given during their measurement and control.
3.1. Methodology
Due to the complexity of the ADM1 and the number of input variables, the sensitivity analysis was performed modifying the value of each input concentrations shown in Table I one at a time leaving the other parameters equal. For this paper, the work presented in [18] was defined as a base case where a continuous stirred tank reactor (CSTR) in steady state was simulated for a wastewater treatment plant. The changes of the input concentrations depending on the residue used (i.e., agrowastes, wastewater). For this reason, a specific range of variation was defined using the values of parameter extracted from several references [6], [17], [18], [21]-[25]. Although this review allowed identifying the maximum and minimum possible values for many of the variables, some input concentrations like Sch4 and Sh2 were not documented, so it was decided to vary them in a wide range for academic purposes.
The analysis was focused on the methane production (in mass units) because it is one of the most common indexes used for estimating the efficiency of the AD process. The methane production can be calculated using the following expression [21]:

Where, qgast is the amount of total gas expressed in [Nm3/day], SCH4 is the concentration of methane in [kgCOD/m3], Patm is the atmospheric pressure in [bars] and Pgas,t is the sum of the partial pressures (in bars) of the gases included in the biogas model (outputs variables of the ADM1). It is important to note that the factor Patm/ Ptotal,gast is used in (5) to remove the normalized value of qgast. Finally, in order to obtain an idea about the energetic potential of the biogas it was established that 1 [kgCH4] equals to 50 [MJ] [21].
3.2. Results
In this section, the results obtained from the sensitivity analysis of the variables listed in Table I are presented. It is important to note that some parameters were changed between extreme values in order to find critical conditions in the model. This process provides a better understanding about the impact that each variable has on the AD process and determine the ranges in which the ADM1 could provide unreliable results. In addition, for a better comparison of results the concentrations (parameters) that have the same scale and possess the same units were grouped in the same plot.
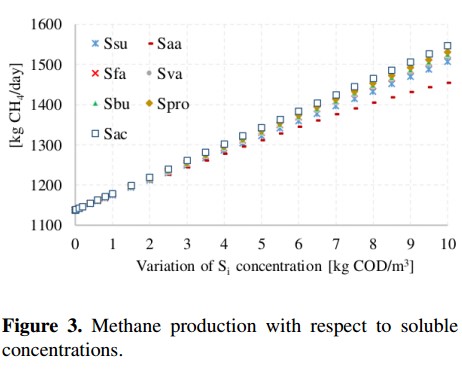
Figure 3 illustrates the methane production with respect to the variation of the following soluble concentrations: sugars (Ssu), amino acids (Saa), long chain fatty acids (Sfa), valerate total (Sva), butyrate total (Sbu), propionate total (Spro) and acetate total (Sac). These variables were changed from 0,001 to 10 [Kg COD/m3]. Results presented in Figure 3 show a linear growth in all concentrations except for amino acids. With respect to soluble concentration, the variable that produces the greatest variation on the methane production is the acetic acid (Sac), which causes an increase up to 35 %. This increase is not very significant considering that the input concentration was changed about 10000 times with respect to the value of the base case.
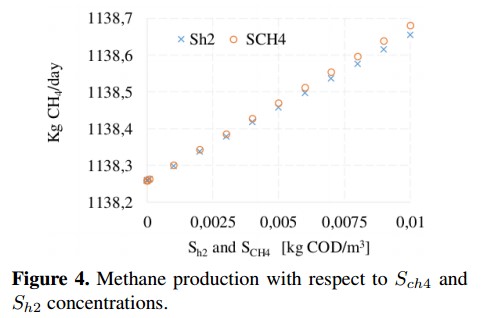
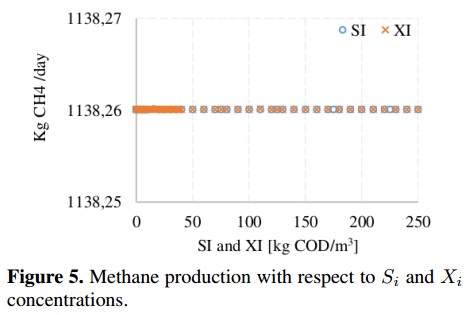
On the other hand, from the sensitivity analysis it is observed that some variables produce small changes (<0,1 %) on the CH4 production. This is the case of dissolved methane concentration (Sch4) and hydrogen concentration (Sh2), whose behavior is shown in Figure 4. These concentrations do not affect the decomposition of organic matter inside the reactor because before the AD process starts they are very small (ideally zero). In the base case, these variables are fixed whit a value close to zero to avoid numerical problems [18]. Figure 5 shows the variation of inert soluble compounds (SI) and inert particles (XI). In this case, negligible variations (<0,001 %) on CH4 production are observed when inert concentrations are changed. These minimum variations confirm that inputs Sch4, Sh2, SI and XI do not involved in the process of CH4 production.
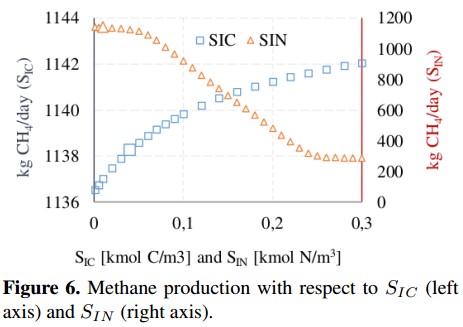
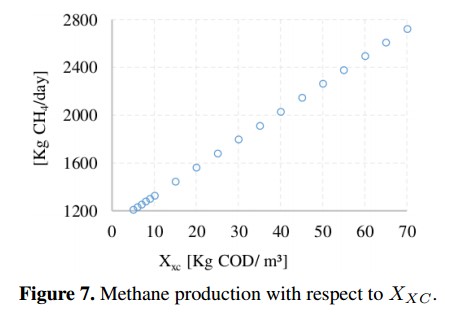
Figure 6 shows that inorganic carbon concentration (SIC) and inorganic nitrogen concentration (SIN) have an inverse behavior. In the first case, SIC presents a slight increase in the CH4 production of about 0,48 %, while the second concentration (SIN) presents a reduction of 25 %, stabilizing when SIN= 0; 22 with a CH4 production of 283 [kg CH4 /day]. The concentration of complex compounds (Xxc) was plotted in Figure 7. Due to the range variation of Xxc is different from other input concentrations, this Figure 7 shows a linear behavior with a growth rate of 23,4 (obtained from a linear regression). The variation on the CH4 production presents an increase of 140 % compared to the value of the base case.
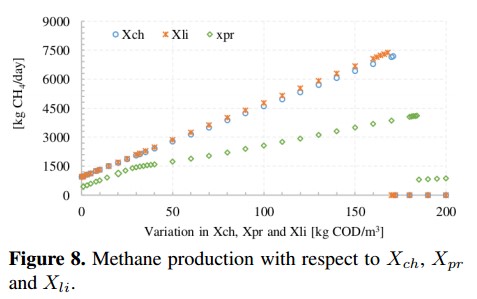
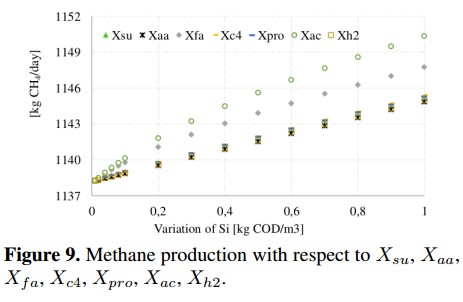
Figure 8 presents the methane production due to changes in the concentration of three macromolecules: carbohydrates (Xch), proteins (Xpr) and lipids (Xli). For all macromolecules, the methane production presents a pronounced linear growth, especially when carbohydrates and proteins increase. Later, CH4 production is inhibited when proteins and carbohydrates reach a concentration of about 160 [kg COD/m3] and lipids grow above 180 [kg COD/m3]. In the case of carbohydrates, CH4 production reaches a maximum value of 7190 [kg CH4/day] which equivalent to an increase of 532 % with respect to the base value. For lipids, CH4 reaches a maximum value of 7383 [kg CH4/day]. Meanwhile, proteins reach a maximum value of 4122 [kg CH4 /day] (increase of 262 %) before the ADM1 present unreliable results.
Particulate concentrations associated with the consumption of sugars (Xsu), amino acids (Xaa), fatty acids (Xfa) and acetic acid (Xac) among others are presented in Figure 9. In this figure, Xac) is the most representative concentration since the maximum value achieved was 1150 [kg CH4) /day] which is equivalent to a slight increase of 1 % in the methane production.
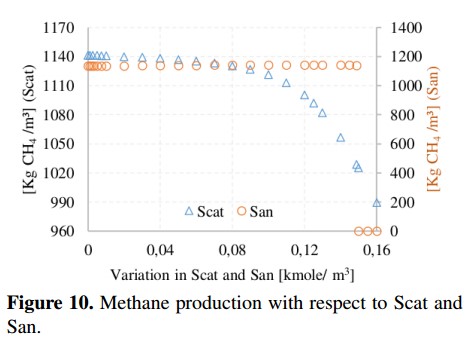
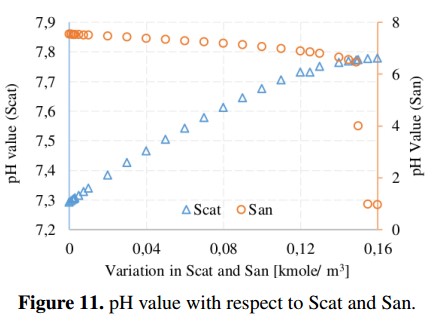
Methane production and pH value with respect to variations of cations and anions are shown in Figure 10 and Figure 11, respectively. These parameters are important in the ADM1 because they are used to obtain the load balance and the concentration of hydronium ion (H+) used in the computation of the pH value. From simulations, the recommended range for the pH in the AD process is 6.5 to 7.5 (without being inhibited) [19]. In addition, it can be noted that the variation of Scat reduces the methane production from 1141 to 990 [kgCH4 /day] due to an increase in the pH value (outside of the recommended range). In the case of San, the methane production remains in an average value of 1140 [kgCH4 /day] until the San reaches a value of 0,149 [Kmole/m3], in which the process is completely inhibited because the pH value starts to decrease.
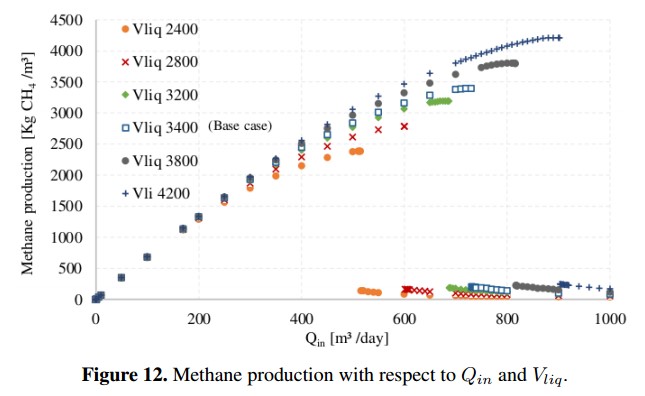
In general terms, when the AD process exceeds this threshold (pH value), it is so late to take a corrective action. However, if the pH variation is detected early the process can be controlled with the addition of chemicals such as: sodium carbonate, sodium bicarbonate, gaseous ammonia, ammonium hydroxide and sodium hydroxide [26]. In the case of the variation of the volumetric flow rate of substrates (Qin), it should be noted that in biogas plants this is a parameter easily adjustable because it has direct control over the amount of substrate input. However, the variation of Qin should be done considering the dilution rate (D), which is presented in (6). This parameter relates Qin with the liquid volume of the reactor (Vliq).

As an operating condition, D must be less than the growth rate of the species that grows slower. This is necessary to guarantee that microbial population has enough time to multiply inside the reactor (digester). If this condition is not accomplished, the AD process will be inhibited by lack of microorganisms [7]. The variation of Qin for different volumes of the reactor is shown in Figure 12, where the composition of the input residue and the other parameters of the base case were kept constant. From these results, it is possible to determine the maximum dilution rate that can be allowed before the system is inhibited. Using the Matlab R routine developed by authors, the maximum calculated dilution rate was D=0,21 [day 1] and the maximum Qin reaches 730 [m3/day], generating a maximum output of 3394 [kg CH4 /day].
It is important to note that the temperature affects directly the speed of the biochemical reactions and the growth rate of the microorganisms [19]. Therefore, for a correct implementation of the ADM1 is necessary to adjust the input parameters according to the operating temperature. However, there are few data in the literature that allow to relate the kinetic rates of biochemical processes with changes in temperature. For this reason, in this work it was decided not to vary these parameters, leaving them equal to the base case in all simulations.
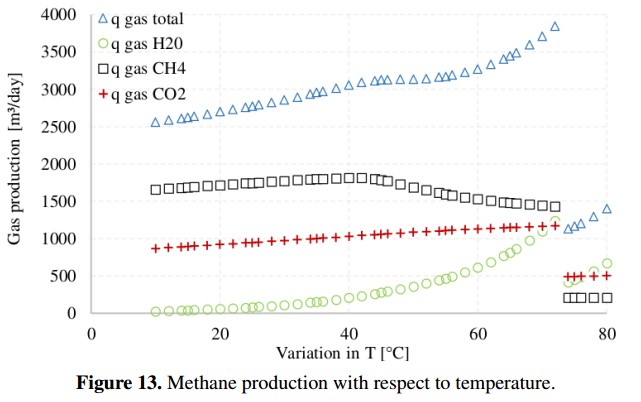
On the other hand, Figure 13 presents the complete gas production (CH4, CO2 and H2), including water vapor (H2O), obtained when temperature changes from 10˚C to 80˚C. In this case, to estimate how the ADM1 behaves at different temperatures, the input variables remain fixed using the base case values [18]. Figure 13 shows that the highest methane production in volumetric units [m3/day] is produced when the temperature is 40˚C. In addition, the total production of biogas (qgas total) increases as the temperature increases. However, the quality of the biogas, in terms of methane content, decreases while the water vapor and the amount of carbon dioxide and dihydrogen increase [27]. When the temperature reaches 72˚C the conditions within reactor become very aggressive for microbial populations and gas production drops abruptly.
4. Discussion
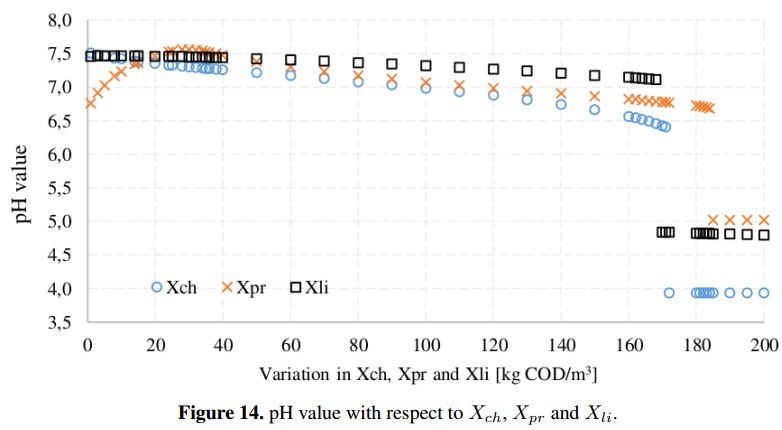
From the sensitivity analysis, the variables that proved to have a greater impact on methane production are the concentrations of proteins (Xpr), lipids (Xli) and carbohydrates (Xch) which depend partially from the input waste characteristics. However, simulations of the ADM1 show that care must be taken with the entry of the input variables due to very high values can overload the reactor. In addition, as is shown in the Figure 14 it is necessary to maintain the accumulation of acids under control because these concentrations may decrease the pH (under 6,5) and inhibit the AD process due to the interruption of the methanogens [19], [26]. For this reason, the pH must be continually monitored because it has a remarkable impact on the stability of the AD process by regulating the coexistence of microbial populations. It is important to note, that when the concentration of proteins and amino acids is very high, a toxic compound as ammonium may appear [5].
Another variable that demonstrated a representative impact on methane production was the temperature, which is considered by many authors as the most important variable to control the AD process. The temperature must be maintained at a constant value (fluctuations below 2˚C/day) to avoid the death of microorganisms [27]. On the other hand, although the increase of the temperature reduces the retention time and provides better degradative behavior [28], this implies a more robust control, an increase in the energy consumption, an increase in the concentrations of organic acids (which decrease the pH) and makes the process more vulnerable to inhibitors such as ammonia [27]. These factors collectively may decrease the efficiency of the AD process.
5. Conclusions
In this paper a sensitivity analysis of the anaerobic digestion model ADM1 including its 26 variables of the liquid phase and three variables of the gas phase (CH4, CO2 and H2) was presented. Input waste variables were varied individually using a Matlab R Simulink routine implemented by authors. Simulations show that most critical variables involved in the methane production are temperature (T), volumetric flow rate of substrates (Qin) and the concentrations of proteins (Xpr), lipids (Xli) and carbohydrates (Xch). For the analyzed cases, Xli and Xch increase the production of methane by more than 500 %, so in these variables should focus the characterization of waste input when the ADM1 is implemented.
The ADM1 facilitates the design of new biogas plants and allows validating hypothesis and optimizing designs. An example of the model versatility was showed in the Figure 12, where the maximum Qin to obtain the greatest amount of methane for the base case was calculated. Finally, inhibition due to reduction of pH and high ammonia concentration present as variables in the ADM1 establish operating limits for the process. These parameters are used to develop control strategies that maximize the biogas production. Furthermore, simulations show that the input concentrations should be carefully estimated because oversizing of these can cause erroneous results.
Finally, it is important to mention that some limitations during the development of this work were the lack of real data and the use of a steady state system for all simulations. In addition, to present the sensitivity analysis of ADM1 it was decided change the value of the input concentrations one at a time maintaining the other parameters equal to the base case. However, in the case of modifying several parameters at a time, the results are unknown. Future studies will be focused in analyze this topic.
References
[1] D. Batstone, J. Keller, I. Angelidaki, S. Kalyuzhnyi, S. Pavlostathis, A. Rozzi, W. Sanders, H. Siegrist, and V. Vavilin, "The IWA Anaerobic Digestion Model No 1 (ADM1).," Water Sci. Technol., vol. 45, no. 10, pp. 6573, Jan. 2002. 270, 272
[2] I. Ramírez, "Computation and implementation issues for biodiversity simulations with extended anaerobic digestion model no 1 (ADM1 N) in Matlab / Simulink," Rev. Invest. Univ. Quindío., vol. 24, no. 2, pp. 269279, 2013. 270, 272
[3] IWA Task Group for Mathematical Modelling of Anaerobic Digestion Processes, Anaerobic Digestion Model No. 1 (ADM1) Scientific and technical report, Ilustrada. IWA Publishing, 2002. 270, 271, 272
[4] T. Matsumoto and I. Sanches Ortiz, "Desempeno de la planta de tratamiento de aguas residuales de Sao Joao de Iracema (Brasil)," no. 176, pp. 176186, 2016. 270, 272
[5] U. Zaher, Modelling And Monitoring The Anaerobic Digestion Process In View Of Optimisation And Smooth Operation Of WWTPs. 2005. 270, 271, 272, 274, 279
[6] D. I. Page, K. L. Hickey, R. Narula, A. L. Main, and S. J. Grimberg, "Modeling anaerobic digestion of dairy manure using the IWA Anaerobic Digestion Model no. 1 (ADM1)," Water Sci. Technol., vol. 58, no. 3, pp. 689695, 2008. 270, 272, 274
[7] D. Gaida, "Dynamic realtime substrate feed optimization of anaerobic codigestion plants," Leiden University, 2014.271, 272, 278
[8] L. Xue, D. Li, and Y. Xi, "Nonlinear Model Predictive Control of anaerobic digestion process based on reduced ADM1," in Control Conference (ASCC), 2015 10th Asian, 2015, pp. 16 271, 272
[9] E. Cendales and S. Jimenez, "Modelamiento computacional de la producción de energía renovable a partir del biogas mediante la codigestión anaeróbica de la mezcla de residuos cítricos y estiercol bovino," Rev. EAN, no. 77, 4263, 2014.271, 272
[10] G. Lyberatos and I. V Skiadas, "Modelling of anaerobic digestion a review," Glob. NEST J., vol. 1, no. 2, pp. 6376, 1999.271, 272
[11] L. Yu, P. C. Wensel, J. Ma, and S. Chen, "Mathematical Modeling in Anaerobic Digestion (AD)," J. Bioremediation Biodegrad., vol. s4, no. 3, p. 12, 2013.271
[12] A. DonosoBravo, J. Mailier, C. Martin, J. Rodríguez, C. AcevesLara, and A. Vande Wouwer, "Model selection, identification and validation in anaerobic digestion: a review.," Water Res., vol. 45, no. 17, pp. 5347−64, Nov. 2011. 271
[13] E. Ficara, S. Hassam, A. Allegrini, A. Leva, F. Malpei, and G. Ferretti, "Anaerobic Digestion Models: a Comparative Study," Math. Model., vol. 7, no. 1, pp. 1052−1057, 2012.271
[14] F. Blumensaat and J. Keller, "Modelling of twostage anaerobic digestion using the IWA Anaerobic Digestion Model No . 1 ( ADM1 )," Water Res., vol. 39, no. 1, pp. 171−183, 2005. 271
[15] C. GarcíaDieguez, O. Bernard, and E. Roca, "Reducing the Anaerobic Digestion Model No. 1 for its application to an industrial wastewater treatment plant treating winery effluent wastewater.," Bioresour. Technol., vol. 132, no. 1, pp. 244−53, Mar. 2013. 271
[16] U. Zaher and S. Chen, "Interfacing the IWA Anaerobic Digestion Model No. 1 (ADM1) With Manure and Solid Waste Characteristics," in Proceedings of the Water Environment Federation, 2006, vol. 1, no. 1, pp. 3162−3175 271
[17] R. Girault, G. Bridoux, F. Nauleau, C. Poullain, J. Buffet, J. P. Steyer, a. G. Sadowski, and F. Beline, "A waste characterisation procedure for ADM1 implementation based on degradation kinetics," Water Res., vol. 46, no. 13, 4099−4110, 2012.271, 274
[18] C. Rosen and U. Jeppsson, "Aspects on ADM1 Implementation within the BSM2 Framework," Tech. Rep., pp. 1−37, 2008. 271, 272, 274, 276, 279
[19] S. K. Khanal, Anaerobic Biotechnology for Bioenergy Production: Principles and Applications, 1st ed. Iowa, Estados Unidos: WileyBlackwell, 2009.272, 273, 277, 278, 279
[20] C. Díaz Delgado, "Modelación matematica de plantas de tratamiento de lodos activados," in Agua potable para comunidades rurales, reuso y tratamientos avanzados de aguas residuales domesticas., 1st ed., RIPDACYTED, Ed. 2003, pp. 240−255. 274
[21] U. Jeppsson, "Investigation of Anaerobic Digestion Alternatives for Henriksdals WWTP," Lund, Sweden, 2007. 274, 275
[22] B. C. Lyseng, W. Bergland, F. Haugen, and R. Bakke, "Biogas reactor modelling with ADM1," Porsgrunn, Norway, 11/2012, 2012. 274
[23] A. Normak, J. Suurpere, K. Orupold, E. Jogi, and E. Kokin, "Simulation of anaerobic digestion of cattle manure," Agron. Res., vol. 10, no. SPEC. ISS. 1, pp. 167−174, 2012. 274
[24] A. Mottet, I. Ramirez, H. Carrere, S. Deleris, F. Vedrenne, J. Jimenez, and J. Steyer, "New fractionation for a better bioaccessibility description of particulate organic matter in a modified ADM1 model," Chem. Eng. J., vol. 228, pp. 871−881, Jul. 2013. 274
[25] U. Zaher, R. Li, U. Jeppsson, J.P. Steyer, and S. Chen, "GISCOD: general integrated solid waste codigestion model," Water Res., vol. 43, no. 10, pp. 2717−27, Jun. 2009.274
[26] B. Deepanraj, V. Sivasubramanian, and S. Jayaraj, "Biogas Generation through Anaerobic Digestion Process An Overview," vol. 18, no. 5, pp. 80−93, 2014.277, 279
[27] D. Batstone and P. Jensen, "Anaerobic processes," in Treatise on Water Science, P. Wilderer, Ed. Brisbane, Australia: Elsevier B.V., 2011, pp. 615−637.279, 280
[28] T. Al Seadi, D. Rutz, H. Prassl, M. Kottner, T. Finsterwalder, S. Volk, and R. Janssen, Biogas handbook, Teodorita. Esbjerg, Denmark: by University of Southern Denmark Esbjerg, Niels Bohrs Vej 910, 2008. 279
License
![]()
From the edition of the V23N3 of year 2018 forward, the Creative Commons License "Attribution-Non-Commercial - No Derivative Works " is changed to the following:
Attribution - Non-Commercial - Share the same: this license allows others to distribute, remix, retouch, and create from your work in a non-commercial way, as long as they give you credit and license their new creations under the same conditions.

2.jpg)