DOI:
https://doi.org/10.14483/23448393.3853Publicado:
2012-12-28Número:
Vol. 17 Núm. 2 (2012): Julio - DiciembreSección:
ArtículosReconstrucción Mejorada de Datos de Resonancia Magnética Mediante Aproximación por Descomposición por Valores Singulares
Improved MRI Reconstruction Using a Singular Value Decomposition Approximation
Palabras clave:
data reconstruction, denoising, magnetic resonance imaging, truncated SVD. (en).Palabras clave:
descomposición truncada de valores singulares, reconstrucción de datos, reducción del ruido, resonancia magnética. (es).Descargas
Referencias
D. J. Larkman, R. G. Nunes, “Parallel magnetic resonance imaging”, Physics in Medicine and Biology, Issue 52, R15-R55, 2007.
W. Chen, W. Duan, “Computational aspects of mathematical models in image compression”, Master's Thesis, Chalmers University of Technology, Goteborg, Sweden, 2009.
V. Patel, Y. Shi, P. H. Thompson, A. W. Toga, “K-SVD for HARDI denoising”, Proceedings of the 8th IEEE International Symposium on Biomedical Imaging (ISBI 2011), Chicago, United States, 2011.
F. Yaacoub, A. Abche, E. Karam, Y. Hamam, “MRI reconstruction using SVD in the least square sense”, Proceedings of the 21st IEEE International Symposium on Computer-Based Medical Systems, Jyväskylä, Finland, 2008.
M. Buehrer, K. Pruessmann, P. Boesiger, S. Kozerke, “Array compression for MRI with large coil arrays", Magnetic Resonance in Medicine, Volume 57, Issue6, pp. 1131-1139, 2007.
D. M. Lyra-Leite, J. P. C. L. da Costa, J. L. A. Carvalho, “Improved MRI reconstruction and denoising using SVD-based low-rank approximation”, Proceedings of the 2012 IEEE Workshop on Engineering Applications, 2012.
J.L.A. Carvalho, K.S. Nayak, "Rapid quantitation of aortic valve flow using spiral Fourier velocity encoded MRI", Aortic Valve, edited by Ying-Fu Chen and Chwan-Yao Luo, InTech, Rijeka, Croatia, 2011, pp. 3-28.
P. Suetens, Fundamentals of Medical Imaging, Second Edition, Cambridge University Press, Cambridge, United Kingdom, 2009.
S. Haykin, Adaptive Filter Theory, Third Edition, Prentice-Hall International, New Jersey, United States, 1993.
M. E. Wall, A. Rechtsteiner, L. M. Rocha, “Singular value decomposition and principal component analysis”, A Practical Approach to Microarray Data Analysis, edited by D. P. Berrar, W. Dubitzky, M. Granzowr, Kluwer, Norwell, Massachusetts, 2003, pp. 91-109.
M. Wax, T. Kailath, “Detection of signals by information theoretic criterion”, IEEE Transactions on Acoustics, Speech and Signal Processing, Volume 33, 1985, pp. 387-392.
H. Bozdogan, “Akaike's Information Criterion and Recent Developments on Information Complexity”, Journal of Mathematical Psychology, Volume 44, 2000 62-91.
K. P. Burnhamand, D. R., Anderson, “Multimodel inference: understanding AIC and BIC in Model Selection", Sociological Methods and Research, Volume 33, 2004, 261-304.
M. Pourhomayoun, M. Fowler, “An SVD approach for data compression in emitter location systems”, Proceedings of the 45th Asilomar Conference on Signals, Systems and Computers, Monterrey, United States, 2011.
Cómo citar
APA
ACM
ACS
ABNT
Chicago
Harvard
IEEE
MLA
Turabian
Vancouver
Descargar cita
IMPROVED MRI RECONSTRUCTION USING A SINGULAR VALUE DECOMPOSITION APPROXEMATION
RECONSTRUCCIÓN MEJORADA DE DATOS DE RESONANCIA MAGNÉTICA MEDIANTE APROXIMACIÓN POR DESCOMPOSICIÓN POR VALORES SINGULARES
Davi Marco Lyra-Leite, University of Brasília. Brasília-DF, Brazil. davi@ieee.org
João Paulo Carvalho Lustosa da Costa, University of Brasília. Brasília-DF, Brazil. joaopaulo.dacosta@ene.unb.br
João Luiz Azevedo de Carvalho, University of Brasília. Brasília-DF, Brazil. joaoluiz@pgea.unb.br
Recibido: 03/07/2012 - Aceptado: 15/11/2012
ABSTRACT
The reconstruction of magnetic resonance imaging (MRI) data can be a computationally demanding task. Signal-to-noise ratio is also a concern, especially in high-resolution imaging. Data compression may be useful not only for reducing reconstruction complexity and memory requirements, but also for reducing noise, as it is capable of eliminating spurious components.
This work proposes the use of a singular value decomposition low-rankapproximation for reconstruction and denoising of MRI data. The Akaike Information Criterion is used to estimate the appropriate model order, which is used to remove noise components and to reduce the amount of data to be stored and processed. The proposed method is evaluated using in vivoMRI data. We present images reconstructed using less than 20% of the original data size, and with a similar quality in terms of visual inspection. A quantitative evaluation is also presented.
Key words: data reconstruction, denoising, magnetic resonance imaging, truncated SVD.
RESUMEN
La reconstrucción de datos de resonancia magnética (RM) puede ser una tarea computacionalmente ardua. La razón señal-ruido también puede pre-sentar complicaciones, especialmente en imágenes de alta resolución. En este sentido, la compresión de datos puede ser útil no sólo para reducir la com-plejidad y los requerimientos de memoria, sino también para reducir el ruido, hasta inclusive permitir eliminar componentes espurios.
El presente trabajo propone el uso de un sistema basado en la descomposición por valores singulares de bajo orden para reconstrucción y reducción de ruido en imágenes de RM. El criterio de información de Akaike se utiliza para estimar el orden del modelo, que es usado para remover los componentes ruidosos y reducir la cantidad de datos procesados y almacenados. El método propuesto es evaluado usando datos de RM in vivo. Se presentan imágenes reconstruidas con menos de 20% de los datos originales y con calidad similar en cuanto a su inspección visual. Igualmente se presenta una evaluación cuantitativa del método.
Palabras clave: descomposición truncada de valores singulares, recons-trucción de datos, reducción del ruido, resonancia magnética.
1. INTRODUCTION
Magnetic resonance imaging (MRI) of living human tissue started in the 1970s with the introduction of gradient magnets fields, by Paul Lauterbur. Due to its recentness, MRI is a very fruitful area of research in the bioengineering and signal processing fields [1], as it addresses the problem of developing an imaging tool that does not use ionizing radiation, and enables further studies in the image reconstruction and data acquisition areas. The general MRI process is illustrated in Figure 1.
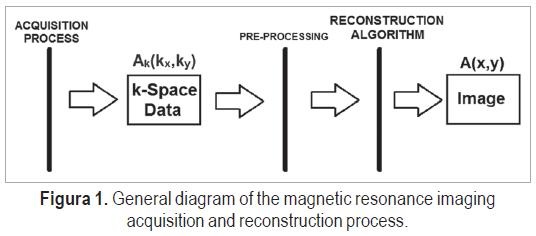
The image acquisition process can use one or multiple coils, different pulse sequences and magnetic fields gradients, and is currently a major field of research and work. The acquired data corresponds to the Fourier transform of the image, A(kx,ky), also called the k-space data. The image, A(x,y), is obtained using reconstruction algorithms, which are typically based on the inverse Fourier transform.
The data acquisition process usually focuses on reducing scan time in order to increase patient comfort and throughput, and to reduce motion artifacts. However, scan time reduction is generally associated with loss of signal-to-noise ratio (SNR). This issue is aggravated when high-resolution imaging is used, as a reduction in voxel size is generally associated with significantly lower SNR. A post-acquisition approach to improve SNR is to use data statistics in order to identify and remove noise components.
Singular value decomposition (SVD) is a well-known technique for data compression [2] and denoising [3]. Some applications have already been demonstrated for MRI, such as data reconstruction [4] and denoising [3]. In ref. [4], SVD with a least-squares criterion is used to replace the inverse Fourier transform. In ref. [3], SVD is used for denoising of diffusion images. In multi-channel MRI systems, SVD can also be used for coil compression [5]. SVD-based lowrank approximation can be applied either before image reconstruction - treating the data in k-space - or after reconstruction - dealing with the reconstructed image and aiming to reduce the required storage memory space.
This paper proposes the use of model order selection and decomposition schemes for MRI data reconstruction, based on the Akaike Information Criterion (AIC) and singular value decomposition. SVD is used to reduce the data volume and noise. By applying the AIC model order selection, we calculate the number of components necessary to represent the MRI data. This is an automatic criterion, which means that no human intervention or subjective analysis is necessary. Then, SVDbased low-rank approximation is used to reconstruct the MRI image from the reduced number of components. This has three benefits: (i) less data needs to be stored; (ii) less data needs to be reconstructed or processed; and (iii) noise is reduced. In order to validate this technique, both image and k-space domain denoising are evaluated and compared by means of both signal-to-error ratio (SER) and visual inspection. A preliminary report of this research was presented at the 2012 IEEE Workshop on Engineering Applications, held in Bogotá, Colombia [6].
The remainder of the paper is organized as follows. Section 2 reviews the basic principles of MRI and singular value decomposition. Section 3 introduces the problem, describes the proposed approach, and explains how SVD and AIC are used to achieve the desired results. In Section 4, the details of the method are presented. Section 5 discusses the results of truncated SVD appliedto an MRI anatomical brain image. Section 6 presents a final analysis of the results, as well as the conclusions and ideas for future work.
2. BASIC PRINCIPLES OF MRI AND SVD
In this section, we present the theoretical fundamentals of MRI, and the principles of SVD.
2.1. Magnetic resonance imaging
MRI is a non-invasive imaging technique that uses non-ionizing radiation in order to acquire anatomical and functional information of the human body. It is possible to use MRI in order to generate cross-sectional images in any plane (including oblique planes) [7] [8], and also to measure blood flow [7]. Data acquisition is based on the use of strong magnetic fields and pulses in the radio-frequency range in order to change nuclear spin orientation. Although this process is timeconsuming, it is harmless to the patient [7], which makes MRI a unique medical imaging modality.
An MRI scanner is composed of three important and different types of magnetic fields: a strong magnetic field, called B0; the magnetic field gradients, that allow slice selection and spatial encoding; and the magnetic field associated with a radio-frequency pulse, called B1 [7] [8].
The magnetic field B0 is produced by a superconductor magnet. It is always on, even when the scanner is not being used. It aligns hydrogen nuclei in the human body, and therefore generates a net magnetization of particles in the body. The spinning charged particles (spins) act like tiny bar magnets, and the net magnetization vector generated when they are aligned can be purposely perturbed. The net magnetization is proportional to the strength of the B0 field; therefore, MRI scanners with stronger magnetic fields (e.g., 3 Tesla) provide higher signal-to-noise ratio (SNR) [7].
The gradient coils, typically in the number of three (Gx, Gy and Gz), produce an intentional perturbation in the B0 field when turned on. Usually, they are designed so that the perturbation varies linearly along each spatial direction (x, y and z), and is not perceived at the iso-center of the magnet when the gradients are used. In the presence of an external magnetic field, the spins rotate about the axis of that field. B0 is (approximately) spatially uniform, so all spins initially rotate at the same frequency (the Larmor frequency), ω = γ • B, where γ is the gyromagnetic ratio (for hydrogen protons, γ = 42.57 MHz/T). Then, the gradients are played to make the magnetic field become spatially varying, and so to vary the rotation frequency of the spins. Therefore, Gx, Gy and Gz are used to frequency-encode (or phase-encode) spatial position along the x, y and z directions, respectively [7] [8].
The final major component of the MR scanner is the radio-frequency (RF) coil, which is used to transmit a RF “excitation” pulse to the body, and may also be used to receive the frequency-encoded signal from the “excited” portion of the body. In practice, independent coils may be used for transmission and reception. The RF pulse is typically modulated to the Larmor frequency. By definition, B0 is aligned with the z-axis, while B1, which is a very weak magnetic field associated with the RF pulse, is aligned with the x-axis. When the RF pulse is played, some of the spins, which are in resonance with the RF pulse - i.e., rotating at the RF pulse’s frequency -, begin to rotate around the x-axis (thus the name “magnetic resonance”). The RF pulse tilts the net magnetization towards the x-y plane, and the net magnetization will now have a component in the x-y plane (Mxy) [7].
The RF pulse is typically designed to have an approximately rectangular profile in Fourier domain, centered at the modulation frequency (e.g., a modulated windowed sinc). This implies that the RF pulse in fact contains a certain range of frequencies, thus all spins rotating within that range become “excited”, or tilted towards the x-axis. Thus, by playing gradient(s) of appropriate amplitude, and designing the RF pulse accordingly, one can excite only a thin slice of the body, which corresponds to the region containing all spins that are in resonance with the RF pulse’s range of frequencies.
When the RF pulse is turned off, Mxy begins to rotate (at the Larmor frequency) around the zaxis, as the net magnetization begins to realign with B0. This rotating magnetization generates an oscillating signal, which can be detected by the receive coil. The frequency content of the received signal can be used to obtain spatial information about the excited portion of the body. In order to frequency-encode spatial information, gradients are also played during signal acquisition; they are called readout gradients. For imaging a slice perpendicular to the z-axis (an axial image), Gz is played during excitation (for slice-selection), and Gx and Gy are played during acquisition. Gx,Gy, and Gz can be switched, for acquiring sagittal or coronal images, or all three gradients may be used during both excitation and acquisition for imaging oblique planes.
The acquired MRI signal at a particular time instant t corresponds to the sum of different sinusoidal signals generated by spins located at different regions of the body, each rotating at different frequencies, corresponding to their spatial locations. Using an axial acquisition, the demodulated signal is equivalent to a sample of the Fourier transform A(kx,ky) of the crosssectional image A(x,y):
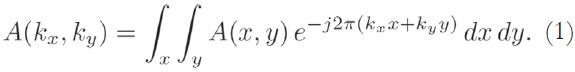
The Fourier coordinates kx and ky vary with time, according to:

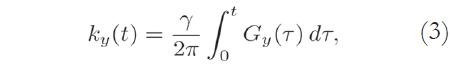
where Gx(t) and Gy(t) are time-varying magnetic field gradients along the x- and y-axes, respectively.
The A(x,y) image is reconstructed using a two-dimensional inverse Fourier transform along kx and ky. The k-space data is typically digitized and reconstructed on a computer. Therefore, the reconstructed MRI image corresponds to a matrix of grayscale pixel-intensity values, A.
The required coverage of k-space, and the number of samples, depends on the specified spatial resolution and field-of-view. For low spatial resolution imaging, only the central portion of kx-ky needs to be sampled. For higher spatial resolution, a portion of the periphery of k-space must also be covered. The field of view is associated with the spacing between samples. For a larger field-of-view, k-space needs to be more densely sampled, requiring an increased number of samples. If k-space is not sufficiently sampled, and the resulting field-of-view is not large enough to cover the entire object, overlap in spatial domain is observed (aliasing).
Because signal amplitude is lost as the net magnetization realigns with B0 (this is called relaxation), multiple acquisitions (excitation + readout) may be needed in order to cover the entire k-space. The fashion in which RF pulses and gradients are played is called pulse sequence.
2.2. Singular value decomposition
Considering the image matrix A, which is an M x N matrix of data, it is possible to obtain its singular values and singular vectors according to:


where U is an M x M matrix, S is an M x N diagonal matrix, V is an N x N matrix, and H denotes the Hermitian transpose operation. Assuming that the rank of the signal matrix A is r, and that M ≥ N, then r ≤ N. Equation (4) describes the singular value decomposition of A [9] [10].
The columns of U are called the left singular vectors, {uK}, and the columns of V correspond to the right singular vectors, {vK}. The elements of the diagonal matrix S are called the singular values. The singular values contain information about the importance of each vector - left singular and right singular - in spanning the signal space (or generating the MRI data, in this case), that is, how essential each component is for describing the data.
Furthermore, σm > 0 for 1 ≤ m ≤ r - where m is the candidate for the model order -, and σi = 0 for (r + 1) ≤ i ≤ N, and the singular values are ordered from the highest to the lowest. Therefore, this composition indicates that the singular values with the lowest indexes represent the more important components of the signal. Thus, it is possible to apply an algorithm in order to determine the model order and therefore reduce the number of components in the matrices U, S, and V, so as to recover the original data without significant loss of information, and possibly to reduce noise by removing components not related to the data [10].
In this paper, we propose the use of this decomposition scheme for reducing MRI data to be reconstructed. In order to correctly validate our analysis, we compare the results of SVD decomposition schemes considering the original signal (in k-space) and the reconstructed signal(in image domain).
3. PROBLEM STATEMENT
By applying the AIC, the number of singular values is estimated (which in turn determines its respective left and right singular vectors). Therefore, it is possible to use this number, also called “model order”, to represent the original data. The “principal components” are the singular values and singular vectors related to the model order. Using the principal components, one can increase the signal-to-error ratio in the reconstruction by removing noise components and, therefore, enhance the reconstructed image quality. Another interesting point is that with fewer components, the data require less physical memory for storage and/or less bandwidth for transmission.
3.1. Proposed SVD-based low-rank approximation via Akaike information criterion
The use of decomposition schemes enables us to select data from a given set of information and therefore identify which components are the most important for describing the original element. Data selection is a way of reducing noise from the acquired data based on its statistics and the distribution of its components. In this work, we analyze the singular value profile, obtained by singular value decomposition of any kind of complex rectangular matrices.
From the singular value matrix, it is possible to identify the model order and therefore apply a selection algorithm that deals only with the important information, i.e., the information that is required for characterizing the original data and necessary for image reconstruction. Furthermore, one can identify which singular value components correspond to noise, and remove them before recomposing the original image.
The optimal selection of the number of components is performed using a selection criterion, or — in image analysis — by visual inspection. However, the latter is a less general solution, because it is sensitive to subjective analysis and differs from person to person. Therefore, this option should be used only to refine the final result. In this work, the number of principal components is selected using an objective approach: the AIC.
3.2. Akaike Information Criterion
The Akaike Information Criterion is used to select the necessary number of components to describe a signal without loss of information. It is a mathematical criterion based on information theory, in which, given a set of candidate models for the data, the preferred model is the one with the minimum AIC value, where the AIC value is given by [12] [13]:

where k is the number of parameters in the statistical model, and L is the maximized value of the likelihood function for the estimated model.
For the proposed analysis, the AIC number is calculated according to [10]:
where M and N correspond to the image size, and m is the number of considered components — and therefore the value that must be found in order to minimize the expression —, g(m) is the geometric mean of the m smallest singular values of the data, and a(m) is the arithmetic mean of m smallest singular values. Note that the eigenvalues are the square of the singular values.
AIC(m) is calculated for several values of m. After finding the value of m that minimizes AIC(m), it is possible to find the model order, which is given by Ď = M - m[10]. The model order provides information about the minimum number of components that accurately represents the signal, and, therefore, allows us to discard the other components, which are considered noise. Thus, this algorithm is used to reduce the amount ofdata used for image reconstruction, and also for denoising.
3.3. Using the estimated model order for SVD-based low-rank approximation
After finding the optimal model order, we can reduce the singular value and singular vector matrices by selecting only the components that are important for describing the signal. For example, given a matrix A of size MxN, which is originally described as stated in equation (4) — where UMxM, SMxN, and VNxN —, then if the model order is D( 1 ≤ D ≤ min(M,N)), we can use only the highest Dsingular values and the first Dleft and right singular vectors to represent the original data. Therefore, we have:

where UD and VD contain the first D columns of U and V, respectively, and SD is the diagonal matrix with the D highest singular values. The process is also called low-rank approximation, or low-rank truncation.
In the next section, we evaluate the use of truncated SVD for representing single-coil, two-dimensional MRI data. The information is therefore in matrix form. SVD was applied in both k-space and image domains. Using the AIC, the singular value matrices are reduced to represent only meaningful and useful data. Finally, image reconstruction is performed and the results are compared both qualitatively and quantitatively.
4. METHODS
We performed reconstructions with data in both image and frequency domain, in order to compare their results and evaluate process differences. The obtained images were compared qualitatively (visual inspection) and quantitatively (signal-to-error ratio).
The data used in this work was downloaded from http://pgea.unb.br/~joaoluiz/pdf/wea2012davi.pdf. Figure 2 shows the image reconstructed from these data, using all components of its singular value matrix. Reconstruction was performed using an inverse two-dimensional discrete Fourier transform. This result will be used as ground-truth reference.
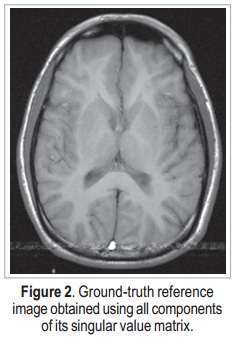
The image shown in Figure 2 is a 256 x 256 complex matrix, which generates 256 x 256 matrices U, S, and V. In order to verify the efficiency of the proposed method, random noise is added to the original data (in k-space) — which is already originally noisy, due to the acquisition process —, and then SVD is applied. Noise addition is done to both real and imaginary values of the k-space data, according to:

where n(kx,ky) are the zero mean i.i.d. additive Gaussian noise samples with variance σ2S=9.
The number of singular values used for reconstruction is selected both by using the Akaike information criterion and by visual inspection, in order to perform quantitative and qualitative analyses. In order to calculate the signal-to-error ratio, we use the following formula:
where X(x,y) is the ground-truth image, A(x,y) is the reconstructed image, and │·│ is the magnitude operator.
5. RESULTS
After applying the SVD, we obtain the singular value profiles for both k-space and image domains (Figure 3 and Figure 4, respectively). Both profiles are very similar, thus it is likely that the two approaches present similar results.
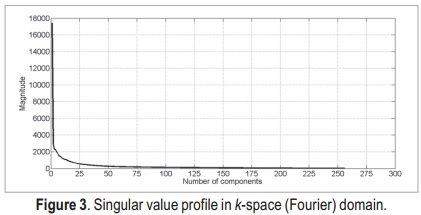
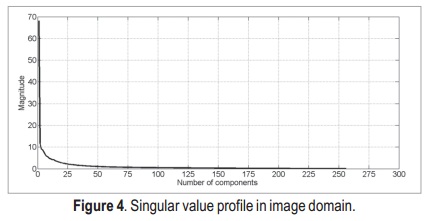
According to these profiles, the most important singular values lie in the first 50 components of data — they are the ones with stronger magnitude. Thus, by this simple analysis, it is possible to state that the singular values matrix which is originally a 256 x 256 matrix, can be reduced to a 50 x 50 matrix, without major loss of information.
This kind of reduction means dealing with less than one fifth of the data in each dimension of matrix S. Then, both U and V matrices can also be reduced and less data will be stored. The total compression ratio for the stored data is given by:
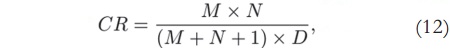
where M and N are the image size, and D is the model order [14]. Therefore, with M = N = 256 and D= 50, the compression ratio will be 2.6:1 — which means that the compressed data uses only 39% of the original memory.
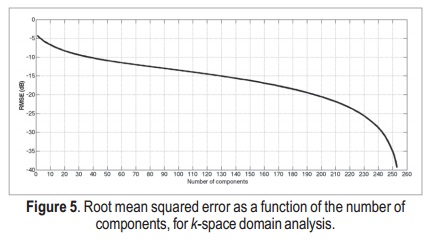
The reconstruction root mean squared error (RMSE) as a function of the number of components for k-space domain SVD is shown in Figure 5. With 50 components, the RMSE is about –11dB. This is a reasonably good threshold to be used in the proposed reconstructions, as we show next.
When applying the AIC for k-space domain, the selected number of components to be used for data reconstruction is 30, which is the value that minimizes the expression in equation (7). Therefore, matrices U, S, and V are 256 × 30, 30 × 30, and 256 × 30, respectively, and the compression ratio, according to equation (12), is CR = 4.3:1 — less than one quarter of the original size. The reconstructed image obtained using 30-coefficient truncated SVD in k-space domain is shown in Figure 6(a). The residual error between this result and the ground-tr uth reference is shown in Figure 6(b). Even though the error image presents coherent brain patterns, the SER is approximately 18.8 dB.
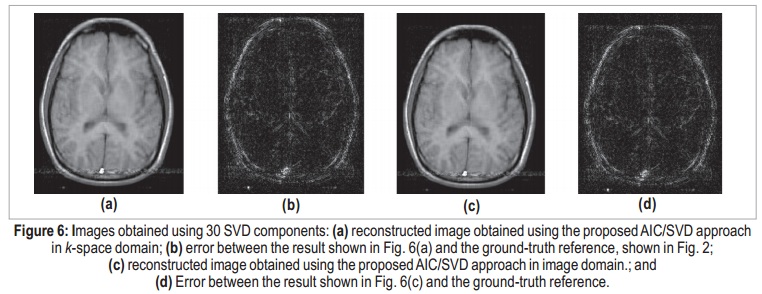
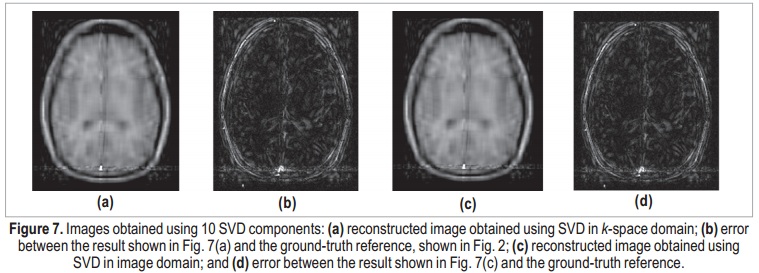
Applying the same process in image domain, it is possible to determine the number of essential image components. The AIC-determined number of components was the same: 30. The image obtained using 30-coefficient truncated SVD in image domain is shown in Figure 6(c), and its error in Figure 6(d). As expected, the two results can be considered identical. The maximum difference between k-space and image-domain reconstructed images is on the order of 10-14, which can be associated to quantization errors. Figure 7 shows the results using only 10 components, for both k-space and image-domain approaches. Both reconstructions present degraded results, and the denoising process is not effective. Here, meaningful data is interpreted as noise, and the error image is completely coherent with the actual image, which suggests that important components were discarded.
By comparing k-space domain and image domain truncated SVD results in terms of signal-to-error ratio, it can be concluded that both approaches are equivalent (Table I).
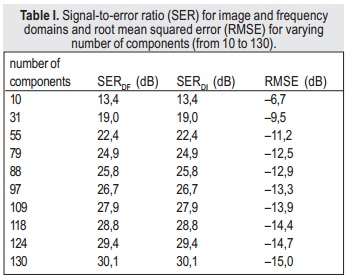
Thus, it is possible to implement the algorithm using either the k-space or image domain approaches, without loss of reconstruction quality. The results in Table I also show that the proposed approach performs quantitatively well, as the SER is higher than 10 dB even with a small number of components.
When using the AIC to select the number of components — 30, for both image and k-space domains — the SER is 18.8 dB, which is an acceptable result. However, when computational effort is not an issue, it is possible to use a higher number of components in order to achieve higher SER. For example, using 128 components (half of the original number) will result in greater computational complexity, because larger matrices are used; however, the SER will be 29.8 dB, and the denoising process is still performed, as non-meaningful data is removed.
The memory storage as a function of the number of components is shown in Figure 8.
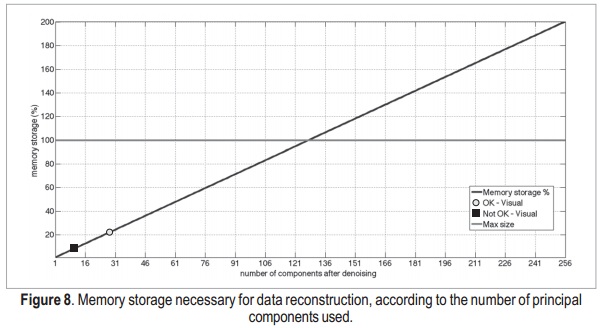
Using the AIC, the reconstruction process uses 23.5% of the memory used to reconstruct the image with all components. However, the result is very similar to the ground-truth reference, as previously shown. Then, in addition to reducing noise in the images, the use of SVD reduces the amount of memory necessary to store the data. Therefore, it may be useful when dealing with high-resolution, multi-channel and/or multi-dimensional MRI data, which are very large compared to two-di-mensional data corresponding only to simple anatomical information. Using a qualitative analysis, it was possible to select points where the data becomes visually similar to the original image, and where a visually accurate image was obtained.In this analysis, these points correspond to 10 (red dot) and 28 (green dot) components, respectively.
6. CONCLUSION
The results suggest that truncated SVD works for MRI data and can improve its reconstruction by reducing noise, and by making the reconstruction process less computationally demanding. The results also showed that reconstruction after decomposition in k-space and image domains can be considered equal for both quantitative and qualitative analysis.
The use of a larger number of components generally presents better results. However, when using all components, the image is reconstructed with its noise elements. Therefore, it is interesting to perform model order selection and singular value decomposition low-rank truncation in order to represent the data with only meaningful information.
In future works, we plan to address the following aspects: (i) use of high order SVD so as to evaluate the reduction of noise components in temporally-resolved or tridimensional MRI data; (ii) use of SVD for coil compression for parallel MRI data; and (iii) use of other principal component analysis techniques.
Acknowledgements
Lyra-Leite received a Scientific Initiation Fellowship from the Brazilian National Council of Technological and Scientific Development (CNPq). This project was funded by a grant from the Brazilian Ministry of Science and Technology (MCT/CNPq 14/2010).
REFERENCES
- D. J. Larkman, R. G. Nunes, “Parallel magnetic resonance imaging”, Physics in Medicine and Biology, Issue 52, R15-R55, 2007.
- W. Chen, W. Duan, “Computational aspects of mathematical models in image compression”, Master’s Thesis, Chalmers University of Technology, Goteborg, Sweden, 2009.
- V. Patel, Y. Shi, P. H. Thompson, A. W. Toga, “K-SVD for HARDI denoising”,Proceedings of the 8th IEEE International Symposium on Biomedical Imaging (ISBI 2011), Chicago, United States, 2011.
- F. Yaacoub, A. Abche, E. Karam, Y. Hamam, “MRI reconstruction using SVD in the least square sense”,Proceedings of the 21st IEEE International Symposium on Computer-Based Medical Systems, Jyväskylä, Finland, 2008.
- M. Buehrer, K. Pruessmann, P. Boesiger, S. Kozerke, “Array compression for MRI with large coil arrays”, Magnetic Resonance in Medicine, Volume 57, Issue6, pp. 1131-1139, 2007.
- D. M. Lyra-Leite, J. P. C. L. da Costa, J. L. A. Carvalho, “Improved MRI reconstruction and denoising using SVD-based low-rank approximation”,Proceedings of the 2012 IEEE Workshop on Engineering Applications, 2012.
- J.L.A. Carvalho, K.S. Nayak, “Rapid quantitation of aortic valve flow using spiral Fourier velocity encoded MRI”, Aortic Valve, edited by Ying-Fu Chen and Chwan-Yao Luo, InTech, Rijeka, Croatia, 2011, pp. 3-28.
- P. Suetens, Fundamentals of Medical Imaging, Second Edition, Cambridge University Press, Cambridge, United Kingdom, 2009.
- S. Haykin, Adaptive Filter Theory, Third Edition, Prentice-Hall International, New Jersey, United States, 1993.
- M. E. Wall, A. Rechtsteiner, L. M. Rocha, “Singular value decomposition and principal component analysis”, A Practical Approach to Microarray Data Analysis,edited by D. P. Berrar, W. Dubitzky, M. Granzowr, Kluwer, Norwell, Massachusetts, 2003, pp. 91-109.
- M. Wax, T. Kailath, “Detection of signals by information theoretic criterion”, IEEE Transactions on Acoustics, Speech and Signal Processing, Volume 33, 1985, pp. 387-392.
- H. Bozdogan, “Akaike’s Information Criterion and Recent Developments on Information Complexity”, Journal of Mathematical Psychology, Volume 44, 2000 62-91.
- K. P. Burnhamand, D. R., Anderson, “Multimodel inference: understanding AIC and BIC in Model Selection”, Sociological Methods and Research, Volume 33, 2004, 261-304.
- M. Pourhomayoun, M. Fowler, “An SVD approach for data compression in emitter location systems”, Proceedings of the 45th Asilomar Conference on Signals, Systems and Computers, Monterrey, United States, 2011.

This work is authorized by an Attribution-NonCommercial-NoDerivs CC BY-NC-ND license..
Licencia
![]()
A partir de la edición del V23N3 del año 2018 hacia adelante, se cambia la Licencia Creative Commons “Atribución—No Comercial – Sin Obra Derivada” a la siguiente:
Atribución - No Comercial – Compartir igual: esta licencia permite a otros distribuir, remezclar, retocar, y crear a partir de tu obra de modo no comercial, siempre y cuando te den crédito y licencien sus nuevas creaciones bajo las mismas condiciones.

2.jpg)