DOI:
https://doi.org/10.14483/23448393.21930Published:
2025-03-30Issue:
Vol. 30 No. 1 (2025): January-AprilSection:
Computational IntelligenceDeep Learning and Time Series for the Prediction of Monthly Precipitation. A Case Study in the Department of Boyacá, Colombia
Aprendizaje profundo y series temporales para la Predicción de la Precipitación Mensual. Estudio de caso: Departamento de Boyacá-Colombia
Keywords:
deep learning, neural networks, LSTM, ConvLSTM, time series (en).Keywords:
aprendizaje profundo, redes neuronales, LSTM, ConvLSTM, series temporales (es).Downloads
References
C. E. González Orozco, M. Porcel, D. F. Alzate Velásquez, and J. O. Orduz Rodríguez, "Extreme climate variability weakens a major tropical agricultural hub," Ecol. Ind., vol. 111, art. 106015, Apr. 2020. https://doi.org/10.1016/j.ecolind.2019.106015
H. Tarwani, Sh. Patel and P. Goel, " Deep learning approach for weather classification using pre-trained convolutional neural networks," Procedia Computer Science., vol. 252, no. 3, pp. 136-145, 2025. https://doi.org/10.1016/j.procs.2024.12.015
D.A. Moreno Gaona, M.E. Morales Puentes, J.E Gil Nova, and J.D Mercado Gómez, " Structure of bryophyte communities in the paramo complexes of Boyacá-Colombia," Revista de Biología Tropical, vol 71, no. 1, pp. 1-13, 2023. https://doi.org/10.15517/rev.biol.trop..v71i1.53584
J. C. Valderrama Balaguera, H. F. Castro Silva, and C. A. Dávila Carrillo, " Pronósticos de variables climatológicas mediante los modelos de punto de cambio y Holt-Winters," Mundo FESC, vol. 11(S2), pp. 337-352, 2021. https://doi.org/10.61799/2216-0388.986
F. Rezaei Aderyani, S. Jamshid Mousavi, F. Jafari, "Short-term rainfall forecasting using machine learning-based approaches of PSO-SVR, LSTM and CNN," Journal of Hydrology., vol. 614, pp. 789-805, 2022. https://doi.org/10.1016/j.jhydrol.2022.128463
E. Morales Rojas, E. A. Díaz Ortiz, L.M. García, and M.E. Milla Pino, "Pronóstico de precipitaciones mensuales: Un estudio de caso en las comunidades nativas del Perú," Revista Cientifica Pakamuros, vol. 9, no. 3, pp. 71-85, 2021. https://doi.org/10.37787/13azmg02
D. M. Herrera Posada and E. Aristizábal, "Artificial intelligence and machine learning model for the spatial and temporal prediction of drought events in the department of Magdalena, Colombia," INGE CUC, vol. 18, no. 2, pp. 249-265, 2022. https://doi.org/10.17981/ingecuc.18.2.2022.20
B. Zhao, H. Lu, S. Chen, J. Liu, and D. Wu, "Convolutional neural networks for time series classification," Journal of Systems Engineering and Electronics, vol. 28, no 1, pp. 162-169, 2017. https://doi.org/10.21629/JSEE.2017.01.18
C. Wang, G.Tang, W. Xiong, Z. Ma, S. Zhu, "Infrared precipitation estimation using convolutional neural network for FengYun satellites," Journal of Hydrology., vol. 603, pp. 1-12, 2022. https://doi.org/10.1016/j.jhydrol.2021.127113
A. Fahim, Q. Tan, M. Mazzi, Md. Sahabuddin, B. Naz and S. Ullah Bazai. Hybrid LSTM Self-Attention Mechanism Model for Forecasting the Reform of Scientific Research in Morocco,” Computational Intelligence and Neuroscience., vol. 2021, pp. 1-14, 2021. https://doi.org/10.1155/2021/6689204
T. Nan, W. Cao, Z. Wang, Y. Gao, L. Zhao, X. Sun, and J. Na, "Evaluation of shallow groundwater dynamics after water supplement in North China Plain based on attention-GRU model," J. Hydrol., vol. 625, pp. 128-145, 2023. https://doi.org/10.1016/j.jhydrol.2023.130085
CHIRPS, "data.chc.ucsb.edu," [Online]. Available: https://data.chc.ucsb.edu/products/CHIRPS-2.0/global_daily/netcdf/p05/
Y. E. D. Prieto, "Rainfall data for the department of Boyacá," Kaggle, 2023. [Online]: Available: https://www.kaggle.com/datasets/estebanduarte/rainfall-data-for-the-department-of-boyaca
How to Cite
APA
ACM
ACS
ABNT
Chicago
Harvard
IEEE
MLA
Turabian
Vancouver
Download Citation
Recibido: 11 de julio de 2023; Revisión recibida: 16 de octubre de 2024; Aceptado: 5 de noviembre de 2024
Abstract
Context:
This paper proposes a method for the prediction of monthly precipitation in the department of Boyacá using models based on deep neural networks (DNNs). These approaches have achieved significant improvements in prediction accuracy when compared to traditional methods.
Method:
Data with a spatial resolution of 0.5° were extracted from CHIRPS 2.0 and subsequently preprocessed for the implementation of two approaches based on recurrent neural networks (RNNs) with long short-term memory (LSTM) and ConvLSTM architectures, aiming to provide accurate predictions of monthly precipitation in the studied region.
Objectives:
The goal of this time series analysis is to predict monthly precipitation and develop accurate models that can forecast future rainfall patterns based on historical data. This aids in water resource management and agricultural planning, as well as in mitigating the impacts of droughts or floods.
Results:
According to the results obtained, the LSTM model stands out for its robustness in terms of performance metrics, such as a lower mean squared error, a lower root mean squared error, and a coefficient of determination closer to 1. This demonstrates its higher accuracy compared to the ConvLSTM model.
Conclusions:
Deep learning models, especially RNNs with LSTM, are effective tools for predicting crucial climate data.
Acknowledgments:
The authors would like to thank the Research Vice-Principalship of Universidad Pedagógica y Tecnológica de Colombia for funding project SGI 3535.
Keywords:
deep learning, neural networks, LSTM, ConvLSTM, time series.Resumen
Contexto:
Este trabajo propone un método para la predicción de la precipitación mensual en el departamento de Boyacá utilizando modelos basados en redes neuronales profundas (DNNs). Estos enfoques han logrado mejoras significativas en la precisión de la predicción en comparación con los métodos tradicionales.
Método:
Datos con una resolución espacial de 0.5° fueron extraídos de CHIRPS 2.0 y posteriormente preprocesados para la implementación de aproximaciones basadas en redes neuronales recurrentes (RNNs) con memoria de largo plazo (LSTM) y ConvLSTM para proporcionar predicciones precisas de precipitación. mensual en la región.
Objetivos:
El objetivo de este análisis de series temporales es predecir la precipitación mensual y desarrollar modelos precisos que pronostiquen los patrones de precipitación futuros basándose en datos históricos. Esto contribuye a la gestión de los recursos hídricos, la planificación agrícola y la mitigación de los efectos de sequías o inundaciones.
Resultados:
Los resultados obtenidos muestran que el modelo LSTM se destaca por su robustez en términos de métricas de rendimiento, tales como un menor error cuadrático medio, una menor raíz del error cuadrático medio y un coeficiente de determinación más cercano a 1. Esto demuestra su mayor precisión en comparación con el modelo ConvLSTM.
Conclusiones:
Los modelos de aprendizaje profundo, especialmente los modelos RNN con LSTM, son herramientas eficaces para predecir datos climáticos cruciales.
Agradecimientos:
Los autores agradecen al Vicerrectorado de Investigación de la Universidad Tecnológica de Pereira por la financiación del proyecto SGI 3535.
Palabras clave:
aprendizaje profundo, redes neuronales, LSTM, ConvLSTM, series temporales.1. Introduction
Precipitation is an essential factor that influences various aspects of life, from water resource management to decision-making in multiple sectors such as agriculture 1. In this context, understanding and analyzing precipitation patterns over time can answer crucial questions: What are the wettest and driest months in a given region? How is precipitation distributed in different geographical areas? What are the climatic trends of a given region? 2.
The department of Boyacá, Colombia, is characterized by its climatic variability and importance in agriculture and water resource management 3. The lack of accurate precipitation forecasts can have a significant impact on decision-making in sectors such as agriculture, aqueduct management, and water supply planning 4. These sectors could benefit from decision-making based on accurate data and reliable precipitation predictions, which in turn can have a positive impact on economic and environmental sectors.
The central problem addressed in this document is not only limited to the need to accurately predict monthly precipitation in the department of Boyacá; it also involves every aspect of the process, from collecting data to selecting the methods, algorithms, and metrics used to make predictions.
Regarding data collection, historical precipitation data were extracted from the CHIRPS 2.0 dataset, which has a spatial resolution of 0.5°. The selection of this data source was based on the quality and availability of the information, which is essential to ensuring accurate predictions.
Regarding the methods and algorithms used, we decided to implement LSTM and ConvLSTM neural networks. This choice was based on the nature of the collected monthly precipitation data, which exhibit temporal and spatial patterns 5. The use of these specific methods allowed capturing these patterns effectively, which was essential in generating accurate forecasts.
Finally, the selection of suitable evaluation metrics (MSE, RMSE, R2) played an essential role in the project. These metrics were chosen for the purpose of objectively measuring the accuracy and predictive capacity of the models, providing a solid basis for evaluating their performance.
The contribution of this work lies in the application of models based on LSTM and ConvLSTM neural networks in the prediction of monthly precipitation in the department of Boyacá. To this effect, the performance of said models was evaluated in terms of precision metrics and predictive capacity, providing an interactive visual representation of historical data and predicted values through a visualization scheme, thereby contributing to decision-making oriented to sectors such as agriculture and water resources management in the department.
This article is structured as follows. It begins with the Background section, which contextualizes the issue of precipitation forecasts in Boyacá. Then, the Model development section details the models used. This is followed by a description of the Evaluation metrics that were used to evaluate their performance. Next, in the Results and discussion section, the results obtained by the models are presented. Then, the Data visualization section introduces an interactive Power BI dashboard to visualize historical data and predictions. In addition, two specific test cases are examined. Finally, the Conclusions and future work section summarizes the main conclusions and proposes future lines of research in the field of climate forecasting in Boyacá.
2. Background
Monthly precipitation predictions are crucial in various applications such as water management, agricultural planning, and natural disaster forecasting 6. In recent years, deep learning has proven its worth in predicting climatic events 7, including precipitation. This section analyzes the most relevant literature on the use of deep learning in this field.
Convolutional neural networks (CNNs) have been used to analyze climatic maps and extract relevant spatial characteristics to predict monthly precipitation 8. Furthermore, CNNs can capture complex patterns in climate data by applying convolution operations 9. Using temperature, atmospheric pressure, and humidity data, CNNs can identify significant spatial correlations that influence precipitation. A study by 10 applied a CNN architecture to predict precipitation in China, exhibiting high precision. The results showed a significant improvement in predictive ability compared to traditional methods.
Recurrent neural networks (RNNs) have also been shown to be effective in time series prediction, including the specific case of monthly precipitation. According to 11, RNNs can model temporal dependencies through recurring connections, which allows them to capture patterns over time in climate data.
The use of deep learning through approaches such as CNNs, RNNs, and GAN has proven its effectiveness in predicting monthly precipitation 12. These approaches have achieved significant improvements in prediction accuracy when compared to traditional methods. However, there are still challenges that need to be addressed, such as the interpretation of deep learning models and the uncertainty associated with the predictions.
In summary, the use of deep learning in the prediction of monthly precipitation has shown promise. Approaches based on CNNs, RNNs, and GANs have achieved significant improvements in prediction accuracy and in the generation of realistic climate data. However, more research is needed to improve the interpretation of the models and address the challenges associated with uncertainty and generalizability. Deep learning has the potential to revolutionize monthly precipitation prediction and provide valuable information for decision-making in various areas of application.
3. Materials and methods
This section describes the methodology for monthly precipitation analysis implemented in our research. In addition, the materials, methods, and tools applied are presented.
3.1. Case study
This project was carried out in the department of Boyacá, which is located in the center of Colombia, specifically in the Andean region. Boyacá is known for its agricultural activity, which highlights the importance of precipitation forecasting in decision-making concerning this sector as well as water resources management. Fig. 1 shows the geographical location of Boyacá in Colombia.
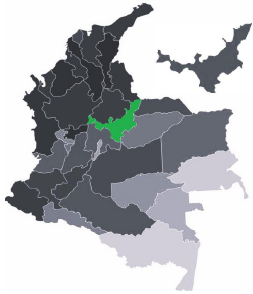
Figure 1: Geographic location of the department of Boyacá
3.2. Information flow
Our work began with the extraction of climate files from CHIRPS 2.0, covering precipitation records from 1981 to May 2023, with a spatial resolution of 0.05°. Data preparation included monthly consolidation and outlier retention. Fig. 2 shows the workflow applied in creating the prediction models.
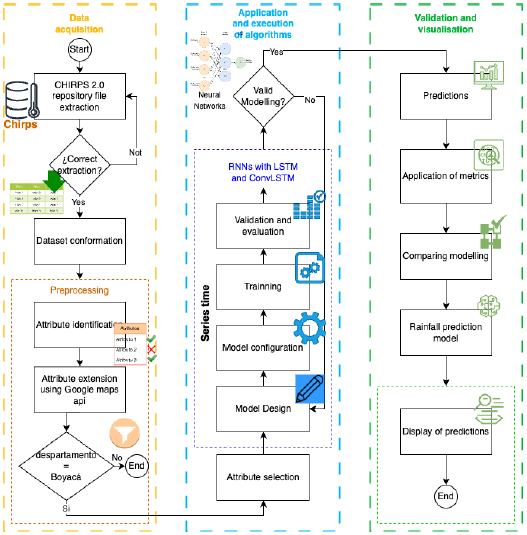
Figure 2: Workflow of the model
Afterwards, the databases were merged, and geographic filtering was performed to obtain the records for Boyacá. It is worth highlighting that, in attribute selection, the latitude, longitude, and date (year and month) are fundamental to considering local and temporal variations in precipitation forecasts.
Finally, regression models based on RNNs with LSTM and ConvLSTM layers were applied to predict monthly precipitation. These models were trained and validated using metrics such as the mean squared error (MSE) and the coefficient of determination (R2).
As previously mentioned, Fig. 2 shows the information flow used, which is divided into three main
phases:
-
Data acquisition
-
Application and execution of algorithms
-
Validation and visualization
3.2.1. Data acquisition
For this task, files were downloaded from a web repository that contains links to climate files in netCDF format (.nc). Libraries such as requests and BeautifulSoup were used to request the web page and analyze its content. Then, each file identified in the links was downloaded and stored.
This work used precipitation data from CHIRPS 2.0 (i.e., Climate Hazards Group InfraRed Precipitation with Station data, version 2.0) 13, a recognized source in global climate research. The data, with a spatial resolution of 0.05°, span from 1981 to May 2023. These data were preprocessed by consolidating precipitation values on a monthly basis through the sum of daily data, which allowed for a more relevant analysis of climatic trends over the course of the months. To this effect, daily data from 1981 were downloaded and combined into netCDF files (.nc) in order to facilitate processing.
3.2.2. Dataset conformation
Daily precipitation data from various CHIRPS 2.0 sources were consolidated and organized to establish a consistent data structure. This integration enabled a complete view of the precipitation records over time in the department of Boyacá, improving the understanding of its climatic patterns. The .nc files were loaded with precipitation data from 1981 to May 2023, the necessary fields were selected, and they were combined into a single dataset.
3.2.3. Preprocessing
The geospatial data contained in the netCDF files were processed. The workflow began by uploading the files downloaded from CHIRPS 2.0. Then, through the Google Maps API, the municipality and the department were obtained from the geographical coordinates, which provided additional information on the geographical points of interest for later filtering, leaving only the data for the department of Boyacá and finally storing them in a new netCDF file.
It is important to note that, at this stage of preprocessing, no data cleansing had been performed which involved the elimination of outliers or other irregularities. This decision was based on the consideration that outliers may be inherently significant to the climatic and geographic context of Boyacá. For example, they may indicate particular conditions in páramo areas or other specific weather events. Maintaining these values in the dataset contributes to a more accurate and authentic representation of the actual climatic conditions in the region.
3.2.3.1 Geographic filtering
To exclusively limit the analysis to the department of Boyacá, a rigorous geographic filtering process was implemented. This process was carried out using the Google Maps API and the Geopandas library, which made it possible to obtain the geographical coordinates of specific points in the department. Through this method, it was possible to identify and retain only the records related to the region of interest, excluding data from other geographic locations.
3.2.4. Feature selection
In analyzing information and making predictions, the characterization and description of the different characteristics that make up the data play a fundamental role. Each attribute not only represents an inherent feature of the information but also contributes significantly to the conclusions and predictions derived from the analysis. In the context of monthly precipitation prediction, the accurate identification and characterization of properties is essential to understanding the underlying causes that influence precipitation patterns, ultimately improving the accuracy of predictive models.
Table I describes the variables used in constructing the models for precipitation prediction. Each variable is detailed in terms of its data and variable type, and a brief description of its relevance in the climatic context is provided. These variables play a key role in the forecasting process and provide a better understanding of local and seasonal weather patterns.
Table I: Variables used in the construction of the models
Variables used in the construction of the models
Variable
Data type
Description
Latitude
Numerical
North/South coordinate
Length
Numerical
East/West coordinate
Time
Date
Represents the date of the measurement record.
Precipitation
Numerical
Amount of precipitation in millimeters
Municipality
Categorical
Name of the geographic location where the data were recorded
Each of the identified attributes has a unique role in the construction and validation of predictive models. Their selection and characterization allow understanding the complex relationships between different spatiotemporal factors and how they influence precipitation patterns. These attributes are fully considered in the creation of models that can capture variability and trends in precipitation data, ultimately leading to more accurate and informed predictions.
3.2.5. Feature scaling
The feature scaling technique was applied to ensure that all features were on the same scale before entering them into the machine learning models. The StandardScaler method was used, which transforms each feature in such a way that it has a mean of 0 and a standard deviation of 1, thus achieving a uniform scale and an adequate distribution. Table II presents a detailed description of this technique, its purpose, its benefits, and its importance in the analysis of climate data.
Table II: Feature scaling technique
Feature
Description
Scaling technique
StandardScaler
Description of the technique
It transforms each feature so that it has a mean of 0 and a standard deviation of 1.
Purpose
To make sure that all the features are on the same scale before entering them into the models.
Benefits
It prevents a given feature from being disproportionately weighted due to its magnitude, ensuring that all features are regarded as equally important in the analysis.
Importance
It ensures that machine learning models are able to capture the relationships between variables effectively and that differences in scales do not negatively affect the quality and accuracy of predictions.
3.3. Regression model applied to time series
In this section, the regression methodology used for climate analysis is described, which uses RNNs with LSTM and ConvLSTM layers. These architectures were specifically adapted to predict precipitation in the department of Boyacá and are widely used in sequential and spatial data processing.
3.3.1. Model architecture
Fig. 3 provides an overview of the architecture used in the models based on RNNs with LSTM (long short-term memory) and ConvLSTM layers, which were designed to address a regression problem related to precipitation prediction. This architecture was configured to model and anticipate monthly precipitation data in a geospatial context.
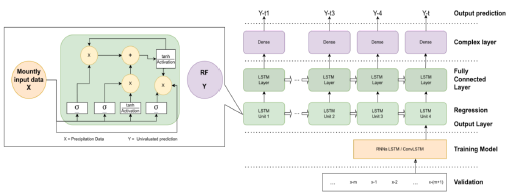
Figure 3: Architecture of the proposed model
This graphical representation clearly illustrates the main layers and components of the neural network, including the LSTM input layer, the dense output layer, and the way in which they are connected to each other. Through this graphical representation, the flow of data is shown as it is processed and propagated throughout the network.
3.3.2. RNNs with LSTM
In implementing the model based on RNNs with LSTM layers, the main objective was to capture temporal patterns in monthly precipitation data for the department of Boyacá. Here is a detailed description of the architecture and design decisions of the model:
⇒ LSTM layer with 64 units: The selection of an LSTM layer with 64 units was based on the complexity of the studied problem. In forecasting precipitation, it is crucial to capture the complex temporal relationships present in the data. By using 64 units in this layer, the model is allowed to effectively learn these relationships. However, the risk of overfitting should be taken into account, so this number of units is considered to be an appropriate balance.
⇒ ReLU (rectified linear unit) activation function: A ReLU activation function was applied to this LSTM layer since it introduces nonlinearities into the model and allows the network to capture temporal and nonlinear relationships efficiently. This is essential for understanding and predicting complex weather patterns.
⇒ Dense output layer: A dense layer was used with a single unit in the output, since the main task is a regression that seeks to predict a continuous value, i.e., the precipitation level. A single unit in the output layer is sufficient to generate this prediction.
⇒ Adam optimizer and MSE loss function: To adjust the model weights during training, the Adam optimizer was selected. Adam is an efficient and effective choice that is well-suited for a variety of machine learning problems. As for the loss function, the MSE was chosen.
Instead of a time window, each data point was considered independently, and predictions were made for the next 12 months starting in June 2023. The dataset was divided into 80 % for training and 20 % for testing in order to avoid overfitting.
3.3.3. ConvLSTM neural network
A ConvLSTM neural network model was designed with the objective of capturing spatial-temporal patterns in precipitation data partitioned into 80 % for training and 20 % for testing. The specific design decisions are detailed below:
⇒ ConvLSTM layer with 64 filters and a kernel of size (1, 3): This choice was based on the need to incorporate both spatial and temporal information in the modeling process. The decision to use 64 filters allowed the model to detect a variety of spatial characteristics and patterns in the data, while the kernel of size (1,3) was used to apply convolutions on the time axis (months), thus capturing temporal patterns in three-month windows.
⇒ Flatten layer: After the ConvLSTM layer, a flatten layer was applied to transform the data into a format suitable for the dense layer. This was necessary because the ConvLSTM layer produces outputs in 2D format, while the dense layer requires inputs in 1D format to make predictions.
⇒ Dense layer and optimization: Similar to the approach used in the LSTM model, a dense layer with a single unit was incorporated to make the final prediction. The Adam optimizer and the MSE loss function were also selected since they have proven to be effective in model compilation and parameter adjustment.
3.4. Evaluation metrics
Once the preprocessing of the data and the construction of the forecasting models had been completed, the models were validated and evaluated to ensure that they were capable of providing valid monthly precipitation predictions for the department of Boyacá. To this effect, metrics and visualization techniques were used, aiming to evaluate the performance and quality of the models.
3.4.1. MSE
This metric has become a fundamental tool in evaluating the precision of precipitation prediction models. Eq. (1) allows measuring how close the model predictions are to the actual precipitation values in a dataset.
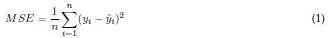
where
→ MSE represents the mean squared error, a numerical value that indicates how much the predictions of the model vary with respect to the actual precipitation data.
→ n represents the total number of observations in the dataset. These observations correspond to precipitation measurements from different locations and times.
→ i represents the real precipitation value of observation i.
→ ŷ i denotes the predicted precipitation level that the model has generated for observation i.
The MSE provides a quantitative measure of how accurate the precipitation prediction model is. The lower the MSE value, the closer the model predictions to the actual precipitation data. This means that minimizing the MSE would improve the model's ability to accurately predict the precipitation level at different locations and times.
3.4.2. Root mean squared error (RMSE)
This is a metric that is derived directly from the MSE and is used to evaluate the quality of model predictions. It provides a more interpretable measure of the magnitude of the average error between the predictions and the actual values.
The RMSE formula is as follows:

→ The RMSE represents the root mean squared error, a numerical value that indicates how much the model predictions deviate from the actual precipitation measurements on average.
Unlike the MSE, which measures the error on a square scale, the RMSE provides a more intuitive and practical assessment of prediction quality. In summary, the RMSE is valuable for understanding how close or far the model predictions are from the actual precipitation values in terms of the amount of rainfall measured.
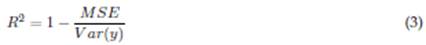
3.4.3. R2
The coefficient of determination (R2) indicates how well the model's predictions fit the actual variability regarding the amount of rainfall. An R2 value close to 1 suggests that the model is effective in capturing and explaining most variations in the precipitation data.
In Eq. (3), the MSE of the model is compared against the variance of the actual precipitation values, i.e., Var(y). The difference between the two provides a measure of the quality of the model in terms of its ability to explain data variability.
3.4.4. Residuals
The residuals indicator denotes the difference between the predictions and the actual values (residuals) based on observations. It is essential to identify any systematic patterns in the errors of the model. If the residuals are randomly scattered around 0 and show no discernible pattern, this suggests that the model is adequate for the data. However, if patterns are observed in the residuals, it may be necessary to review and adjust the model.
4. Results and discussion
4.1. Applying time series in the development of the models
In this project, time series play an essential role regarding the prediction of monthly precipitation data for the department of Boyacá. This section outlines how time series were applied in the development of the forecasting model.
⇒ Temporal aggregation: The daily data collected (from 1981 to May 2023) were aggregated in monthly time series, highlighting seasonal and annual patterns.
⇒Data preprocessing: The time series were normalized to improve training and divided into training and test sets.
⇒ Modeling with RNNs (LSTM) and ConvLSTM: LSTM models were used to capture temporal patterns, and ConvLSTM models were used to incorporate spatial and temporal characteristics in the precipitation data.
⇒ Model evaluation with time series metrics: Specific metrics such as the MSE, the RMSE, and the R2 were used to evaluate the precision of the models.
⇒ Visualizing the results in the form of time series: The results were displayed in prediction vs. reality graphs to assess the fit of the models over time.
In summary, time series played an essential role throughout the process, from the preparation of the data to the evaluation and visualization of the results, enabling the understanding and prediction of the evolution of monthly precipitation in Boyacá over time.
4.2. Obtained dataset
Daily precipitation data for 1981 to May 2023 were obtained from a total of 753 precipitation measurement stations within the department of Boyacá, with a spatial resolution of 0.05°. Fig. 4 presents the measurement points and a visual representation of their location.
The final dataset 13 contained the latitude, longitude, precipitation, date, year, month, and municipality data necessary for the creation of the recurrent neural network models with LSTM and ConvLSTM layers.
4.3. Exploratory analysis
Fig. 5 shows the department of Boyacá and all its coordinates, with the aim of facilitating the visualization of the study area.
The percentage of precipitation measurement stations was extracted, which is directly proportional to the area of each municipality. Therefore, the larger the area, the more measurement points. In this case, the municipality of Puerto Boyacá is the largest and includes 6.8 % of the total distribution, followed by Cubara and Aquitania, as shown in Fig.6.
The dataset taken from CHIRPS 2.0 indicates that there is a distance of 5.53150863126391 km between each measuring station. To exemplify the above, Fig. 7a shows the monthly precipitation by measurement points for May 2023, with a scale of 0 to 500. The highest precipitation for a given point is denoted by a darker blue color.
Fig. 7b shows the total monthly precipitation for each point within a municipality, in this case for Sogamoso in 2023, providing more detailed information about this specific point and facilitating more accurate conclusions.
An analysis of the monthly precipitation in the department of Boyacá for 2022, as represented in the heatmaps of Fig. 8, reveals some key points:
-
The spatial distribution of precipitation can be observed, revealing patterns of rainfall concentration in different areas across months. The wettest months, i.e., May, June, and July, with rainfall of up to 500 mm, can be clearly identified, as well as the driest months, i.e., December, January, and February.
-
The topography of the department of Boyacá seems to influence the distribution, since mountainous areas, valleys, and plains exhibit different precipitation patterns.
-
The precipitation distribution across different months can be compared, which allows understanding how weather conditions change from month to month.
-
In addition, some potential climatic anomalies can be identified, such as unusually dry or humid months in comparison with the general pattern. In the case of 2022, according to Fig. 8, no significant anomalies are observed.
In general, the analysis and visualization of monthly precipitation by coordinates allow obtaining detailed information on local climatic conditions and how they vary over time, which can be useful for making informed decisions in relation to sectors such as agriculture, water management, and urban planning.
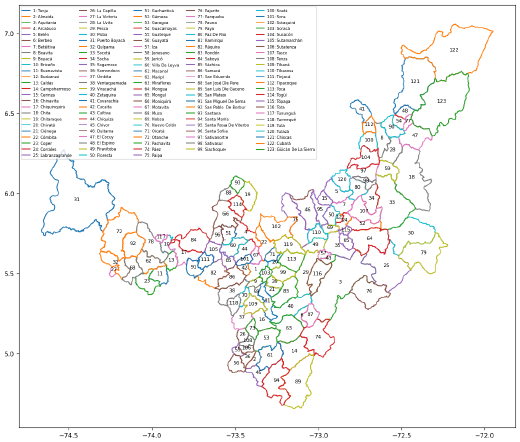
Figure 4: Precipitation measurement points
4.4. Evaluating the models
Evaluating monthly precipitation forecasting models is essential to understanding their ability to provide accurate estimates of climatic conditions. In this work, various metrics were applied to quantify the prediction quality of two models based on RNNs with LSTM and ConvLSTM architectures. The metrics used included the MSE, RMSE, and R2. These metrics provided critical information on the models' accuracy and explanatory power regarding prediction variability. Table III presents the numerical calculations of these metrics and the corresponding results, allowing for a detailed comparison and analysis of the evaluated models.
4.4.1. Comparison of predictions against real values (prediction vs. reality graphs)
This section presents a detailed assessment of how the model predictions align with the actual precipitation values in the test set. This evaluation was conducted by visually comparing the results with the 45° reference line, which represents the ideal scenario, i.e., when the predictions perfectly coincide with the actual values.
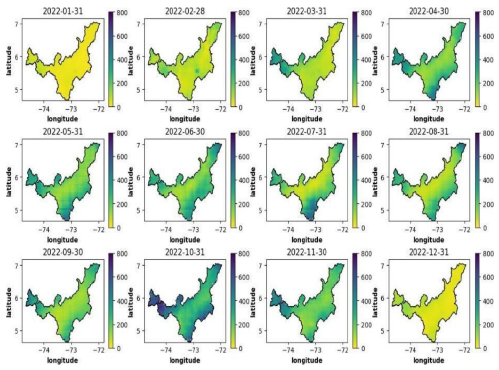
Figure 5: Coordinates of the department of Boyacá
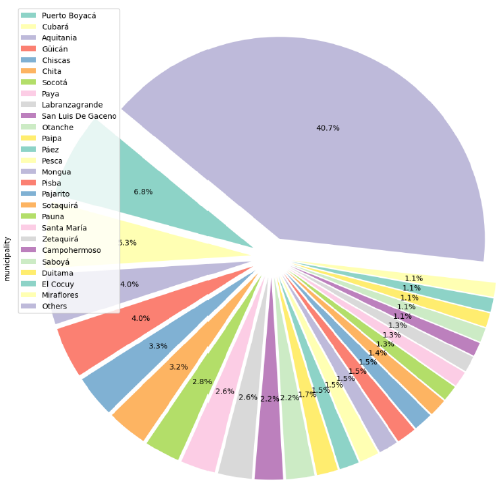
Figure 6: Coordinate distribution by municipality
In the evaluation process, predictions were generated by the RNNs with LSTM and ConvLSTM for the monthly precipitation of the test set and compared with the actual values. Then, another visual comparison was performed using separate graphs for each model, with the 45° line as a reference to assess the accuracy of the predictions.
4.4.1.1. Prediction vs. reality graphs
Fig. 9a shows that the predictions of the RNN with LSTM are remarkably aligned with the 45° line. As the actual precipitation value increases, the model's predictions tend to stay close to this baseline. This behavior indicates that the RNN with LSTM is capable of accurately capturing trends and variations in real values, even in situations involving higher precipitation values. The consistency in the alignment with the 45° line suggests a good fit and agreement between the predictions and the actual values.
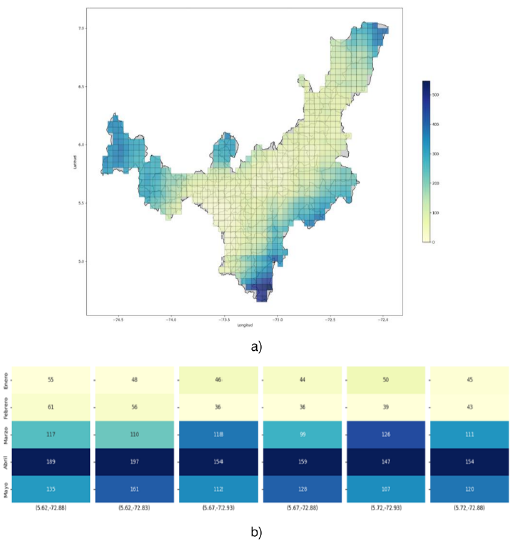
Figure 7: a) Monthly precipitation by measurement points for May 2023. b) Total monthly precipitation by coordinates in Sogamoso, 2023
Fig. 9b presents the alignment of the predictions generated by the ConvLSTM model with respect to the 45° line. Although this model also shows a trend close to the reference line, note that, as the real precipitation value increases, the predictions seem to gradually separate from the red-dotted line. This observation suggests that the ConvLSTM model may have a more difficult time capturing variations in actual values as they increase. The gradual separation of the predictions indicates that the ConvLSTM model could benefit from additional adjustments to improve its ability in predicting higher precipitation values.
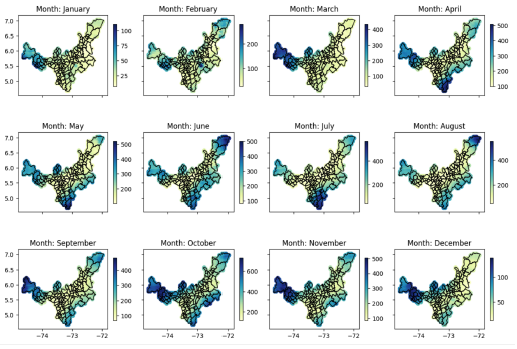
Figure 8: Total monthly precipitation by coordinates in 2022
Although both figures show points close to the 45° line, note that the RNN with LSTM performs better regarding its alignment with higher values. In contrast, the Convolutional model ConvLSTM l shows a gradual divergence.
4.4.2. Residuals analysis
Residual graphs are an essential tool in understanding models' quality and coherence regarding their ability to predict real precipitation values. This subsection presents the step-by-step process of how these graphs were elaborated and their specific interpretation.
The evaluation process consisted of three fundamental steps. First, precipitation predictions were generated using the RNN with LSTM and the ConvLSTM model. These predictions were compared against the corresponding real values. Then, the residuals were calculated, obtaining the discrepancies between the predictions and the actual values. Finally, residual plots were constructed for each model, allowing for an effective visualization of the distribution and error patterns in relation to the actual values.
Table III: Scaling technique
Metric
Numerical calculation
Result (analysis and discussion)
MSE
RNN with LSTM: 1401.37
The MSE of 1401.37 indicates that, on average, the predictions have a mean square error of approximately 1401.37 units of precipitation when compared to the actual values. This suggests a moderate dispersion in the predictions.
ConvLSTM model: 3152.08
The higher MSE of the ConvLSTM model (3152.08) indicates that the predictions tend to have a higher MSE compared to the RNN with LSTM, which suggests a greater dispersion in the predictions of this model.
RMSE
RNN with LSTM: 37.43
The RMSE of 37.43 mm of precipitation for the RNN model with LSTM implies that, on average, the predictions have an error of approximately 37.43 mm when compared to the actual values. This indicates a relatively low dispersion with respect to the true values.
ConvLSTM model: 56.14
The higher RMSE of the ConvLSTM model (56.14) suggests that the predictions have a greater dispersion compared to the RNN with LSTM, which indicates a margin of error of 56.14 mm in the predictions.
R2
RNN with LSTM: 0.876
The R2 value (0.876) for the RNN with LSTM indicates that this model explains 87.6% of the variability in the precipitation data, which suggests a good performance in the explanation and prediction of said variability.
ConvLSTM model: 0.722
The R2 value of the ConvLSTM model (0.722) indicates that it explains approximately 72.2% of the variability in the precipitation data, which indicates a good performance, although slightly lower compared to the RNN with LSTM.
4.4.2.1. Evaluating the prediction errors of the studied models
In the residual graph of the RNN with LSTM (Fig. 10a), an interesting pattern can be observed. Most of the residuals are concentrated within the range of -60 to 60, which suggests that the model's predictions mostly fall within this margin of error. However, as the actual precipitation values increase, the points begin to disperse and move away from the reference line. This could indicate that the RNN with LSTM has difficulties in accurately predicting extreme precipitation values, which translates into more notable errors as the real values increase.
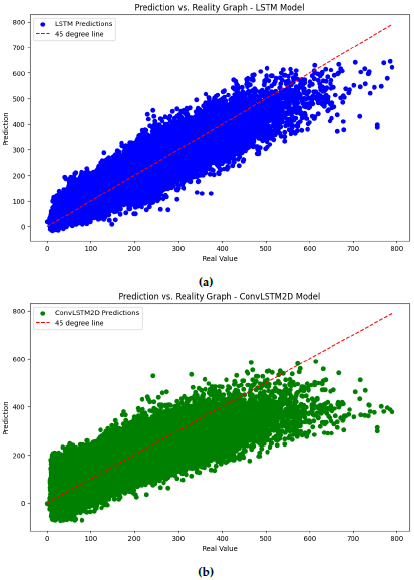
Figure 9: Prediction vs. reality graphs: a) RNN with LSTM, b) ConvLSTM model
Regarding the ConvLSTM2D model, the residual graph (Fig. 10b) also exhibits a pattern, albeit with distinct characteristics. Here, most of the residuals are in a wider range, between -100 and 100. This suggests that the predictions of the ConvLSTM2D model may have greater variability in terms of errors when compared to the RNN with LSTM. As with the previous model, as the actual precipitation values increase, the points tend to disperse and move away from the reference line.
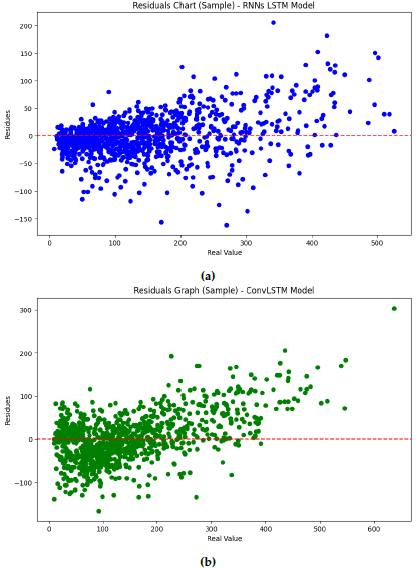
Figure 10: Residual plots: a) RNN with LSTM, b) ConvLSTM model
Both models exhibit a tendency towards the dispersion of the residuals as the real values increase. This dispersion suggests that both the RNN with LSTM and the ConvLSTM model may have difficulties in accurately capturing and predicting extreme precipitation values. However, it is important to note that most of the residuals remain within reasonable ranges in both models, indicating that the predictions are generally consistent with the actual values.
5. Data visualization
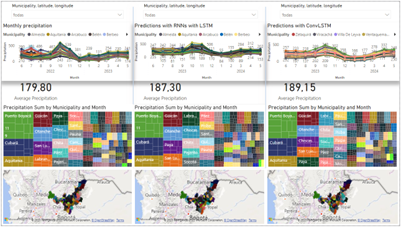
In the context of our monthly precipitation forecasting project for the department of Boyacá, an interactive dashboard was developed using Power BI to visualize the results.
The dashboard's development process began by defining the objectives and requirements, establishing what information to display, how to visualize historical data and predictions, and what type of user interaction to allow. Then, the historical monthly precipitation data and the predictions of the RNN models with LSTM and ConvLSTM model were collected and organized for later visualization in Power BI. The dashboard design was structured in three columns, each focused on a key category: historical data, the predictions of the RNN with LSTM, and the predictions of the ConvLSTM model. Specific visualizations were created for each column, including line graphs, treemaps, and geographic maps to represent trends, data by municipality and month, and spatial distributions, respectively. In addition, interactive filters were configured to allow users to dynamically explore the data and observe temporal and spatial patterns. The dashboard is illustrated in Fig. 11.
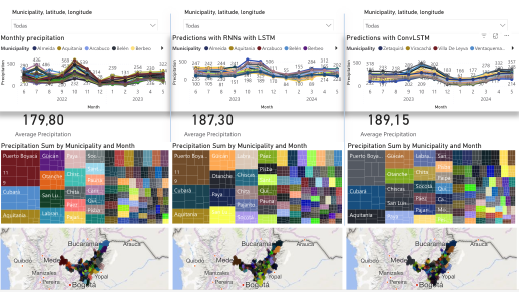
Figure 11: Dashboard structure
The description of the dashboard structure is described to continue:
⇒ Real historical monthly precipitation: This component shows a line graph with historical precipitation data, allowing for comparisons against the predicted values.
⇒ Predictions generated by the RNN with LSTM: This section explains the predictions made by this model, which are superimposed with historical data to evaluate its predictive capacity.
⇒ Predictions generated by the ConvLSTM model: This section presents the predictions generated by the ConvLSTM model, comparing them against the real data in an attempt to determine which model offers the most accurate predictions.
⇒ Precipitation treemap by municipality and month: This section shows the precipitation level for each municipality across different months, facilitating the identification of patterns and distributions.
⇒ Point distribution map: This section allows visualizing the location of 753 measure points in Boyacá along with their precipitation level. This provides a spatial perspective of variations in precipitation.
6. Practical contributions
This project's first case study focused on the municipality of Sogamoso (latitude 5.72 and longitude -72.93). A detailed analysis of the time series was carried out, and the results of the studied models were compared against actual historical precipitation data. Both models closely followed the precipitation pattern, identifying three months with higher precipitation (April, October, and November) and three with lower levels (January, February, and December). In addition, a significant increase in the estimates with respect to historical values was noted for the 12 subsequent months, with the RNN with LSTM projecting an average of 124.09 mm (vs. the historical value of 111.65 mm) and the ConvLSTM model anticipating an even higher average (145.73 mm), suggesting a substantial increase in the expected rainfall.
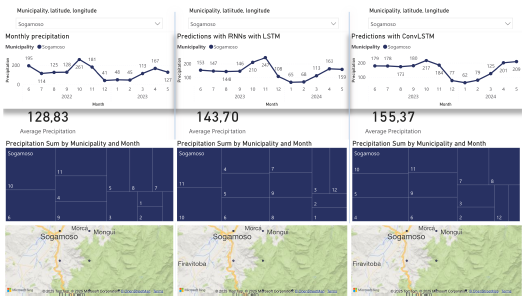
Figure 12: Data visualization, municipality of Sogamoso
In the second case study, involving the municipality of Tibasosa (latitude 5.77 and longitude -73.03), a similar precipitation pattern was observed, with April, October, and November recording the highest rainfall. This coincidence could be attributed to the geographical proximity of the two municipalities. The actual data show a monthly average precipitation of 108.45 mm in this municipality, but the RNN with LSTM predicts an average of 117.39 mm, indicating an increase in comparison with historical values. Furthermore, the ConvLSTM model predicts an even higher average (141.87 mm). This significant increase has important implications for water resource management and planning in Tibasosa.

Figure 13: Data visualization, municipality of Tibasosa
It is important to note that, according to the metrics used to evaluate the performance of the models, the RNN with LSTM exhibits a superior performance in this particular scenario. This observation highlights this model's ability to make more accurate predictions compared to the ConvLSTM model in the specific context of the municipality of Sogamoso.
Geographical filtering allowed limiting the dataset to the specific area selected for the study, making it possible to analyze the information of interest and determine the maximum and minimum precipitation values in the region of Boyacá from 1981 to 2023. This included a detailed observation of the precipitation levels generated by El Niño and La Niña in 2022 and early 2023.
7. Conclusions and future work
This project undertook the task of predicting monthly precipitation data using models based on neural networks. Two approaches were employed: one using a long short-term memory architecture and the other implementing convolutional long short-term memory. The results obtained demonstrate the predictive capacity of both models, generating scenarios based on the precipitation patterns of the region.
Both models were subjected to an evaluation that allowed quantitatively understanding their performance. The metrics used provided valuable information on the accuracy of the predictions and the tunability of each model. The comparison showed that the LSTM model achieves a lower MSE and RMSE, as well as an R2 closer to 1, indicating a better fit than the ConvLSTM model.
The prediction vs. reality graphs confirmed the solidity of the models. Both approaches showed points near the 45° line, suggesting that the predictions were in line with the actual values. However, it was noted that the LSTM model exhibits a greater proximity to the points of this line, which is indicative of its greater overall precision.
An examination of the residual plots revealed important patterns in the error distribution. For the LSTM model, most of the residuals oscillated between -60 and 60, while the ConvLSTM model showed a somewhat greater dispersion (-100 to 100). These results indicate that the LSTM model can better capture the data variability.
It is worth stating that this work successfully evaluated and developed monthly precipitation forecasting models for the department of Boyacá. The predictions provided by both models offer valuable insights for decision-making in sectors such as agriculture, water management, and urban planning. In addition, a dataset was generated, with predictions for 12 months after June 2023, allowing for continuous analysis and a better understanding of the weather patterns in the region.
In addition, the dashboard, developed using Power BI, constitutes a robust data visualization strategy to understand historical data, model predictions, and spatial distributions concerning precipitation in the department of Boyacá. This interactive tool is essential for communicating results effectively and supporting informed climate and meteorological decision-making.
The RNN with LSTM proved to be more effective than the ConvLSTM model in predicting monthly precipitation in the study area, providing reliable and accurate information for decision-making in critical sectors. Its ability to capture weather patterns and its performance regarding assessment metrics position it as a promising tool in research and practical application. However, it is important to note that, like any model, it faces challenges, such as the need for a larger amount of historical data to further improve its accuracy, as well as the exploration of regularization techniques to avoid possible overfitting issues.
Nonetheless, the ConvLSTM model, despite its slightly lower performance in this specific context, is still relevant and could find specific applications in other climate scenarios or geographic regions.
In the future, the combination of multiple models could be considered in order to take advantage of their individual strengths and further improve predictions. In addition, expanding the network of meteorological stations in the region and incorporating additional data could enrich and improve climate predictions, thus contributing to more effective decision-making and mitigation of climate-related risks in Boyacá.
Finally, this project demonstrates that deep learning models, especially RNNs with LSTM, are effective tools for predicting crucial climate data. The results obtained provide confidence in the studied models' ability to contribute significantly to research and decision-making in the context of monthly precipitation in Boyacá.
References
8. Author contributions
License
Copyright (c) 2025 Yesid Esteban Duarte, Marco Javier Suárez Barón, Oscar Javier García Cabrejo, César Augusto Jaramillo Acevedo, Carlos Augusto Meneses Escobar

This work is licensed under a Creative Commons Attribution-NonCommercial-ShareAlike 4.0 International License.
![]()
From the edition of the V23N3 of year 2018 forward, the Creative Commons License "Attribution-Non-Commercial - No Derivative Works " is changed to the following:
Attribution - Non-Commercial - Share the same: this license allows others to distribute, remix, retouch, and create from your work in a non-commercial way, as long as they give you credit and license their new creations under the same conditions.

2.jpg)