DOI:
https://doi.org/10.14483/23448393.2084Published:
2007-11-30Issue:
Vol. 13 No. 1 (2008): January - JuneSection:
Science, research, academia and developmentAnálisis de vibración como método de diagnóstico para cambiadores de tomas en carga
Vibration Analysis As Method Diagnosis For Power On Load Tap Changers
Keywords:
Cambiador de Tomas en Carga (CTC), Análisis de vibración, Transformada de Hilbert, transformada de Wavelet (es).Downloads
References
CIGRE SC 12 WG 12.05, "An international survey on failures in large power transformers in service," ELECTRA, no. 88, pp. 2147, 1983.
P. Kang, D. Birtwhistle, J. Daly, and D. McCulloch, "Noninvasive on-line condition monitoring of on load tap changers," in Proceedings of IEEE Power Engineering Society Winter Meeting, Singapore, 2000.
C. Bengtsson," Status and trends in transformer monitoring "IEEE Trans. Power Delivery, vol. 11, pp. 1379-1384, July 1996.
"Interpretation of analysis of gases in transformers and the other oil-filled electrical equipment in service" (International Electro technical Commission .IEC. IEC) 599-1978.
RIVAS E, 2007" Valoración del estado de un OLTC mediante vibraciones: análisis en tiempo-frecuencia", M.S. thesis, Dep. Electrical, Carlos III de Madrid Univ., Madrid, Spain 2007.
M. Foata, R. Beauchemin, and C. Rajotte, "On-line testing of on-load tap changers with a portable acoustic system," IEEE 9th International Conference on Transmission and Distribution Construction, Operation and Live-Line Maintenance Proceedings, pp. 293 298, Oct. 2001.
P.Kang and D. Birtwhistle, "Condition monitoring of power transformer on-load-tap-changers. Part 1: Automatic condition diagnostics," IEEE Proceedings on Generation, Transmission and Distribution, vol. 148, no. 4, pp. 301 306, 2001.
F. Jakob et al. "Use of gas Concentration Ratio to Interpret LTC & OCB Dissolved Gas Data" Electrical Insulation Conference EICEMC 2003.
T. Bengtsson, H. Kols, M. Foata, F. Leonard, "Monitoring tap changer operations" Cigre, 1998, paper 12-209.
Kang P, Bitwhistle D, "Condition Assessment of Power Transformer On-Load Tap-Changers Using Wavelet Analysis and Self-Organizing Map: Field Evaluation", IEEE Transactions on Power Delivery, Vol. 18, Nº 1, January 2003.
Kang P, Bitwhistle D, "Condition Assessment of Power Transformer On-Load Tap-Changers Using Wavelet Analysis and Self-Organizing Map: Field Evaluation", IEEE Transactions on Power Delivery, Vol. 18, Nº 1, January 2003.
M. Duval "A review of Faults Detectable by Gas-in-oil Analysis in Transformers". IEEE Electrical Insulation Magazine. Vol 18. No 3. May/Jun 2002.
S. Mallat, A, Wavelet Tour of Signal processing. Academic Press, 1988.
S. Quian, Introduction to time-frequency and wavelet transforms. Prentice Hall PTR, 2002.
How to Cite
APA
ACM
ACS
ABNT
Chicago
Harvard
IEEE
MLA
Turabian
Vancouver
Download Citation
Ingeniería, 2008 vol:13 nro:1 pág:8-14
Vibration analysis as method diagnosis for power on load tap changers
Análisis de vibración como método de diagnóstico para cambiadores de tomas en carga
Edwin Rivas
Received a Master's Degree in electrical engineering from the Universidad de Valle, Cali, Colombia in 1994 and from the Universidad Carlos III de Madrid, Madrid, Spain in 2007. Currently, he is doctoral student in engineering. His interests are in the areas of power system and signal processing with application to power transformer condition monitoring.
Juan Carlos Burgos
Was born in 1955. He received a Ph.D. from the Escuel Técnica Superior de Ingenieros Industriales de Madrid, Madrid Spain, in 1987. Currently, he is an Associate Professor wit the Universidad Carlos III de Madrid, Madrid, Spain, where h has been since 1994. His main area of interest is powe transformer monitoring.
Juan Carlos García
Was born in 1961. He received a Ph.D. from the Centro UNED- Escuela Superior de Ingenieros Industriales de Madrid, Madrid, Spain, in 1991. Currently, he is a full Professor with the Universidad Carlos III de Madrid, Madrid, Spain, where he has been since 2002. His main area of interest is vibration signature analysis applied to machinery.
Abstract
The suitable condition of an On-load Tap Changer (OLTC) is essential for the operation of a power transformer. There are a variety of OLTC diagnosis techniques, some of them can be used only off-line and some of them can be used on-line. This paper describes some of the methods used for the diagnosis of power transformers OLTC and emphasizes the vibration analysis as a tool of OLTC condition assessment. The main OLTC vibration parameters are obtained using envelope analysis based on Hilbert transform as the pre-processing of wavelet decomposition. Previously normalized and synchronize signals.
To validate the method was compared the signal vibration under normal conditions and failures realistic implemented laboratory.
Key words: On-load tap changer (OLTC), Vibration analysis, Hilbert transforms, Wavelets transform.
Resumen
El estado de la condición de un Cambiador de Tomas en Carga (CTC), es esencial para la operación del transfor mador. Hay gran variedad de técnicas de diagnostico de CTC algunas de ellas puede usarse solo con el transformador fuera de línea y otras con el transformador en línea. Este artículo describe los diferentes métodos de diagnóstico de fallos en CTC. Este trabajo enfatiza el análisis de vibración como una herramienta para evaluar la condición del CTC y enfatiza el análisis de la vibración como una herramienta para la evaluación del estado del CTC. Los principales parámetros de vibración fueron obtenidos usando la envolvente basado en la transformada de Hilbert como etapa de pre-proceso de la descomposición wavelet. Previamente se normalizo y se sincronizo las señales. Para validar el método se comparo la señal de vibración bajo condición normal y con avería implementada en laboratorio.
Palabras clave: Cambiador de Tomas en Carga (CTC), Análisis de vibración, Transformada de Hilbert, transformada de Wavelet.
1. Introduction
A great percentage of in-service transformer failures are produced in the on-load tap changer (OLTC) [1], [2]. The cost of OLTC is low compared with a transformer but OLTC condition assessment is essential to assure the transformer reliability.
The OLTC is the only moving part of a power transformer. Its elements are subjected to great electrical and mechanical stresses and can suffer mechanical damages (springs, bearings, shafts, drive mechanisms) and electrical faults (blowing contacts, burning of transition resistors and insulation problems) [3].
Nowadays, there is a tendency to use technical forecasting diagnosis, as well as monitoring systems that allow failure detection; even if it is in an early-stage.
Off-line methods require switching off the transformer and disconnecting it from the power network. Sometimes this is a great drawback as in some cases there is not possible to manage the grid without the transformer. Unlike this, on-line methods can be used while the transformer is operating and does not need for supply interruption to users.
One of the most promising techniques for detecting (off-Line and on line) OLTC condition is vibration analysis. Recently, vibration monitoring has been applied as a method for OLTC diagnosis.
The fundamental problem of condition assessment of power OLTC by vibration analysis is the lack of realistic data failure that allows mature and validate this technique.
The Electrical Department of Carlos III University of Madrid worked with Electrical Department of Distrital Francisco José de Caldas in OLTC vibration analysis.
2. Methods for off-line OLTC diagnosis
On of the main method for off-line diagnosis of an OLTC is the measurement of the dynamic contact resistance.
The so called "dynamic contact resistance" is the resistance of the transformer per phase including all internal contacts of the tap changer (diverter switch contacts, tap selector switch) and transition resistance during a tap change [2]. A constant D.C. voltage is applied to the tapped transformer winding and the current is measured while a tap change. To diagnose the three-phase transformers at once, the windings are connected in parallel, and the three currents are measured.
To identify a wide range of faults two different kinds of measures are made:
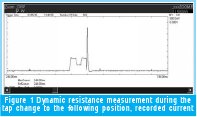
• The dynamic resistance during the change from one tap to the next one (figure 1) can be used to find out problems in the insertion resistance and abnormal transition time intervals (e.g. problems at the energy storage springs).
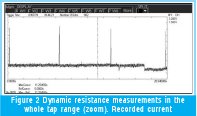
• The dynamic resistance during the whole taps range (from the first tap to the last one and down) (figure 2) can be used to identify failures in the selector switch, or inverter.
3. Methods for on line OLTC diagnosis
Main methods for on line OLTC diagnosis are:
3.1 Dissolved gas analysis (DGA) for determining arcing and thermal faults in the diverter switch [4].
3.2 Torque measurement of OLTC motordrive and temperature measurement of the diverter switch oil. [5]
3.3 Vibration monitoring for detecting faults in the selector switch and diverter switch [6], [7].
These methods are complementary, as each one is suitable for detecting some kind of faults (e.g. DGA can detect partial discharges while vibration monitoring does not) but not for detecting another kind of faults (e.g. Torque measurement can detect failures on mechanical transmission while DGA does not).
3.1 Dissolved gas analysis (DGA)
DGA is a non-intrusive diagnostic method for detection of incipient faults [4]. The insulating oil of a transformer is decomposed under the action of thermal, mechanical and electrical stresses; degradation of the transformer oil and ageing processes of the solid insulating materials (paper-pressboard) produce gases in varying composition and concentrations relating to the type the fault in the transfor mer. The most important transformer gases are:
a. Acetylene (C 2H2 ) and hydrogen (H2) are generated during the normal arcing process and hydrocarbons
b.Hydrogen is generated with partial discharges and heating
c. Methane (CH4), ethane (C2H6), and especially ethylene (C 2 H 4 ) are generated when overheating occurs in a problem OLTC [8].
d. Carbon oxides: carbon monoxide (CO) and carbon dioxide (CO2) respectively produces for high temperatures and low temperature thermal degradation of cellulose.
e. No-fault gases: nitrogen (N2) and oxygen (O2).
Fault gases are classified into five categories:
i. Corona or partial discharge(low intensity electrical discharge)
ii. Sparking (Medium intensity electrical discharge)
iii. Arcing (high intensity electrical discharge)
iv. Local over heating (Thermal fault)
v. Severe over heating (Thermal fault)
Data interpretation for LTC dissolved gasses is significantly different than interpretation of DGA for the main tank. As an example Jackob [8] uses the [Ethylene]/ [Acetylene] ratio as a fault indicator, as during normal switching operations the ratio of ethylene to acetylene is fixed. Trend analysis is also of paramount importance.
Dissolved gas analysis is an on-line diagnostic method as oil samples can be taken from an in service transformer. Nevertheless the application of gas analysis as an on-line method using gas sensors is not easy.
3.2 Torque measurement the motor drive the OLTC and temperature measurement of the diverter switch oil.
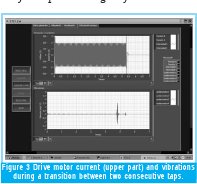
Faults in the drive mechanism can be detected by measuring or estimating torque delivered by the drive motor. Measuring shaft torque is expensive and it is not easy, as requires a mechanical sensor. Estimating motor torque by measuring motor currents and voltages it is not difficult but for this task motor parameters are needed (inductances, rotor time constant). Nevertheless it is not usual to have those parameters. For these reasons instead of motor torque, power consumption of the drive motor is used for fault diagnosis. To calculate power consumption motor voltages and currents are measured. In the upper part of figure 3 the current in one motor phase during the tap change is shown.
As in many other diagnostic methods, tend analysis help in detecting early failures.
3.3 Vibration Monitoring
Vibration monitoring is used to detect on load tap changer failures by means of vibration signal analysis during tap regulation.
According to several authors [9], [10], [11] the OLTC contact condition can be assessed by analyzing the vibration bursts during commutation; the main parameters for diagnosis are:
· Number of vibration bursts during the commutation.
· Vibration burst amplitude during the commutation.
· Time between vibration bursts during the commutation.
Analysis of vibration signal is not an easy task, as it is a very noisy signal. Even, vibration signal is not exactly the same when repeating a tap transition between two fixed consecutive taps. Because of that for using vibration monitoring to detect OLTC failures, some kind of advanced signal processing must be used. In following sections the signal processing used in the project is described.
4. EXPERIMENTAL MEASUREMENTS
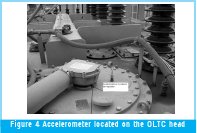
Vibration measurements were taken using piezoelectric accelerometers located on the transformer tank (figure 4).
4.1 Equipment for obtaining signals
After some preliminary tests to find the best location for the accelerometer (best signal/noise ratio), vibrations were obtained using an accelerometer placed on the OLTC head cover, which detects tank vibrations during the tapchanger operation. A piezoelectric accelerometer was used with a sensibility of 1.02±0,02pC/ms2 and a frequency range from 1 to 12 KHz. An amplifier and signal conditioner were used to allow an output between +3.16/-3.16 V. The data acquisition card has PCMCIA architecture and the following technical characteristics: 16 common mode (8 differential modes) analog input channels, 12 bit resolution, 500KS/s and variable input range from ±0,05V to ±10V. This card allows the acquisition of 8 differential analog input channels using a sampling rate of 50KS/s. With this sample rate it is possible to analyze harmonics from vibration signals up to 25 KHz during a six seconds time interval. The measurement system is shown in Figure 5
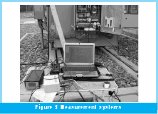
Figure 6 shows the recorded vibration caused by the tap changer operation. Vibration signal consists of a series of sharp vibration bursts corresponding to:
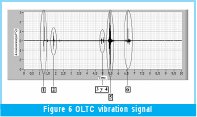
Burst 1: Starting-up of the on-load tap changer motor-drive mechanism. Energy storage through a set of switch compression springs begins.
Burst 2: Actuation of the auxiliary contacts in the control box and start of the movement of Geneva wheel and the exit of contacts mobile selector taking precedent.
Burst 3: impact of mobile contacts with to contacts fixed.
Bursts 4: ending the performance of the Geneva wheel and the next tap is selected.
Burst 5: The energy accumulated by the springs is liberated and the moving contacts of the selector and diverter switch change from one fixed contact to another. The tap change is carried out and transformer current is transferred from the previous tap to the selected tap position
Burst 6: The process is completed. The drive motor stops
4.2 Signal treatment
This paper was previously carried out process normalization and synchronization signals (aligned signal) for purposes of comparison. The main OLTC vibration parameters are obtained using envelope analysis based on Hilbert transform [12] as the pre-processing of orthogonal wavelet decomposition [13].
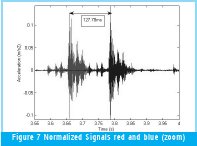
Figure 7 shows a detail of burst 5 in Figure 6 when the OLTC changes from tap 4 to tap 5 twice. Some important characteristics can be observed in amplitudes and delay between vibration bursts when two consecutive changes are made between from the same initial tap to the same final tap. The obtained records are not identical for this reason, it was necessary to normalize (equation 1) and synchronize the signals to compare them [11].

Where x is the normalized signal, x0 is the original signal, and N is the total number of samples in x0
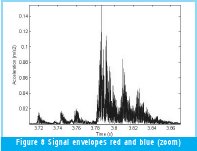
Once the vibration signals are normalized and synchronized, the envelope is obtained by applying the Hilbert transform The analytic signal corresponding to a real signal x(t) is defined as  , where the real part of the analytical signal is the original signal and the imaginary part
  is the Hilbert transformof x(t) . The magnitude of this complex analytical signal forms the signal envelope, which is always a positive function. The analytic signals contain no negative frequency components; in fact, the analytic part of a signal is obtained by suppressing the negative frequencies of the signal. Figure 8 show the result of applying Hilbert transform to the signals (figure 7).
The Wavelet Transform (WT) changes a signal from the time domain to the scale domain by means of basic functions of finite energy, called Wavelets [13].
Discrete wavelet transform (DWT) is used to decompose a signal, through two types of filters (pass low and high pass). The number of times that is filtered the signal is determined by the level from the decomposition obtaining itself a set of coefficients (approach and detail) each one from them in a certain level.
DWT of a signal f (t) is given by:
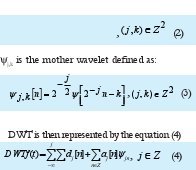
: Approximation coefficients

These coefficients represent part of the original signal, for certain frequency band and time interval. In this domain can be carried out a series of operations on the coefficients, normally consisting of can be carried out threshold (the coefficients are eliminated that is below a certain threshold, or they are multiplied by a certain weight), the threshold is obtained through statistical calculations. Spectral analysis of the threshold coefficients allows to detect and to identify failures. Later the inverse transformed one is applied to give back the signal to the time domain once has been modified. This process would be similar to which is carried out using the Fourier transform to filter a signal in the frequency domain.
Spectral analysis of the threshold coefficients allows to detect and to identify failures.
4.2.1 Smoothing the envelope signal
The mother wavelet Bior 3.3 was carefully selected by comparing the correlation coefficients of different mother wavelets.
Wavelet decomposition at level 2 is applied to the envelope. A smoothed envelope is obtained from the coefficient at 2nd level (figure 9).
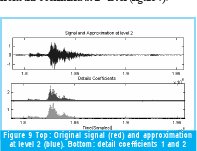
For greater signal smoothing, a cubical interpolation algorithm, Spline [14], was applied, allowing a new envelope to be obtained from the smoothing signal. The envelope maximums within 0.2 ms intervals were interpolated. With this, the effect of abrupt variations that do not allow an appropriate detection threshold application is minimized.
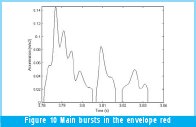
After that, a new envelope is reconstructed by applying the inverse transform of wavelet (Figure 10). The main diagnostic parameters can be determined for the vibration signal (Table I).

5. Laboratory experiments
The development and the maturation of vibration analysis as method diagnosis are limited, by the availability of failure signature data covering complete range of system operating conditions. Data for damaged systems are very difficult to obtain, compared with healthy systems. Selector switch is not accessible during normal maintenance, so diagnostic measurements are necessary; hence to validate this technique were obtained signal vibrations of OLTC in normal condition and with failure in the contacts selector switch. This test was implemented in laboratory vibration of the departments of electrical engineering and mechanical engineering from the University Carlos III de Madrid
The simulated realistic faults in the laboratory were:
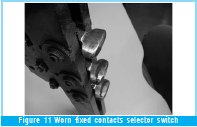
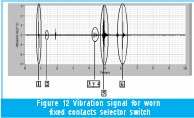
Wor n fixed contacts selector switch: Wear contacts with a grinding wheel of sanding (Figure 11). Vibration signal for worn contacts is shown in Figure 12
When diagnosing the mechanical condition of the OLTC from vibration analysis method for the condition can be seen in Table II as the time difference between pulses 1 and 2 (t2-t1) is altered dramatically.
6. Conclusions
Different methods are available for failure diagnosis of OLTC. Some of them are capable for off-line diagnosis while other methods can be used on-line. Analysis of vibration is a complementary method for diagnosis to other diagnosis methods, with the big advantage that can be used while the transformer is operating and does not need for supply interruption to users.
Vibration analysis is a promising technique to assess OLTC condition. Nevertheless, it is not easy to obtain the main parameters for diagnosis, as the signal is too noisy to distinguish the individual bursts. Main vibration parameters (number of vibration bursts, vibration amplitude and time span between bursts) are obtained using the vibration envelope. Signal treatment includes Hilbert transform, DWT, cubic spline interpolation and threshold.

DWT orthogonal is useful to soften the vibration signal since this transform allows to be conserved the original signal's energy. To use wavelet analysis, the most suitable mother wavelet was found to be Bior 3.3.
Great differences can be observed in amplitudes and time between vibration bursts from the same initial tap to the same final tap. For this reason, it was necessary to normalize and synchronize the signals to compare them in magnitude and in time-domain.
References
[1] CIGRE SC 12 WG 12.05, "An international survey on failures in large power transformers in service," ELECTRA, no. 88, pp. 21-47, 1983.
[2] P. Kang, D. Birtwhistle, J. Daly, and D. McCulloch, "Noninvasive on-line condition monitoring of on load tap changers," in Proceedings of IEEE Power EngineeringSociety Winter Meeting, Singapore, 2000.
[3] C. Bengtsson," Status and trends in transformer monitoring "IEEE Trans. Power Delivery, vol. 11, pp. 1379-1384, July 1996.
[4] "Interpretation of analysis of gases in transformers and the other oil-filled electrical equipment in service" (International Electro technical Commission .IEC. IEC) 599-1978.
[5] RIVAS E, 2007" Valoración del estado de un OLTC mediante vibraciones: análisis en tiempo-frecuencia", M.S. thesis, Dep. Electrical, Carlos III de Madrid Univ., Madrid, Spain 2007.
[6] M. Foata, R. Beauchemin, and C. Rajotte, "On-line testing of on-load tap changers with a portable acoustic system," IEEE 9th International Conference on Transmission and Distribution Construction, Operation and Live-Line Maintenance Proceedings, pp. 293 - 298, Oct. 2001.
[7] P.Kang and D. Birtwhistle, "Condition monitoring of power transformer on-load-tap-changers. Part 1: Automatic condition diagnostics," IEEE Proceedings on Generation, Transmission and Distribution, vol. 148, no. 4, pp. 301- 306, 2001.
[8] F. Jakob et al. "Use of gas Concentration Ratio to Interpret LTC & OCB Dissolved Gas Data" Electrical Insulation Conference EICEMC 2003.
[9] T. Bengtsson, H. Kols, M. Foata, F. Leonard, "Monitoring tap changer operations" Cigre, 1998, paper 12-209.
[10] Kang P, Bitwhistle D, "Condition Assessment of Power Transformer On-Load Tap-Changers Using Wavelet Analysis and Self-Organizing Map: Field Evaluation", IEEE Transactions on Power Delivery, Vol. 18, Nº 1, January 2003.
[11] Kang P, Bitwhistle D, "Condition Assessment of Power Transformer On-Load Tap-Changers Using Wavelet Analysis and Self-Organizing Map: Field Evaluation", IEEE Transactions on Power Delivery, Vol. 18, Nº 1, January 2003.
[12] M. Duval "A review of Faults Detectable by Gas-in-oil Analysis in Transformers". IEEE Electrical Insulation Magazine. Vol 18. No 3. May/Jun 2002.
[13] S. Mallat, A, Wavelet Tour of Signal processing. Academic Press, 1988.
[14] S. Quian, Introduction to time-frequency and wavelet transforms. Prentice Hall PTR, 2002.
Creation date:
License
From the edition of the V23N3 of year 2018 forward, the Creative Commons License "Attribution-Non-Commercial - No Derivative Works " is changed to the following:
Attribution - Non-Commercial - Share the same: this license allows others to distribute, remix, retouch, and create from your work in a non-commercial way, as long as they give you credit and license their new creations under the same conditions.



2.jpg)


