DOI:
https://doi.org/10.14483/23448393.24130Published:
2026-07-27Issue:
Vol. 31 No. 1 (2026): January-AprilSection:
Mechanical EngineeringR-SWARA and COPRAS Integration for Evaluating Third-Party Logistics Providers
Integración de R-SWARA y COPRAS para la evaluación de proveedores logísticos externos
Keywords:
Third-party logistics, Rough SWARA, COPRAS, multi-criteria decision-making, fishery industry, vendor selection (en).Keywords:
R-SWARA, COPRAS, toma de decisiones multicriterio, industria pesquera, selección de proveedores, logística tercerizada (es).Downloads
References
[1] P. Thompson, C. Okorie, and K. El Sakty, “An Exploratory Study of the Strategic Use of 3PLs for Cost Reduction and Customer Satisfaction in the Oil and Gas Industry: Nigerian Firms’ Experience,” Manag. Res. Pract., vol. 13, no. 1, p. 27, 2019, [Online]. Available: https://jscm.au.edu/index.php/jscm/article/download/165/123
[2] M. Heiyantuduwa, W. M. N. N. Wannisingha, and T. Rupasinghe, “A Strategic Analysis of the use of Third Party Logistics Providers (3PLs) in Fast Moving Consumer Goods (FMCG) Industry: A Systematic Review of Literature,” Soc. Sci. Res. Netw., 2015. https://doi.org/10.2139/ssrn.2699881
[3] I. Vlachos and V. Polichronidou, “The role of Third-Party Logistics Providers in managing international supply chain triads,” Int. Conf. Logist. Oper. Manag., pp. 1–10, 2022. https://doi.org/10.1109/gol53975.2022.9820185
[4] X. Chen, G. Cai, and J.-S. J. Song, “The Cash Flow Advantages of 3PLs as Supply Chain Orchestrators,” Soc. Sci. Res. Netw., 2016. https://doi.org/10.2139/ssrn.2679357
[5] H. T. Mengistu, K. S. Dimitrov, and M. H. Qureshi, “Impact of 3PL Outsourcing on Supply Chain Management in Manufacturing Companies in Norway: Case Study Norsk Hydro,” J. Procure. Supply Chain, vol. 7, no. 1, pp. 1–11, 2023. https://doi.org/10.53819/81018102t5174
[6] G. Turner, “A 3PL’s role in perishable freight transportation,” J. Supply Chain Manag. Logist. Procure., vol. 2, no. 1, pp. 84–93, 2019.
[7] S. A. Baidoo-Baiden, “3PL Relationship Management Practices as a Cost Reduction Tool in the Supply Chain: A Case of Stellar Logistics,” Am. J. supply Chain Manag., vol. 7, no. 1, pp. 1–18, 2022. https://doi.org/10.47672/ajscm.1175
[8] S. Boakai and F. Samanlioglu, “An MCDM approach to third party logistics provider selection,” Int. J. Logist. Syst. Manag., vol. 44, no. 3, p. 283, 2023. https://doi.org/10.1504/ijlsm.2023.129365
[9] R. D. Raut, B. B. Gardas, S. Pushkar, and B. E. Narkhede, “Third-party logistics service providers selection and evaluation: A hybrid AHP-DEA-COPRAS-G group decision-making approach,” Int. J. Procure. Manag., vol. 12, no. 6, pp. 632–651, 2019. https://doi.org/10.1504/ijpm.2019.102936
[10] T. D. Nguyen and T. C. Le, “3PL provider selection in oil and gas industry using the analytic hierarchy process: A case study in oil-field services company X,” vol. 9, no. 1, 2020. https://doi.org/10.46223/hcmcoujs.econ.en.9.1.176.2019
[11] K. Suroto and H. Hasbullah, “Third Party Logistics Selection in Fast Moving Consumer Goods using AHP Method: A Case Study at PT.PZC,” 2022. https://doi.org/10.4108/eai.25-11-2021.2318835
[12] Y. Yuan, Z. Xu, and Y. Zhang, “The DEMATEL–COPRAS hybrid method under probabilistic linguistic environment and its application in Third Party Logistics provider selection,” Fuzzy Optim. Decis. Mak., pp. 1–20, 2021. https://doi.org/10.1007/s10700-021-09358-9
[13] A. Ulutaş and A. Topal, “A new hybrid model based on rough step-wise weight assessment ratio analysis for third-party logistics selection,” Soft Comput., pp. 1–12, 2021. https://doi.org/10.1007/s00500-021-06374-0
[14] C.-N. Wang, N.-A.-T. Nguyen, T.-T. Dang, and C.-M. Lu, “A compromised decision-making approach to third-party logistics selection in sustainable supply chain using fuzzy ahp and fuzzy vikor methods,” Mathematics vol. 9, no. 8, p. 886, 2021. https://doi.org/10.3390/math9080886
[15] S. N. W. Pramono et al., “Integrating the analytic hierarchy process and importance-performance analysis into ISO 14001 framework for assessing campus sustainability,” AIP Conf. Proc., vol. 1902, no. 1, p. 20035, 2017. https://doi.org/10.1063/1.5010652
[16] M. M. Ulkhaq, W. R. Wijayanti, D. A. Dilaga, A. A. Qadarullah, and F. Arfi, “Combining the Analytic Hierarchy Process and Importance-Performance Analysis to Assess Service Quality of m-Commerce: A Case of Indonesian m-Commerce,” in 2021 IEEE 8th Int. Conf. Ind. Eng. App. (ICIEA), 2021, pp. 6–10. https://doi.org/10.1109/iciea52957.2021.9436718
[17] D. P. Sari, W. R. Wijayanti, A. Prayogo, M. Mujiya Ulkhaq, and D. I. Rinawati, “An integrated fuzzy AHP and TOPSIS model for evaluating the performance of raw material suppliers: A case study in lasem batik writing centre,” MATEC Web Conf., vol. 204, p. 2014, 2018. https://doi.org/10.1051/matecconf/201820402014
[18] M. M. Ulkhaq, R. L. Nartadhi, and P. Y. Akshinta, “Evaluating Service Quality of Korean Restaurants: A Fuzzy Analytic Hierarchy Approach,” Ind. Eng. Manag. Syst., vol. 15, no. 1, pp. 77–91, 2016. https://doi.org/10.7232/iems.2016.15.1.077
[19] M. M. Ulkhaq, A. D. Siamiaty, A. Handoko, S. A. Madjid, and D. ‘Sa Nu, “The Fuzzy Analytic Hierarchy Process for Prioritizing the Sustainable Tourism Attitude Scale,” IOP Conf. Ser. Earth Environ. Sci., vol. 219, no. 1, p. 12012, Jan. 2019. https://doi.org/10.1088/1755-1315/219/1/012012
[20] W. R. Wijayanti, W. R. Dewi, F. Ardi, A. Fajri, M. M. Ulkhaq, and P. Y. Akshinta, “Combining the fuzzy AHP and TOPSIS to evaluate service quality of e-commerce website,” in Proc. 10th Int. Conf. Ed. Tech. Comp., 2018, pp. 397–402. https://doi.org/10.1145/3290511.3290514
[21] N. U. Handayani, D. P. Sari, M. M. Ulkhaq, and R. A. C. Fitriani, “The Analytic Network Process for Identifying the Potential Sub-Sectors of Creative Industry: Empirical Finding from Semarang, Indonesia,” Rev. Gestão - RGSA, vol. 18, no. 3, p. e05016, 2024. https://doi.org/10.24857/rgsa.v18n3-098
[22] E. Çakir, “Selecting Contractor Company in Urban Transformation Using SWARA - Gray Relationship Analysis Method,” J. Int. Sci. Res., vol. 2, no. 6, pp. 79–95, 2017. https://doi.org/10.23834/isrjournal.327313
[23] H. E. Gürler, “Assessment of Third-Party Reverse Logistics Provider Through the SWARA-WASPAS Integrated Framework,” Kahramanmaraş Sütçü İmam Üniversitesi Sos. Bilim. Derg., vol. 21, no. 1, pp. 204–217, 2024. https://doi.org/10.33437/ksusbd.1422598
[24] A. K. Narayanan and J. N, “Application of SWARA and TOPSIS Methods for Supplier Selection in a Casting Unit,” Int. J. Eng. Res. Technol., vol. 7, no. 5, 2018, [Online]. Available: https://www.ijert.org/research/application-of-swara-and-topsis-methods-for-supplier-selection-in-a-casting-unit-ijertv7is050210.pdf
[25] V. V. A. Almeida, C. F. S. Gomes, L. H. C. Pinochet, and M. dos Santos, “Prioritization of investment order in Brazil among renewable energy sources: an analysis using the SWARA-MOORA-3NAG method,” J. Model. Manag., vol. 20, no. 2, pp. 620–647, 2025. https://doi.org/10.1108/jm2-09-2023-0208
[26] P. G. Fernandes et al., “Product Engineering Assessment of Subsea Intervention Equipment Using SWARA-MOORA-3NAG Method,” Systems, vol. 11, no. 3, 2023. https://doi.org/10.3390/systems11030125
[27] E. Adalı and A. Işik, “Integration of DEMATEL, ANP and DEA methods for third party logistics providers’ selection,” Manag. Sci. Lett., vol. 6, no. 5, pp. 325–340, 2016. https://doi.org/10.5267/j.msl.2016.3.004
[28] S. Hasibuan and C. Jaqin, “Seleksi dan Penentuan Third Party Logistik Transportasi Produk Pelumas Menggunakan Metode TOPSIS dan PROMETHE,” Oper. Excell., vol. 14, no. 3, p. 235, 2022. https://doi.org/10.22441/oe.2022.v14.i3.058
[29] M. P. Basilio, V. Pereira, and F. Yigit, “New Hybrid EC-Promethee Method with Multiple Iterations of Random Weight Ranges: Applied to the Choice of Policing Strategies,” Mathematics, vol. 11, no. 21, 2023. https://doi.org/10.3390/math11214432
[30] S. Shukla, S. Khare, T. Verma, M. Chhimwal, and G. Kumar, "Selection of Third-Party Reverse Logistics Partners Using Multi-criteria Decision Making: A Case Study of EV Industry," in Recent Advances in Mechanical Engineering. ICRAMERD 2023, S. Sahoo and N. Yedla, Eds. Singapore: Sprin.ger, 2024, pp. 209–219. https://doi.org/10.1007/978-981-97-1080-5_17
[31] M. M. Ulkhaq, P. Y. Akshinta, R. L. Nartadhi, and W. P. Susatyo Nugroho, “Assessing Sustainable Rural Community Tourism Using the AHP and TOPSIS Approaches under Fuzzy Environment,” MATEC Web Conf., vol. 68, p. 9003, 2016. https://doi.org/10.1051/matecconf/20166809003
[32] M. M. Ulkhaq et al., “Evaluating Hospital Service Quality: A Combination of the AHP and TOPSIS,” in Proc. 2nd Int. Conf. Med. Health Infor., 2018, pp. 117–124. https://doi.org/10.1145/3239438.3239448
[33] M. M. Ulkhaq, W. R. Wijayanti, M. S. Zain, E. Baskara, and W. Leonita, “Combining the AHP and TOPSIS to evaluate car selection,” in Proc. 2nd Int. Conf. High Perf. Compil., Comp. Comm., 2018, pp. 112–117. https://doi.org/10.1145/3195612.3195628
[34] A. Jayant and P. Singh, “Application of AHP-VIKOR Hybrid MCDM Approach for 3pl Selection: A Case Study,” Int. J. Comp. App., no. 5, pp. 4–11, 2015. [Online]. Available: https://research.ijcaonline.org/icaet2015/number5/icaet4061.pdf
[35] R. Kumar, H. Singh, and J. S. Dureja, “An approach to analyze logistic outsourcing problem in medium‐scale organization by CFPR and VIKOR,” J. Manuf. Technol. Manag., vol. 23, no. 7, pp. 885–898, 2012. https://doi.org/10.1108/17410381211267718
[36] E. Rosiana, A. K. Garside, and I. Amallynda, “Integration of Rough SWARA and COPRAS in the Performance Evaluation of Third-Party Logistics Providers,” JTI., vol. 22, no. 1, pp. 31–42, 2021. https://ejournal.umm.ac.id/index.php/industri/article/view/15823
F[37] S. S. Goswami and D. K. Behera, “Developing Fuzzy-AHP-Integrated Hybrid MCDM System of COPRAS-ARAS for Solving an Industrial Robot Selection Problem,” Int. J. Decis. Support Syst. Technol., vol. 15, no. 1, pp. 1–38, 2023. https://doi.org/10.4018/ijdsst.324599
[38] S. K. Tembhare, A. K. Amar, and J. George, “Evaluating Alternatives Using ARAS Method Integrated with Entropy Weight Method for Vendor Selection in Supply Chain Management,” J. Emerg. Technol. Innov. Res., vol. 8, no. 2, pp. 1271–1275, 2021, [Online]. Available: https://www.jetir.org/view?paper=JETIR2102149
[39] S. Sremac, Ž. Stević, D. Pamučar, M. Arsić, and B. Matić, “Evaluation of a Third-Party Logistics (3PL) Provider Using a Rough SWARA–WASPAS Model Based on a New Rough Dombi Aggregator,” Symmetry (Basel)., vol. 10, no. 8, p. 305, 2018. https://doi.org/10.3390/sym10080305
[40] M. P. Basílio, V. Pereira, H. G. Costa, M. Santos, and A. Ghosh, “A Systematic Review of the Applications of Multi-Criteria Decision Aid Methods (1977–2022),” Electronics, vol. 11, no. 11, 2022. https://doi.org/10.3390/electronics11111720
[41] M. P. Basilio, V. Pereira, and M. dos Santos, “Preface to the Special Issue ‘Advanced Applications of Multi-Criteria Decision-Making Methods in Operational Research,’” Mathematics, vol. 13, no. 11, 2025. https://doi.org/10.3390/math13111888
[42] V. Keršuliene, E. K. Zavadskas, and Z. Turskis, “Selection of rational dispute resolution method by applying new step‐wise weight assessment ratio analysis (Swara),” J. Bus. Econ. Manag., vol. 11, no. 2, pp. 243–258, 2010. https://doi.org/10.3846/jbem.2010.12
[43] E. K. Zavadskas, Ž. Stević, I. Tanackov, and O. Prentkovskis, “A Novel Multicriteria Approach – Rough Step-Wise Weight Assessment Ratio Analysis Method (R-SWARA) and Its Application in Logistics,” Stud. Informatics Control, vol. 27, pp. 97–106, 2018. https://doi.org/10.24846/v27i1y201810
[44] E. K. Zavadskas, A. Kaklauskas, and V. Sarka, “The New Method of Multicriteria Complex Proportional Assessment of Projects,” Technol. Econ. Dev. Econ., vol. 3, pp. 131–139, 1994.
[45] S. Jovčić and P. Průša, “A Hybrid MCDM Approach in Third-Party Logistics (3PL) Provider Selection,” Mathematics2, vol. 9, no. 21, 2021. https://doi.org/10.3390/math9212729
[46] Ö. Bali and Ö. EROĞLU, “Assessment of 3PL Providers for Hazardous Materials,” J. Mil. Inf. Sci., vol. 2, no. 2, pp. 27–40, 2014. https://doi.org/10.17858/jmisci.38531
[47] S. Çıkmak, “Sustainable 3PL Service Provider Selection in the Pharmaceutical Industry Using Fuzzy-Based SWARA and MAIRCA Methods,” Abant Sos. Bilim. Derg., vol. 25, no. 1, pp. 306–333, 2025. https://doi.org/10.11616/asbi.1585792
[48] A. Ulutaş, “A grey hybrid model to select the optimal third-party logistics provider,” South African J. Ind. Eng., vol. 32, no. 1, 2021. https://doi.org/10.7166/32-1-2126
[49] S. Sremac, Ž. Stević, D. Pamučar, M. Arsić, and B. Matić, “Evaluation of a Third-Party Logistics (3PL) Provider Using a Rough SWARA–WASPAS Model Based on a New Rough Dombi Aggregator,” Symmetry (Basel)., vol. 10, no. 8, 2018. https://doi.org/10.3390/sym10080305
[50] M. E. Akpınar, “Third-Party Logistics (3PL) Provider Selection Using Hybrid Model of SWARA and WASPAS,” Int. J. Pure Appl. Sci., vol. 7, no. 3, 2021. https://doi.org/10.29132/ijpas.972885
How to Cite
APA
ACM
ACS
ABNT
Chicago
Harvard
IEEE
MLA
Turabian
Vancouver
Download Citation
Recibido: 21 de septiembre de 2025; Revisión recibida: 6 de diciembre de 2025; Aceptado: 25 de febrero de 2026
Abstract
Context:
Evaluating third-party logistics (3PL) providers is a complex task since multiple criteria assessed by experts with potentially diverse perspectives are involved, leading to varying scores based on individual prioritizations. This study attempts to evaluate 3PL providers for a mid-sized fishery company in Jakarta, Indonesia, focusing on refrigerated transportation within cold chain logistics.
Method:
A methodology integrating rough stepwise weight assessment ratio analysis (R-SWARA) and complex proportional assessment (COPRAS) is employed to address expert uncertainty and rank six providers based on seven criteria: security, punctuality, cost, delivery area, customer service, assurance, and logistics experience. R-SWARA assigns weights using rough set intervals, while COPRAS ranks providers.
Results:
The integrated methods yield Vendor A as the top choice, with a utility degree of 100%, followed by Vendor D and others ranging from 96.7 to 98.4%. These rankings highlight the critical role of punctuality and security in refrigerated transportation, aligning with the fishery industry’s need to ensure product freshness and reliability. A sensitivity analysis that varies the weight of punctuality by ± 20% confirms the ranking’s stability, highlighting the methodology’s robustness. The findings align with prior studies emphasizing performance and quality in logistics, while R-SWARA’s use of intervals offers a novel approach to handling uncertainty.
Conclusions:
The proposed method recommends Vendor A to ensure timely and secure seafood delivery, with implications for perishable goods logistics. The limitations include a small expert panel and a single-case focus, suggesting the need for future research with larger samples and broader applications. Another limitation of the proposed approach is its reliance on expert judgement for criteria weighting, as well as its sensitivity to the selected criteria and case context. Therefore, the findings should be interpreted as a decision support rather than universal rankings.
Keywords:
third-party logistics, R-SWARA, COPRAS, multi-criteria decision-making, fishery industry, vendor selection.Resumen
Contexto:
Evaluar proveedores de logística tercerizada (3PL) es una tarea compleja, pues involucra múltiples criterios evaluados por expertos con perspectivas potencialmente diversas, lo que conduce a puntuaciones variables según las priorizaciones individuales. Este estudio busca evaluar proveedores 3PL para una empresa pesquera de tamaño medio en Yakarta, Indonesia, con enfoque en el transporte refrigerado dentro de la logística de cadena de frío.
Método:
Se emplea una metodología que integra el análisis de razón de evaluación de pesos por etapas aproximado (R-SWARA) y la evaluación proporcional compleja (COPRAS) para abordar la incertidumbre de los expertos y clasificar seis proveedores en función de siete criterios: seguridad, puntualidad, costo, área de entrega, servicio al cliente, garantía y experiencia logística. R-SWARA asigna los pesos mediante intervalos de conjuntos aproximados, mientras que COPRAS clasifica a los proveedores.
Resultados:
Los métodos integrados sitúan al Proveedor A como la mejor opción, con un grado de utilidad del 100 %, seguido del Proveedor D y otros, con valores que oscilan entre 96.7 y 98.4 %. Estas clasificaciones destacan el papel fundamental de la puntualidad y la seguridad en el transporte refrigerado, en concordancia con la necesidad de la industria pesquera de garantizar la frescura y confiabilidad del producto. Un análisis de sensibilidad que varía el peso de la puntualidad en ± 20 % confirma la estabilidad de la clasificación, subrayando la robustez de la metodología. Los hallazgos coinciden con estudios previos que enfatizan el desempeño y la calidad en la logística, mientras que el uso de intervalos de R-SWARA ofrece un enfoque novedoso para el manejo de la incertidumbre.
Conclusiones:
El método propuesto recomienda al Proveedor A para garantizar una entrega de comida marina que sea oportuna y segura, con implicaciones para la logística de bienes perecederos. Las limitaciones incluyen un panel reducido de expertos y el enfoque en un solo caso, lo que sugiere la necesidad de futuras investigaciones con muestras más amplias y aplicaciones más generales. Otra limitación del enfoque propuesto es su dependencia del juicio experto para la ponderación de criterios, así como su sensibilidad a los criterios seleccionados y al contexto del caso. Por lo tanto, los hallazgos deben interpretarse como un apoyo a la toma de decisiones más que como clasificaciones universales.
Palabras clave:
logística tercerizada, R-SWARA, COPRAS, toma de decisiones multicriterio, industria pesquera, selección de proveedores.1. Introduction
Efficient logistics are the backbone of modern supply chains, but selecting the right third-party logistics (3PL) provider remains a critical challenge in competitive markets. Industries increasingly focus on boosting productivity while maintaining operational efficiency by partnering with reliable suppliers, vendors, and service providers 1. This strategy allows companies to concentrate on core activities while delegating critical support functions (e.g., transportation) to specialized experts 2, 3. Transportation is vital for ensuring timely, cost-effective, and customer-aligned delivery of goods. Given its complexity and significance, many industries opt for 3PL providers to manage distribution 4. Benefits like cost reduction, operational flexibility, and access to advanced technology and expertise further drive the adoption of 3PL strategies 5, 6.
Selecting an appropriate 3PL provider requires thorough analysis to avoid potential setbacks 7. Organizations must first identify key criteria aligned with their operational priorities before evaluating vendors 8. Previous studies highlight diverse criteria tailored to specific industries. For instance, 9 proposed criteria for fast-moving consumer goods (FMCG), including the freight cost per kilometer, fleet capacity, vehicle quality, driver quality, order acceptance rate, distance target achievement, flexibility, on-time delivery, financial strength, customer support, and training and development. 10 identified six criteria for 3PL selection in the oil and gas industry through expert interviews: cost, performance, services, intangible factors (e.g., brand reputation and relationship trust), quality assurance, and IT systems. Similarly, 11 emphasized logistics costs, responsiveness, location, information technology, and service quality for FMCG 3PL providers. Cost and service quality are universal criteria, while industry-specific factors like flexibility in FMCG or intangible factors in oil and gas reflect distinct operational needs.
Evaluating 3PL providers is a complex task since multiple criteria assessed by experts with potentially diverse perspectives are involved, leading to varying scores based on individual prioritizations 12. This challenge becomes even more critical in cold chain logistics, where delays and service failures can directly affect product freshness and quality, and where expert judgments often involve uncertainty and hesitation. To address this challenge, multi-criteria decision-making (MCDM) approaches employ weighting techniques to systematically evaluate vendors 13. Several MCDM methods have been applied, including the analytical hierarchy process (AHP) and its extensions 10, 11, 14-16, fuzzy AHP 17-20, analytical network process (ANP) 21, stepwise weight assessment ratio analysis (SWARA) 22-26, decision-making trial and evaluation laboratory (DEMATEL) 12, 27, the preference ranking organization method for enrichment evaluations (PROMETHEE) 28 and a recent hybrid model combining entropy and critic: EC-PROMETHEE 29. Experts assign scores to criteria, which are then evaluated using weights. To enhance robustness, prior studies have integrated these weighting approaches, with scoring methods such as the technique for order preference by similarity to the ideal solution (TOPSIS) 30-33, VIšekriterijumsko KOmpromisno Rangiranje (VIKOR) 14, 30, 34, 35, complex proportional assessment (COPRAS) 9, 12, 36, multi-objective optimization on the basis of ratio analysis (MOORA) 26, and additive ratio assessment (ARAS) 37, 38. Combining weighting and scoring methods allows for a better approximation to the complexity of 3PL evaluation in comparison with the use of a single method.
The SWARA method has gained traction for determining criteria importance, but its reliance on precise expert evaluations makes it sensitive to variations, with imprecise or less knowledgeable opinions introducing vagueness 36, 39. Recent systematic reviews and field assessments of MCDM methods highlight a growing trend towards hybrid framework for overcoming uncertainty and subjectivity 40, 41. To address this, rough set theory has been integrated, using interval data with upper and lower bounds to account for uncertainty and reduce bias, unlike single-value assessments in traditional SWARA. This is called R-SWARA13. While prior studies often overlook expert uncertainty, this study advances 3PL evaluation by integrating R-SWARA with COPRAS.
To apply the proposed method, this study evaluates 3PL providers for a mid-sized fishery in Indonesia, focusing on refrigerated transportation to ensure product freshness in cold chain logistics. R-SWARA is employed to rank criteria assessed by experts, with rough set theory mitigating judgment uncertainty to enhance decision robustness. The COPRAS method then ranks vendors based on these weighted criteria. This technique was selected for its comprehensive ranking of alternatives and its ability to balance trade-offs across all criteria, including those of lower weight, which is critical in logistics systems. In comparison with TOPSIS and VIKOR, which require calculating the distance from the ideal solution, COPRAS allows the normalized criterion values to be multiplied directly by the corresponding rough weight without defuzzification, ensuring an uncertainty structure throughout the process. The utility degree in COPRAS also supports decision-makers in directly comparing overall performance levels, unlike PROMETHEE, with outranking flows from the pairwise comparisons. Our integrated methodology offers a replicable framework for industries requiring precise 3PL selection under uncertainty, such as perishable goods logistics.
The originality of this study lies in the proposed integration of R-SWARA and COPRAS into a single evaluation framework to support provider selection under uncertainty in the cold chain logistics sector. Specifically, R-SWARA is used to derive criteria weights while accommodating uncertainty in expert judgements, and COPRAS is then applied to generate an interpretable utility-based ranking across alternatives using both benefit and cost criteria. In addition, a sensitivity analysis is performed to examine the stability of the ranking with respect to changes in key criteria weights, strengthening the robustness of the proposed decision support approach. This combined approach provides transparent, decision-oriented prioritization for the studied context.
This paper is structured as follows. Section 2 reviews the proposed method, detailing the R-SWARA and COPRAS methods and their integration. Section 3 presents the case study, including data collection from experts and criteria selection for the fishery industry. The result of the case study is also provided in this section. Section 4 discusses findings and conclusions, comparing them to prior studies and addressing practical implications.
2. Methodology
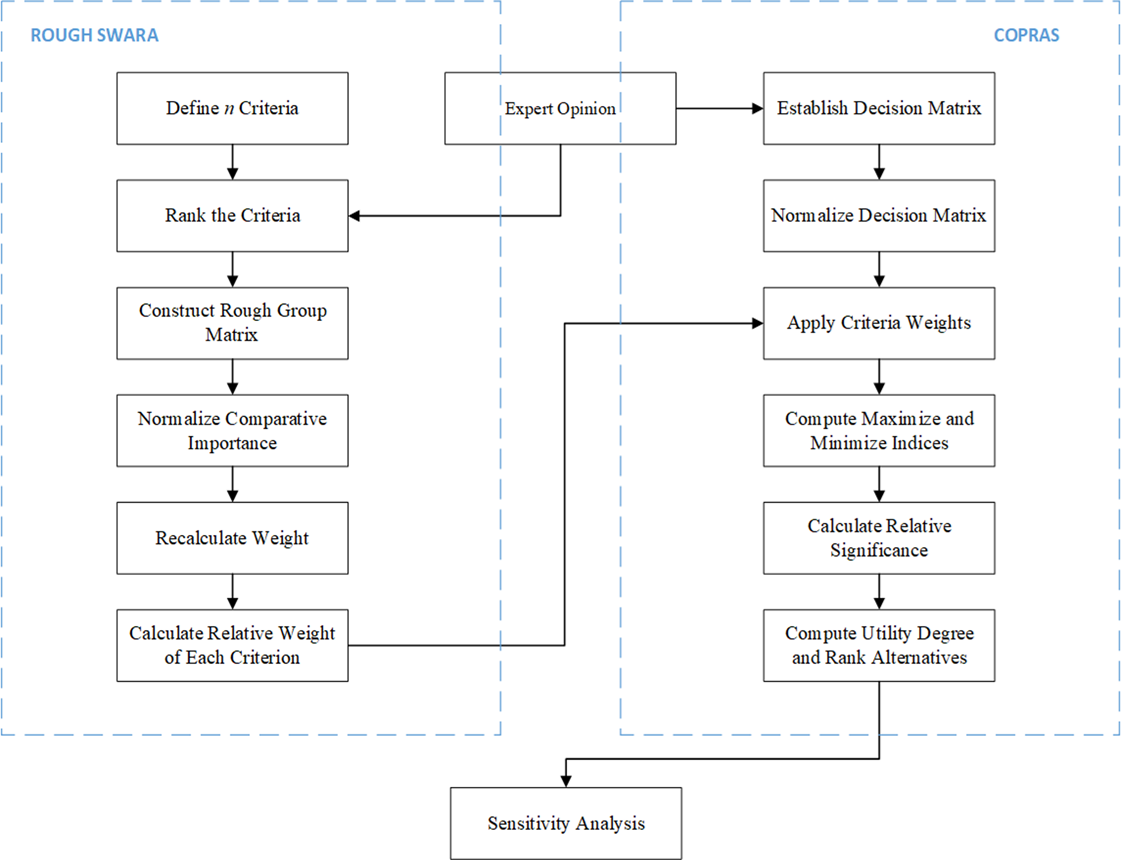
This section outlines the methodology for evaluating 3PL providers using the R-SWARA-COPRAS integrated approach. Initially, the studied firm conducted a preliminary screening process to eliminate the 3PL providers that did not satisfy its standards, considering the nature of the products being transported—which require safety assurance, on-time delivery, and regulatory compliance. In this vein, the proposed methodology enabled a compensatory decision-making approach to rank the remaining feasible alternatives. The integrated methodology first applied R-SWARA to derive robust criterion weights, accounting for expert uncertainty through rough set intervals. These weights were then used in the COPRAS method to rank 3PL providers based on expert scores. Fig. 1 illustrates the integrated framework based on R-SWARA, COPRAS, and sensitivity analysis. This combination leverages R-SWARA’s ability to handle subjective judgments and COPRAS’s comprehensive ranking, making it suitable for complex logistics decisions. The computational procedures were conducted manually by strictly following the formulations. Repeated calculations and checks were performed to ensure accuracy and consistency.

Figure 1: Flow process - R-SWARA and COPRAS
2.1 Phase 1: determining rough criteria weights using the R-SWARA method
SWARA, introduced by 42, allows experts to assign weights to criteria based on their relative importance. Unlike the AHP, SWARA is efficient for group decision-making, requiring experts to rank criteria and estimate their comparative significance. However, SWARA’s reliance on precise expert judgments can introduce subjectivity and uncertainty 43. To address this issue, 43 developed R-SWARA by integrating rough set theory, which uses interval data with upper and lower bounds to handle vague or conflicting subjective opinions. Their study validated R-SWARA in selecting wagons for internal transport, demonstrating a strong correlation with the rough best-worst method (BWM) and rough AHP in sensitivity analysis, thus confirming its robustness.
The R-SWARA method consists of the following steps 43:
Step 1.1: defining the criteria
Let a set of n criteria be defined as:

Step 1.2: ranking the criteria
A group of k experts then provides rankings of the criteria from most to least important. Let r ij denote the ranking value assigned by expert i to criterion C j .
Step 1.3: constructing a rough group matrix
Since experts may provide different values, each criterion is represented by a rough number (RN) as an interval rather than a single value. For each score r ij , two limits are calculated: (i) the lower limit, which is the average of all scores that are lower than or equal to r ij , and (ii) the upper limit, which is the average of all scores that are greater than or equal to r ij . This is shown in Eqs. 1 and 2, respectively.


where N
L
and N
U
are number of scores lower than or equal to r
ij
and the number of scores greater than or equal to r
ij
, respectively. Therefore, for criterion C
j
, the rough number is

Step 1.4: normalizing comparative importance
Once the rough numbers RN(C j ) have been obtained for each criterion C j , they are converted into comparative importance values s j . Formally:
-
For the most important criterion (ranked first), the comparative importance is fixed as s 1 = (1, 1). This means that the top-ranked criterion is treated as the reference baseline.
-
For every other criterion j > 1, the comparative importance is obtained by adding 1 to the rough number interval: s j = RN(C j ) + 1.
Step 1.5: recalculating weights
After obtaining the comparative importance intervals s j , the next step is to compute the recalculated coefficients q j as follows:
-
For the most important criterion (the reference baseline), the recalculated coefficient is fixed as q 1 = (1, 1).
-
For every subsequent criterion j > 1, the coefficient is computed iteratively by dividing the previous coefficient by the current comparative importance: q j = q j-1 /s j .
Step 1.6: calculating the relative weights
Once the recalculated coefficients q j have been obtained, the final step is to normalize them to produce the relative rough weights w j . This is formally expressed in Eq. 3:

where both the numerator and the denominator are intervals, so the division is again performed using interval arithmetic. The normalization ensures that the weights sum to 1. Each

 is the final rough weight interval for criterion C
j
, representing its relative importance after accounting for expert disagreement and uncertainty. These rough weights are then applied as inputs in the COPRAS method to evaluate and rank the alternatives under consideration.
2.2 Phase 2: evaluation of alternatives using COPRAS
The COPRAS method, proposed by 44, ranks alternatives by comparing their performance across multiple criteria, distinguishing between beneficial (maximizing) and cost (minimizing) criteria. The integrated R-SWARA-COPRAS method involves the following steps:
Step 2.1: defining alternatives and criteria
Let the alternatives be A = {A 1, A 2, …, A m } and the criteria be C = {C1, C2, …, C n }. The criteria are partitioned into a beneficial set J + ⊆ {1, 2, …, n} and a non-beneficial set J - ⊆ {1, 2, …, n}, where J + ∩ J - = ∅ and J + ∪ J - = {1, 2, …, n}.
Step 2.2: establishing the decision matrix
A decision matrix
 is created in which each alternative A
i
is evaluated against each criterion C
j
. The matrix entries x
ij
represent expert-assigned performance scores for alternative A
i
under criterion C
j
. These scores can be individual expert values or aggregated through rough number logic, if multiple expert evaluations per entry are available. In this study, the individual expert scores were aggregated via the simple average.
Step 2.3: normalizing the decision matrix
The decision matrix
 is normalized to eliminate the influence of differing units across criteria. For each criterion j, the normalized value is computed using Eq. 4.

This ensures that each value is expressed as a proportion of the total performance under that criterion.
Step 2.4: applying the criterion weights
Let w j be the weight of criterion C j from R-SWARA. Next, the weighted normalized matrix D = (d ij ) is defined as shown in Eq. (5)

Step 2.5: Computing maximizing and minimizing indices
The next step is to separate the contributions of beneficial criteria (the higher the better) and non-beneficial criteria (the lower the better).
Eq. 6 is used for the beneficial criteria J +:

Eq. 7 is used for the non-beneficial criteria J -:

Step 2.6: calculating the relative significance
Once the maximizing and minimizing indices have been calculated, COPRAS combines them into a single measure of performance for each alternative called the relative significance Q i , as defined by Eq. (8)

Step 2.7: computing the utility degree and ranking the alternatives
Finally, the utility degrees U i are computed by Eq. (9)

where
 is the best (maximum) relative significance among all alternatives. The alternative with the highest utility score (i.e., U
i
= 100%) is considered to be the most preferred. Other alternatives are scaled proportionally relative to the most preferred one.
The proposed framework provides structured decision support, but it involves several assumptions and limitations. First, the weighting stage depends on expert judgement; although the method is designed to structure and aggregate these judgements, different expert panels may yield different weights and rankings. Second, the results are sensitive to the definition and operationalization of criteria (including the way in which benefit and cost criteria are specified) and to the quality of the input assessments. Third, the analysis reflects the context of the case and the set of evaluated alternatives. Consequently, the ranking should not be interpreted as universally generalizable beyond the study setting. Finally, as with many MCDM approaches, the method does not fully capture dynamic changes over time (e.g., performance variability or market shocks) unless updated inputs are provided.
3. Results
To apply the proposed method, a case study was conducted to evaluate 3PL providers in the refrigerated transportation sector for a mid-sized fishery in Indonesia. We applied the integrated R-SWARA and COPRAS methodology outlined in Section 2 to select the most suitable 3PL provider who ensured product freshness in cold chain logistics. This case study details the selection of criteria, the expert panel, the data collection process, and the input data, providing the foundation for the analysis presented in Section 4.
3.1 Defining the criteria
The company aims to select a 3PL provider from six candidates (A, B, C, D, E, F) based on criteria tailored to cold chain logistics requirements. Based on the company’s operational needs and prior literature 9-11, seven criteria were identified for 3PL evaluation:
-
Security (C1) measures the provider’s ability to ensure safe handling and protection of perishable goods against theft, damage, or contamination.
-
Punctuality (C2) evaluates the provider’s reliability in meeting delivery schedules, critical for minimizing spoilage in cold chain logistics.
-
Cost (C3) assesses the total logistics cost, including transportation and handling fees, as a minimizing criterion.
-
Delivery area (C4) gauges the provider’s coverage and ability to serve diverse geographic markets, including remote regions.
-
Customer service (C5) reflects the provider’s responsiveness and communication quality in addressing client needs and issues.
-
Assurance (C6) measures the provider’s compliance with quality standards (e.g., ISO certifications, cold chain protocols) and reliability guarantees.
-
Logistics experience (C7) evaluates the provider’s expertise and track record in refrigerated transportation for perishable goods.
3.2 Collecting the data
Three experts with extensive experience in fishery logistics were engaged to assess the evaluation criteria and alternative vendors. Although the number of experts was limited, it remained within the range of commonly reported in previous research works, involving panels of three 36, 45, 46, four 47, or five experts 48-50. The three experts in the study possess experience and knowledge related to cold logistic providers (Table I), ensuring a reliable assessment. The data collection process ensured a diversity of perspectives while maintaining consistency through structured questionnaires, and it facilitated discussions to resolve ambiguities. The questionnaire was divided into two main sections. The first section aimed to determine the relative importance of each criterion. The experts ranked the criteria, with a lower score representing the most important and higher score indicating the least important. The result is shown in Table II. The second section focused on the performance evaluation of each 3PL parties. The experts scored the six 3PL providers (A, B, C, D, E, F) regarding each criterion via a 0-100 scale, based on historical performance data, service agreements, and site visits. The result is shown inTable III.
Table I: Expert background

Table II: Result of the ranking

Table III: 3PL provider scores

3.3 Result and discusión
The R-SWARA method was applied to determine the weights of the seven criteria identified. Using the expert ranks from Table I, the criteria were first ranked by averaging the ranks to establish a strict order. The order from the most to the least preferred can be presented as follows: C2 ≻ (C4 and C5; tie) ≻ (C1, C3, C6; tie) ≻ C7. Using Eqs. 1 and 2, the rough numbers for each criterion are calculated. For instance, criteria C4 = {2,1,1} has
 and
 . Thus,
 and
 Therefore,
 and
 . Using the same procedure, the rough numbers for each criterion are as follows: RN(C4) = (1.11,1.55), RN(C2) = (1.00,1.00), RN(C5) = (1.11,1.55), RN(C1) = (1.45,1.89), RN(C3) = (1.45,1.89), RN(C6) = (1.45,1.89), RN(C7) = (2.00,2.00). The normalization of the matrix yielded the following rough numbers for each criterion: RN(C2) = (1, 1), RN(C4) = RN(C5) = (0.55, 0.775), RN(C1) = RN(C3) = RN(C6) = (0.725, 0.945).
Afterwards, the comparative importance (s
2) was set to (1, 1) for C2 and computed as s
j
+ 1 for others. For instance, RN(C4) = (0.55, 0.775) becomes RN(S4) = (1.55, 1.775). The recalculated weight q
j
and the relative weights are then computed using Eq. 3. For C4,
 and
 Thus, RN(Q4) = (0.563,0,645). With the same equation, each criterion can be calculated. The result is shown in Table IV. The COPRAS method was then applied to rank the six 3PL providers using the averaged scores from Table III, with cost (C3) as a minimizing criterion and the others as beneficial ones. The normalized decision matrix
 is given in Table V. The results of the weighted normalized decision matrix, relative significance, and utility degrees are presented in Tables VI and VII.
Table IV: Result of the R-SWARA method

Table V: Normalized decision matrix

Table VI: Weighted Normalized Decision Matrix

Table VII: Relative significance and utility degrees

As summarized in Table VIII, the findings align with prior studies on 3PL selection, particularly in emphasizing criteria like punctuality and security for perishable goods logistics, in order to ensure product freshness and reliability. The high weight assigned to punctuality underscores its importance in maintaining strict delivery schedules to prevent spoilage, while security reflects the necessity of protecting perishable goods from contamination or damage. For instance, 9 highlighted on-time delivery and vehicle quality as key factors in FMCG logistics, which share similarities with fisheries’ cold chain requirements. Similarly, 10 identified performance and quality assurance as critical in the oil and gas industry, supporting the relevance of criteria like assurance (C6) and customer service (C5) in this study. However, unlike the aforementioned studies, which used single-value weights (e.g., via AHP or TOPSIS), the integration of R-SWARA addresses expert subjectivity by incorporating rough set intervals, offering a methodological advancement over traditional approaches. This is consistent with 43, who demonstrated R-SWARA’s robustness in handling uncertainty regarding transport-related decisions. The use of COPRAS further complements R-SWARA by providing a comprehensive ranking that balances trade-offs across all criteria, including the minimizing criterion cost (C3), which aligns with the emphasis placed by 11 on cost efficiency in FMCG logistics. The close utility degrees suggest competitive performance among vendors, but the leading provider’s dominance reflects its balanced excellence across all criteria, particularly those critical to cold chain logistics.
Table VIII: Comparative table of related works

3.4 Sensitivity Analysis
To evaluate the robustness of the integrated R-SWARA and COPRAS methods for selecting 3PL providers for a mid-sized fishery in Jakarta, Indonesia, a sensitivity analysis was conducted by varying the weight of the highest-ranked criterion, punctuality (C2), established with a rough weight interval of (0.142, 0.170). Punctuality was selected due to its critical role in cold chain logistics, as timely delivery is essential to prevent the spoilage of perishable seafood. The midpoint of C2’s weight, calculated as (0.142 + 0.170) / 2 = 0.156, was adjusted by ± 20%, resulting in a reduced weight of 0.125 (80% of 0.156) and an increased weight of 0.187 (120% of 0.156). To maintain the normalization requirement (criterion weights must sum to 1), the weight difference of 0.031 was redistributed equally across the six remaining criteria: security ((0.113, 0.175)), cost ((0.126, 0.192)), delivery area ((0.080, 0.110)), customer service ((0.124, 0.195)), assurance ((0.126, 0.192)), and logistics experience ((0.122, 0.166)). In the reduced case, each criterion’s midpoint weight increased by approximately 0.005 (0.031/6), whereas, in the increased case, each decreased by 0.005. The COPRAS method was then reapplied, recomputing the weighted normalized matrix, the maximizing and minimizing indices, the relative significance scores, and the utility degrees for the six 3PL providers (A, B, C, D, E, F).
In the reduced weight scenario (C2=0.125), the recalculated utility degrees were approximately as follows: Vendor A at 100%, Vendor D at 99.0%, Vendor C at 98.6%, Vendor F at 98.5%, Vendor E at 98.0%, and Vendor B at 96.9%. The ranking order remained stable (A > D > C > F > E > B), with slight increases in utility degrees for non-top vendors, as the reduced emphasis on punctuality, where Vendor A scored highly with an average of 91.33, slightly narrowed the performance gap. In the increased weight scenario (C2=0.187), the utility degrees were approximately as follows: Vendor A at 100%, Vendor D at 98.7%, Vendor C at 98.3%, Vendor F at 98.2%, Vendor E at 97.6%, and Vendor B at 96.5%. The ranking order was unchanged, with slightly decreased utility degrees due to the greater emphasis on punctuality, amplifying Vendor A’s advantage. The tie between Vendors C and F persisted in both scenarios, reflecting their closely matched performance across criteria, particularly in customer service and delivery area.

Figure 2: Sensitivity analysis
To further validate robustness, an additional sensitivity analysis varied the weights of customer service ((0.124, 0.195)) and delivery area ((0.080, 0.110)) by ± 20% simultaneously, redistributing the weight changes across the remaining criteria. The results consistently maintained the ranking order, with Vendor A at 100%, followed by D, C, F, E, and B, though utility degree gaps narrowed slightly (e.g., D at 99.1%, C and F at 98.5% in the reduced case), as shown in Fig. 2. This stability, driven by R-SWARA’s use of rough set intervals to capture expert uncertainty, aligns with the findings of 43, who demonstrated R-SWARA’s reliability in transport-related decisions. However, extreme weight changes, such as ± 50% for punctuality, could potentially disrupt the tie between Vendors C and F, indicating sensitivity to significant shifts in critical criteria.
4. Conclusions
The findings of this study contribute to the literature on 3PL evaluation by addressing several limitations identified in previous research. Unlike conventional studies that rely on crisp expert inputs, the proposed framework incorporates uncertainty-aware weighting through R-SWARA, allowing expert hesitation and variability in judgments to be systematically represented. This particularly relevant in cold-chain logistics, where performance assessment involves complex trade-offs between punctuality, reliability, and service quality.
The originality of this study also lies in the integration of R-SWARA and COPRAS, which produces a utility-based ranking that remains transparent and interpretable for decision-makers. By avoiding reliance on distance-based ideal solutions, the COPRAS approach facilitates a direct comparison of alternatives and preserves the influence of all criteria, including those with relatively lower weights. The inclusion of sensitivity analysis further strengthens the robustness of the results, demonstrating that the ranking of 3PL providers remains stable under variations in key criteria weights.
In practical terms, these results offer actionable guidance for the fishery company. Vendor A’s top ranking indicates that it is the most reliable choice for ensuring timely and secure delivery of seafood, critical for maintaining product quality and customer satisfaction in domestic and international markets. Vendor D’s strong performance regarding customer service and delivery area suggests it as a viable alternative, particularly if cost negotiations or expanded market coverage are prioritized. The tie between Vendors C and F highlights their comparable suitability, potentially allowing the company to consider additional factors (e.g., contract terms, scalability). The lower rankings of Vendors E and B, driven by weaker scores in punctuality and security, suggest that they may require improvements to meet cold chain standards. These findings can inform contract negotiations, performance monitoring, and strategic partnerships, ensuring alignment with the company’s operational goals of minimizing spoilage and meeting stringent temperature controls (e.g., 0-4°C for fresh fish). Furthermore, the study supports the studied fishery in promoting sustainable logistics practices by systematically comparing alternatives that align economic efficiency with environmental and social responsibility through reduced food losses, improved energy efficiency in refrigerated transport via punctual deliveries, and sustained product quality.
Despite its contributions, the study has limitations that warrant consideration. The reliance on three experts, while sufficient for R-SWARA’s group decision-making, may limit the diversity of perspectives, potentially overlooking nuances in vendor performance. Future studies could involve a larger expert panel or incorporate stakeholder inputs (e.g., customers, regulators) to enhance robustness. Additionally, this study assumes equal weighting of expert opinions, which may not account for varying levels of expertise, so weighted aggregation methods could be explored. The use of averaged vendor scores in COPRAS simplifies the analysis but may dilute the uncertainty handling of the rough set approach, suggesting a need for fully rough-based ranking in future work. Finally, the case study’s focus on a single fishery in Indonesia limits generalizability, so applying the methodology to other perishable goods industries (e.g., dairy, pharmaceuticals) could validate its broader applicability. Future research could also compare R-SWARA-COPRAS with other MCDM methods to assess relative performance or integrate real-time data (e.g., GPS tracking, temperature logs) for dynamic 3PL evaluation.
References
License
Copyright (c) 2026 Adhie Prayogo, Muhammad Mujiya Ulkhaq

This work is licensed under a Creative Commons Attribution-NonCommercial-ShareAlike 4.0 International License.

From the edition of the V23N3 of year 2018 forward, the Creative Commons License "Attribution-Non-Commercial - No Derivative Works " is changed to the following:
Attribution - Non-Commercial - Share the same: this license allows others to distribute, remix, retouch, and create from your work in a non-commercial way, as long as they give you credit and license their new creations under the same conditions.